. 2020 Aug 12;17(1):40.
doi: 10.1186/s12989-020-00371-1.

Carbon nanotube filler enhances incinerated thermoplastics-induced cytotoxicity and metabolic disruption in vitro

Affiliations

Carbon nanotube filler enhances incinerated thermoplastics-induced cytotoxicity and metabolic disruption in vitro

Jayme P Coyle et al. Part Fibre Toxicol. .

Abstract

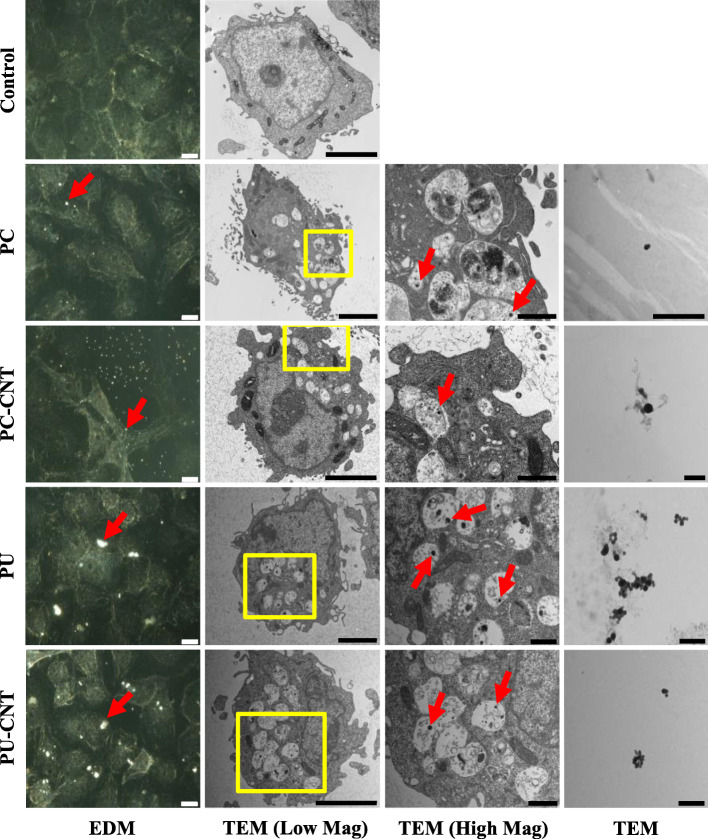
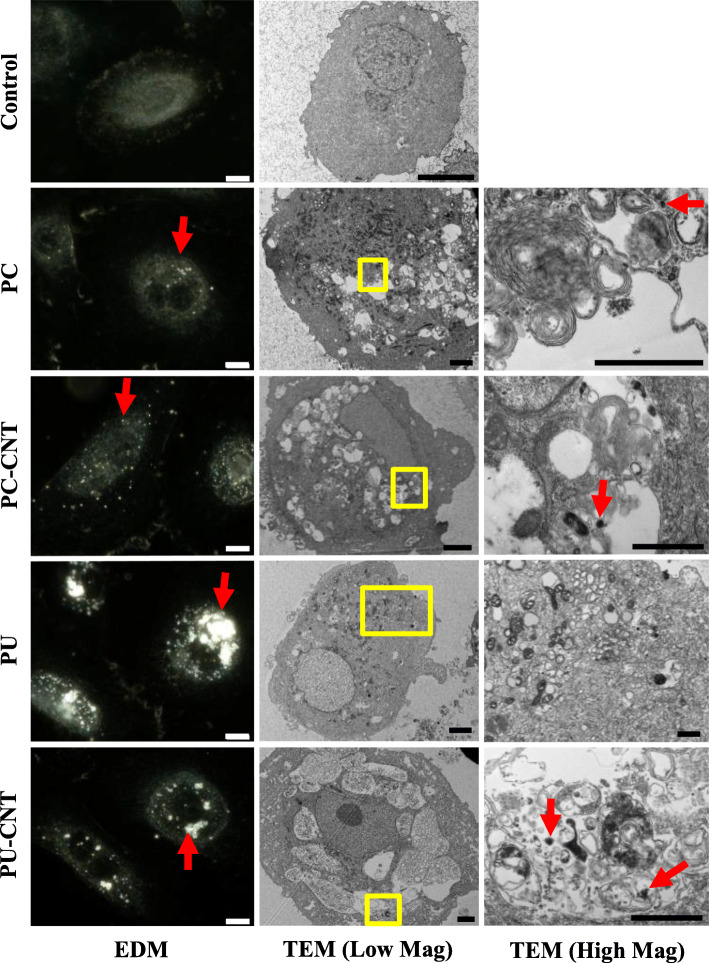
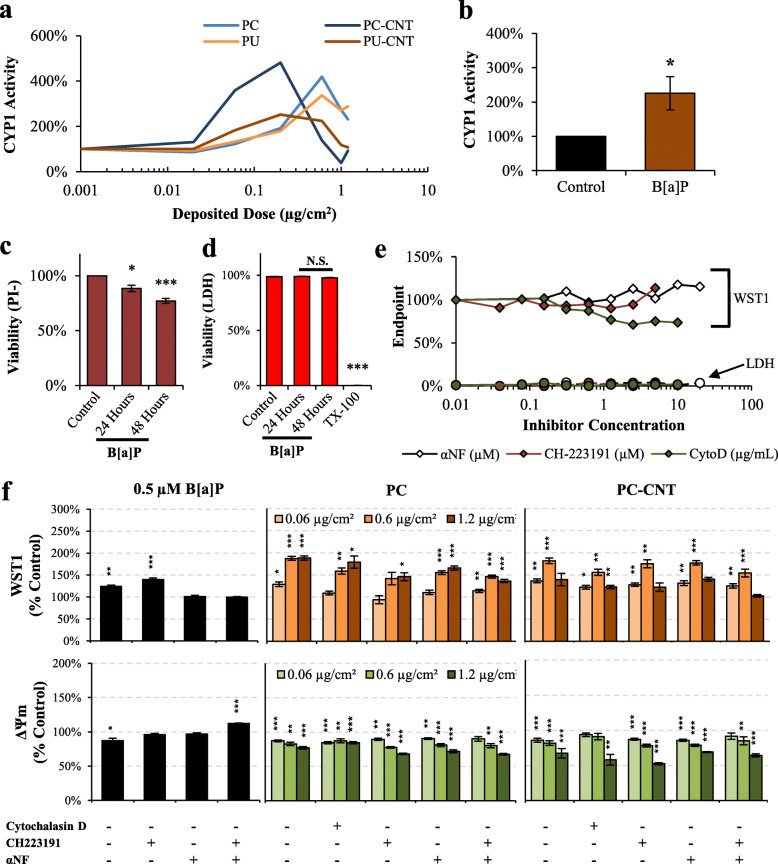
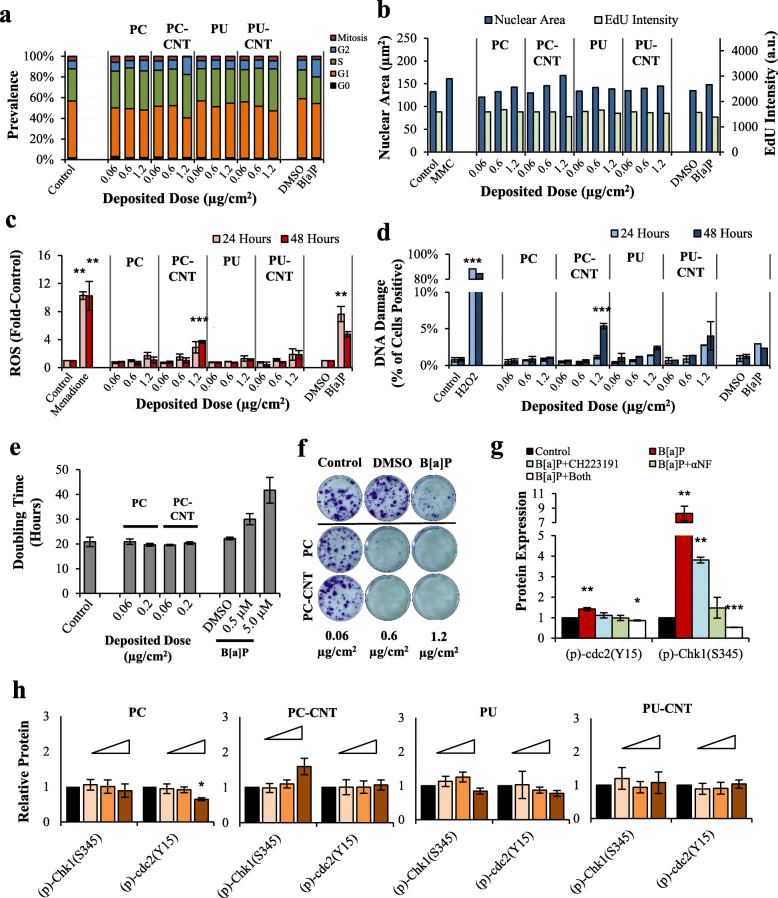
Background: Engineered nanomaterials are increasingly being incorporated into synthetic materials as fillers and additives. The potential pathological effects of end-of-lifecycle recycling and disposal of virgin and nano-enabled composites have not been adequately addressed, particularly following incineration. The current investigation aims to characterize the cytotoxicity of incinerated virgin thermoplastics vs. incinerated nano-enabled thermoplastic composites on two in vitro pulmonary models. Ultrafine particles released from thermally decomposed virgin polycarbonate or polyurethane, and their carbon nanotube (CNT)-enabled composites were collected and used for acute in vitro exposure to primary human small airway epithelial cell (pSAEC) and human bronchial epithelial cell (Beas-2B) models. Post-exposure, both cell lines were assessed for cytotoxicity, proliferative capacity, intracellular ROS generation, genotoxicity, and mitochondrial membrane potential.

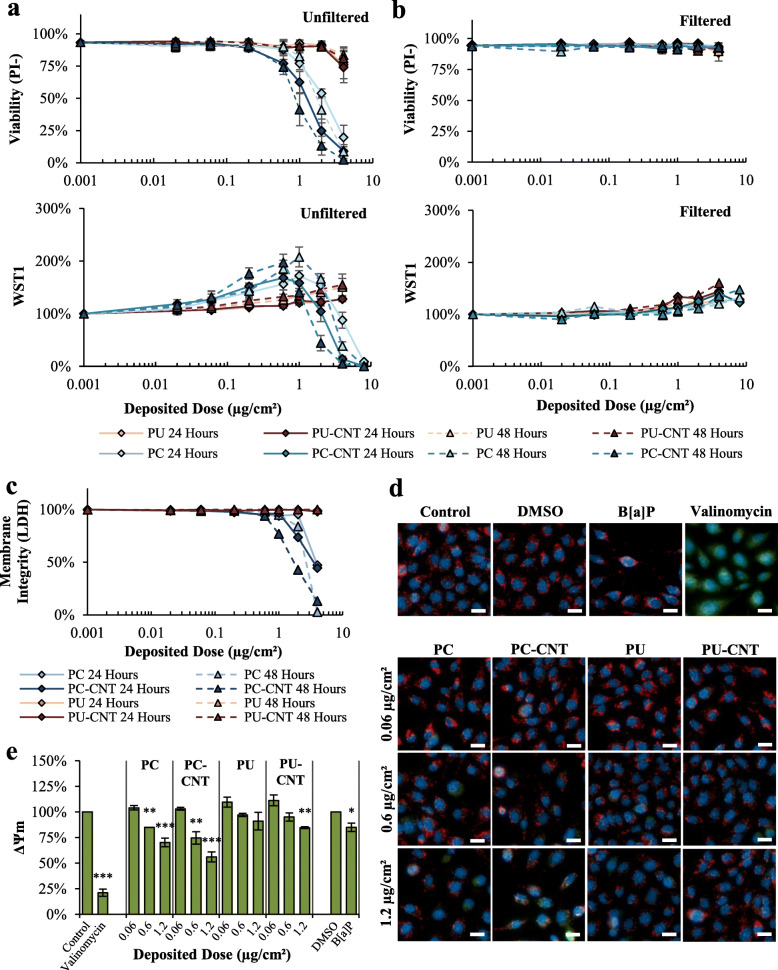
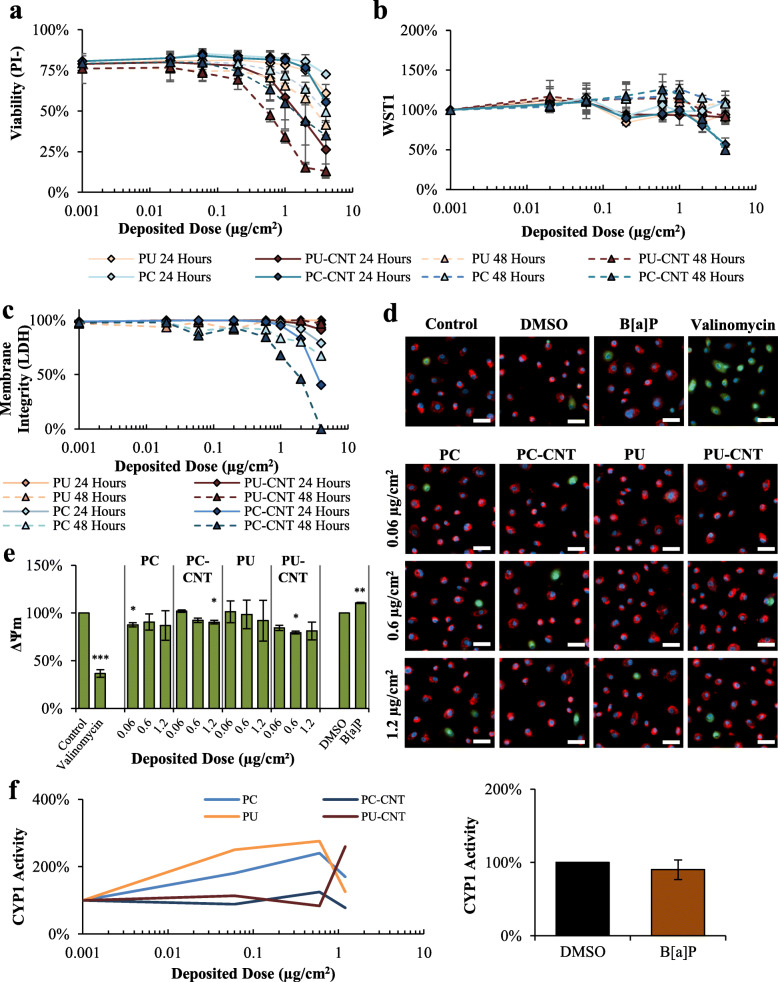
Results: The treated Beas-2B cells demonstrated significant dose-dependent cellular responses, as well as parent matrix-dependent and CNT-dependent sensitivity. Cytotoxicity, enhancement in reactive oxygen species, and dissipation of ΔΨm caused by incinerated polycarbonate were significantly more potent than polyurethane analogues, and CNT filler enhanced the cellular responses compared to the incinerated parent particles. Such effects observed in Beas-2B were generally higher in magnitude compared to pSAEC at treatments examined, which was likely attributable to differences in respective lung cell types.

Conclusions: Whilst the effect of the treatments on the distal respiratory airway epithelia remains limited in interpretation, the current in vitro respiratory bronchial epithelia model demonstrated profound sensitivity to the test particles at depositional doses relevant for occupational cohorts.

Keywords: Cytotoxicity; In vitro; Incinerated thermoplastics; Nano-enabled composites; Polycyclic aromatic hydrocarbons.


Conflict of interest statement

The authors declare that they have no competing interests.

Figures

Fig. 1
Fig. 1
Microscopic assessment of Beas-2B cells treated with incinerated thermoplastics. Beas-2B treated with 0.6 μg/cm2 or 1.2 μg/cm2 incinerated for 48 h were visualized via enhanced darkfield microscopy (EDM) or transmission electron microscopy (TEM), respectively. Particles in suspension were also visualized by TEM for comparison against structures identified in Beas-2B cells. Incinerated thermoplastics visualized by EDM are identified by a bright spectral signature (Magnification: 60X, scale bar = 10 μm). Cells treated with incinerated thermoplastics were visualized under low magnification (Scale Bar = 4 μm) and high magnification (Yellow Box denotes region of high magnification, Scale Bar = 1 μm). Particle dispersed in water were prepared and visualized for TEM (Scale Bar = 1 μm). Endocytosed particles are identified by red arrows in EDM and high magnification TEM images
Fig. 2
Fig. 2
Microscopic assessment of pSAECs treated with incinerated thermoplastics. pSAECs treated with 0.6 μg/cm2 or 1.2 μg/cm2 incinerated for 48 h were visualized via enhanced darkfield microscopy (EDM) or transmission electron microscopy (TEM), respectively. Particles in suspension were also visualized by TEM (Fig. 1) for comparison against structures identified in pSAECs. Incinerated thermoplastics visualized by EDM are identified by a bright spectral signature (Magnification: 60X, scale bar = 10 μm). Cells treated with incinerated thermoplastics were visualized under low magnification (Scale Bar = 4 μm) and high magnification (Yellow Box denotes region of high magnification, Scale Bar = 1 μm). Endocytosed particles are identified by Red arrows
Fig. 3
Fig. 3
Cytotoxicity assessment of incinerated thermoplastics in Beas-2B Cells. a Dose-response curves to graded depositional doses of incinerated thermoplastics reported by live-cell imaging and WST1 reduction for particle containing suspensions. b Analogous dose-responses via live-cell imaging and WST1, except particle suspensions were filtered through a 0.2 μm pore to devoid treatments of particles, leaving only particle- associated leachables in AEGM. c Interference-adjusted LDH release 24 and 48 h after exposure to depositional doses used in live-cell imaging assessments. d-e Representative images of JC-1-reported ΔΨm measurement 24 h after exposure; scale bars = 20 μm. As a comparison, 0.5 μM B[a]P served as a representative PAH to compare to particle treatments; 10 μM valinomycin served as a positive control for ΔΨm dissipation. e Quantitative metrics of images analyzed are presented with statistical comparisons. Point estimates are the arithmetic mean of 2–4 independent experiments; error bars indicate standard error of the mean (SEM); *p < 0.05, **p < 0.01, ***p < 0.001 compared to respective controls. Images taken at 40X
Fig. 4
Fig. 4
Cytotoxicity assessment of incinerated thermoplastics in pSAECs. a-b Dose-response curves to graded depositional doses of incinerated thermoplastics reported by live-cell imaging and WST1 reduction for particle containing suspensions. c Interference-adjusted LDH release 24 and 48 h after exposure to depositional doses used in live-cell imaging assessments. d-e Representative images of JC-1-reported ΔΨm measurement 24 h after exposure; scale bars = 50 μm. As a comparison, 0.5 μM B[a]P served as a representative PAH to compare to particle treatments; 10 μM valinomycin served as a positive control for ΔΨm dissipation. e Quantitative metrics of images analyzed are presented with statistical comparisons. f-g pSAECs were assessed for CYP1 activity 48 h post exposure to incinerated thermoplastics and 0.5 μM B[a]P. Point estimates are the arithmetic mean of 2 independent experiments; error bars indicate standard error of the mean (SEM); *p < 0.05, **p < 0.01, compared to respective controls. Images taken at 20X
Fig. 5
Fig. 5
Characterization of AhR-associated effects in Beas-2B cells. a-b CYP1 activity 48 h post exposure to incinerated thermoplastics and 0.5 μM B[a]P. c-d B[a]P cytotoxicity assessment were conducted using live-cell imaging and membrane permeability (LDH). e Beas-2B cells were treated with graded concentrations of cytochalasin D (CytoD), CH223191, and αNF and assessed for proliferation (WST1; Diamonds) and membrane permeability (LDH; Circles) for co-exposure dose selection. f B[a]P- and incinerated thermoplastic-treated cells were co-incubated with 0.5 μg/mL CytoD, 5 μM CH223191, 10 μM αNF, CH223191 and αNF simultaneously, followed by assessment for WST1 metabolism and ΔΨm. Control bars are not displayed as all data points are normalized to respective controls designated as 100%. Point estimates are the arithmetic mean of 3–4 independent experiments; error bars indicate standard error of the mean (SEM); *p < 0.05, **p < 0.01, ***p < 0.001 compared to respective controls
Fig. 6
Fig. 6
Cell cycle analysis and nuclear morphometry in Beas-2B cells. a-b Quantitative binning of cell cycle-specific phases and nuclear morphometry, including nuclear area and EdU uptake [in arbitrary units (a.u.)] analyzed from high-content screening 24-h post treatment. MMC = 0.76 ng/mL mitomycin C – a clastogen control. Results are from a single experiment. c Intracellular ROS was measured 24 and 48 h after treatment; 100 μM Menadione served as a positive control for ROS generation. B[a]P-induced intracellular ROS was significant at both time points - limited space precluded asterisk placement above the 48-h time point. d Cells treated for 24 and 48 h were stained for yH2AX; H2O2 served as a positive control. Results are presented as percent of cells positive for yH2AX out of the total cell population (> 1000/experiment). e Cells treated with PC/−CNT and B[a]P assessed for doubling time from growth curves from 3 independent experiments. f Clonogenic assay of Beas-2B cells treated for 3 days. g Western Blot analysis of B[a]P-treated cells for 24 h with and without inhibitors for AhR (Ch223191) or CYP1 (αNF). h Western Blot analysis of Beas-2B treated with 0.06, 0.6, and 1.2 μg/cm2 cells for 24 h; controls are solid black whilst concentrations are indicated by wedge where the 1.2 μg/cm2 treatment is represented by the thickest portion of the wedge. Point estimates for d and f are the arithmetic mean of 2–3 independent experiments; error bars indicate standard error of the mean (SEM); *p < 0.05, **p < 0.01, ***p < 0.001 compared to respective controls

References

    1. Sastri VR. Plastics in medical devices: properties, requirements and applications. 2. Boston: Elsevier; 2010.
    1. Ibeh CC. Thermoplastic materials: properties, manufacturing methods, and applications. Boca Raton: CRC Press; 2011.
    1. Hepburn C. Polyurethane elastomers. 2. New York: Elsevier Science Publishers, LTD; 1992.
    1. Gardea F, Lagoudas DC. Characterization of electrical and thermal properties of carbon nanotube/epoxy composites. Compos Part B Eng. 2014;56:611–620. doi: 10.1016/j.compositesb.2013.08.032. - DOI
    1. Li H, Zhong J, Meng J, Xian G. The reinforcement efficiency of carbon nanotubes/shape memory polymer nanocomposites. Compos Part B Eng. 2013;44(1):508–516. doi: 10.1016/j.compositesb.2012.03.017. - DOI

Publication types