. 2020 Nov 6;295(45):15183-15195.
doi: 10.1074/jbc.RA120.014466. Epub 2020 Aug 11.

HIV-cell membrane fusion intermediates are restricted by Serincs as revealed by cryo-electron and TIRF microscopy

Affiliations

HIV-cell membrane fusion intermediates are restricted by Serincs as revealed by cryo-electron and TIRF microscopy

Amanda E Ward et al. J Biol Chem. .

Abstract

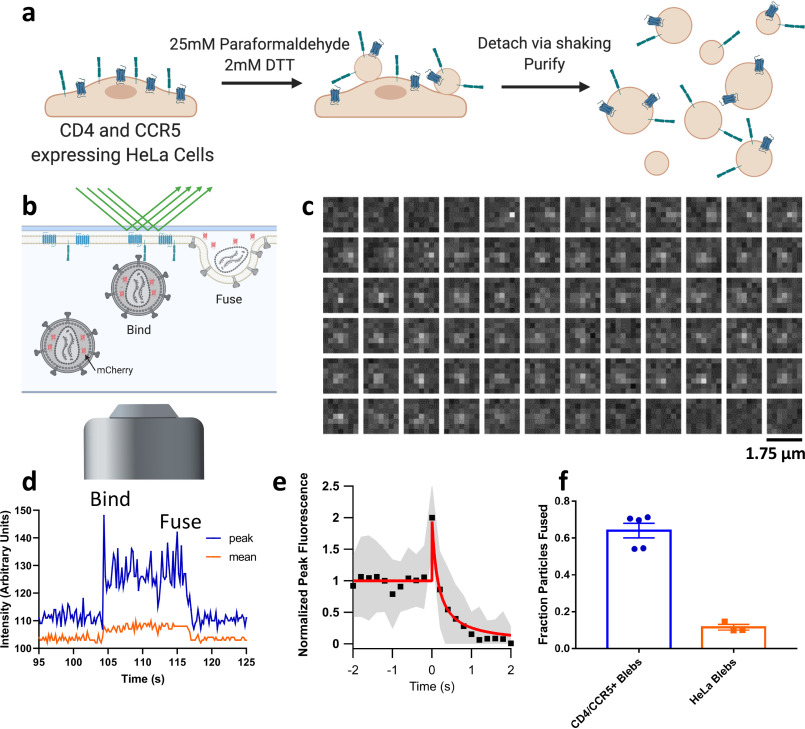
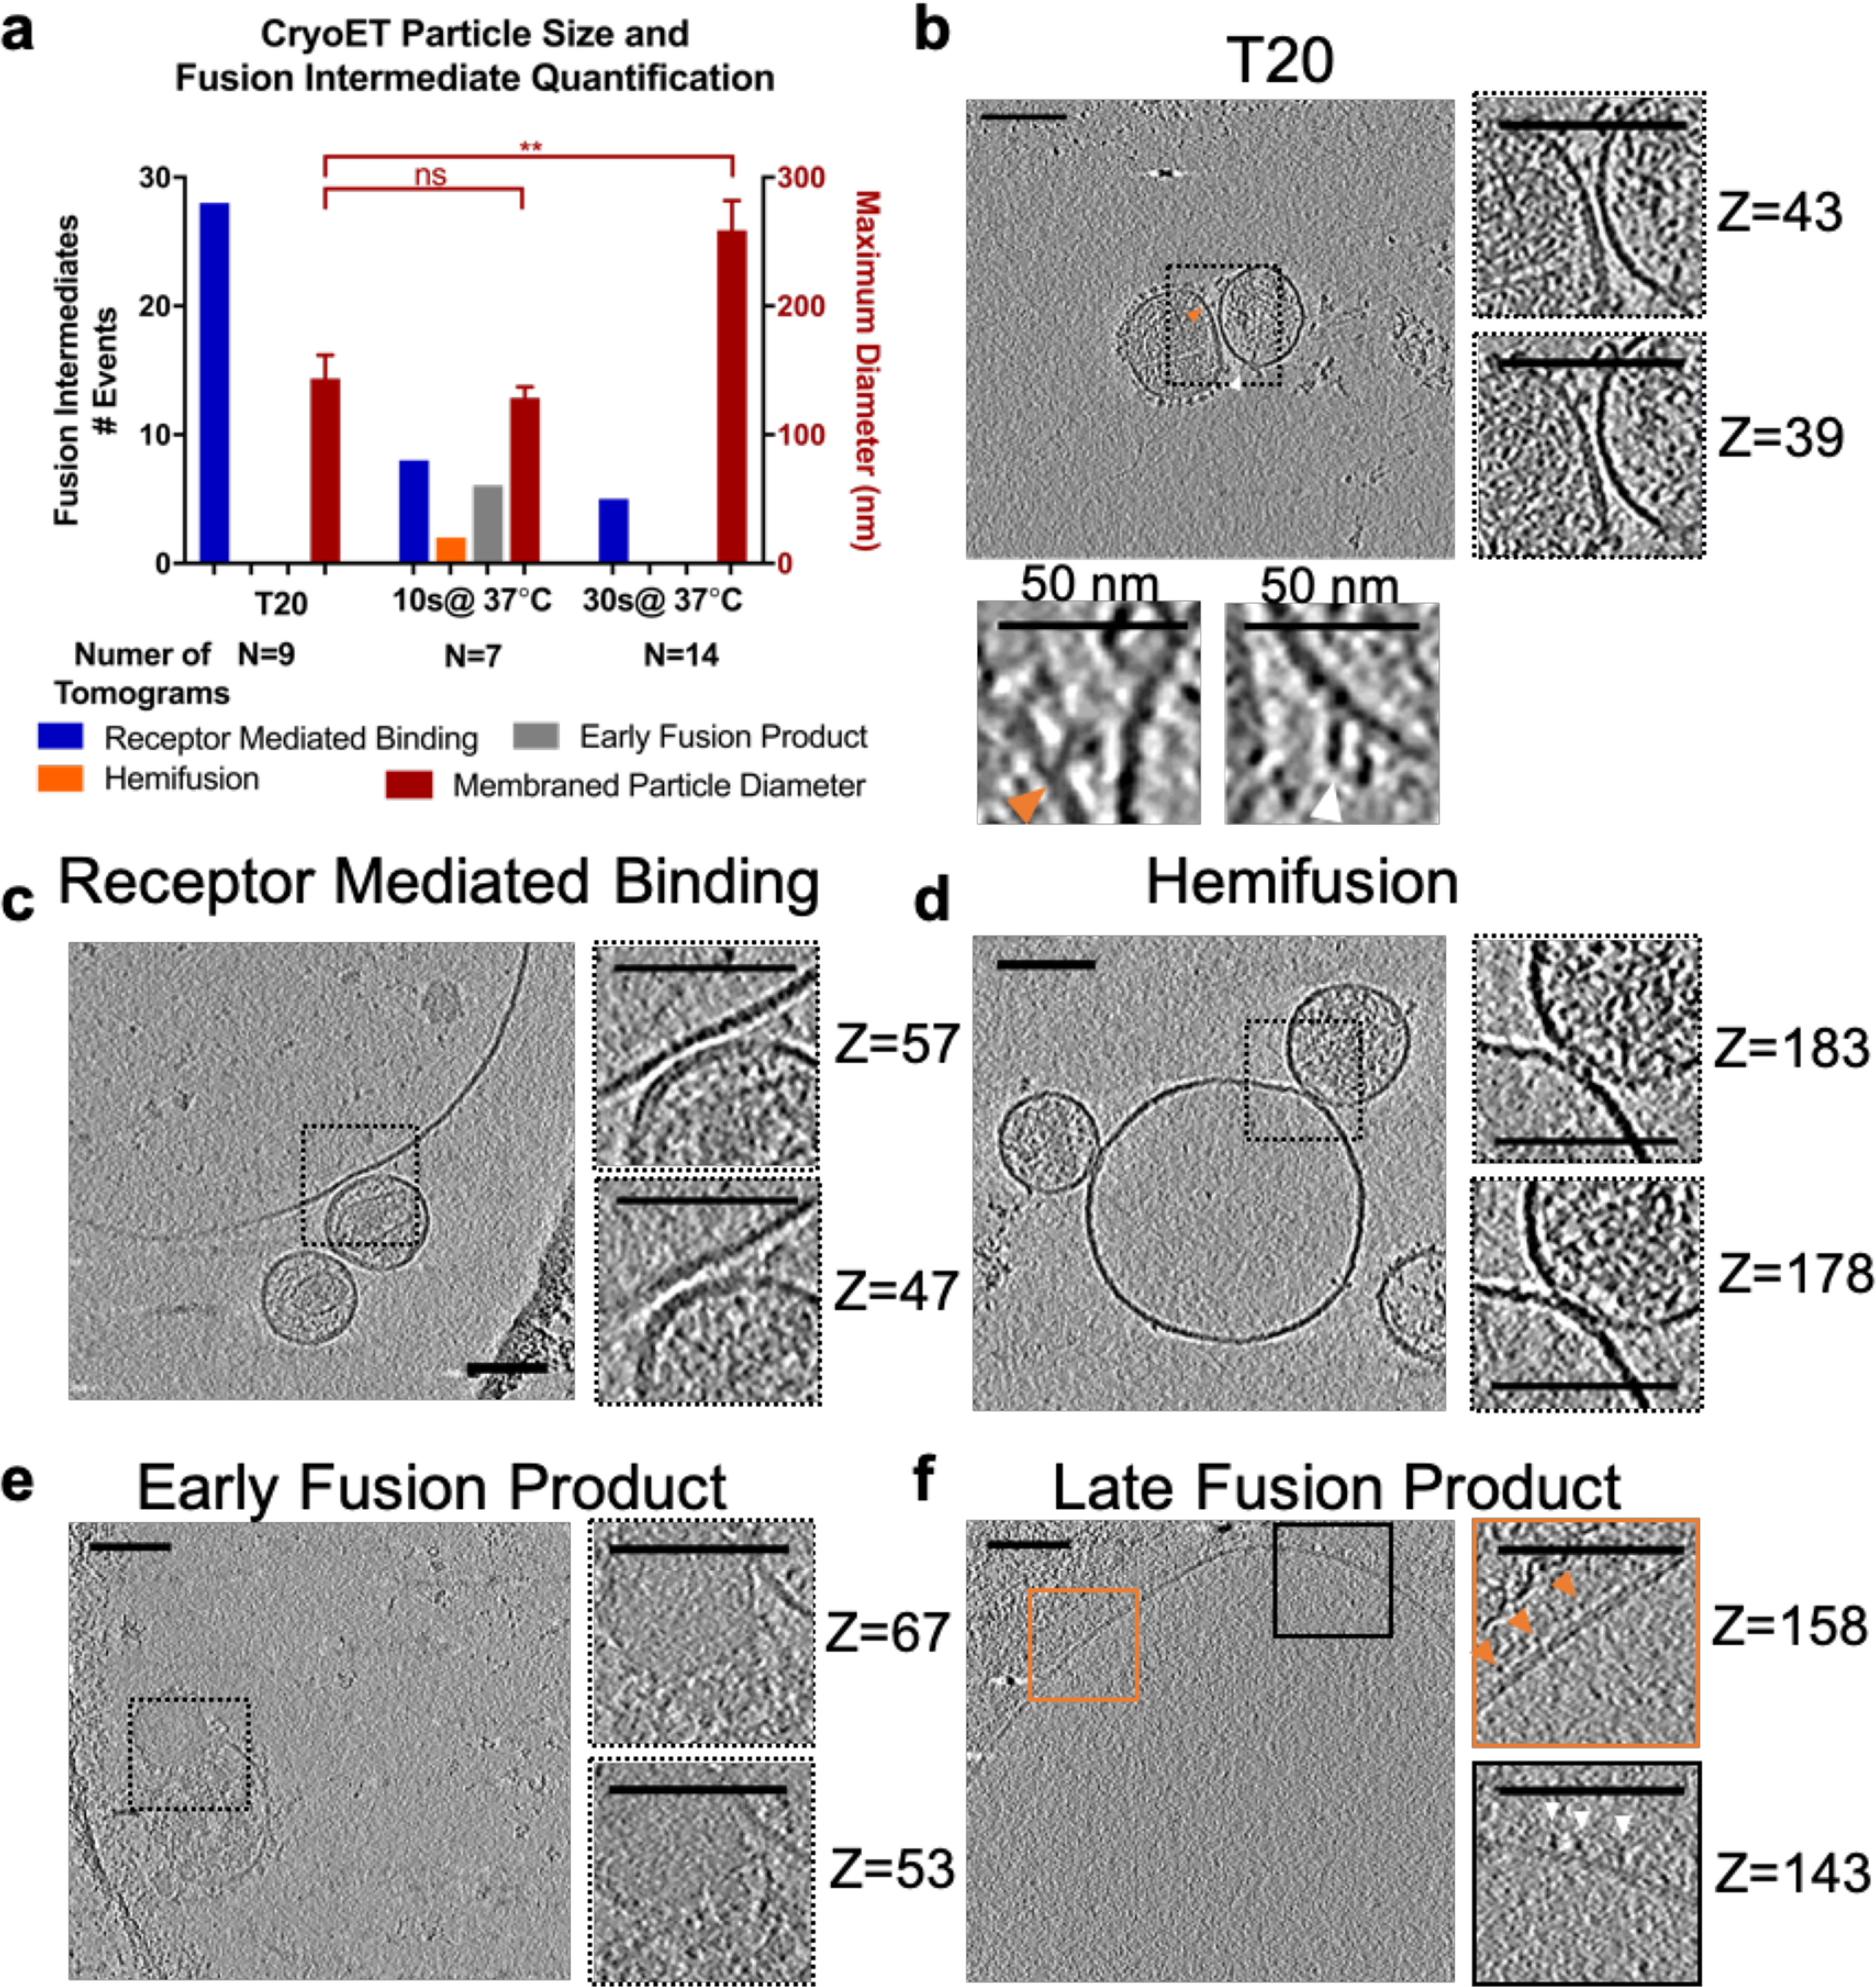
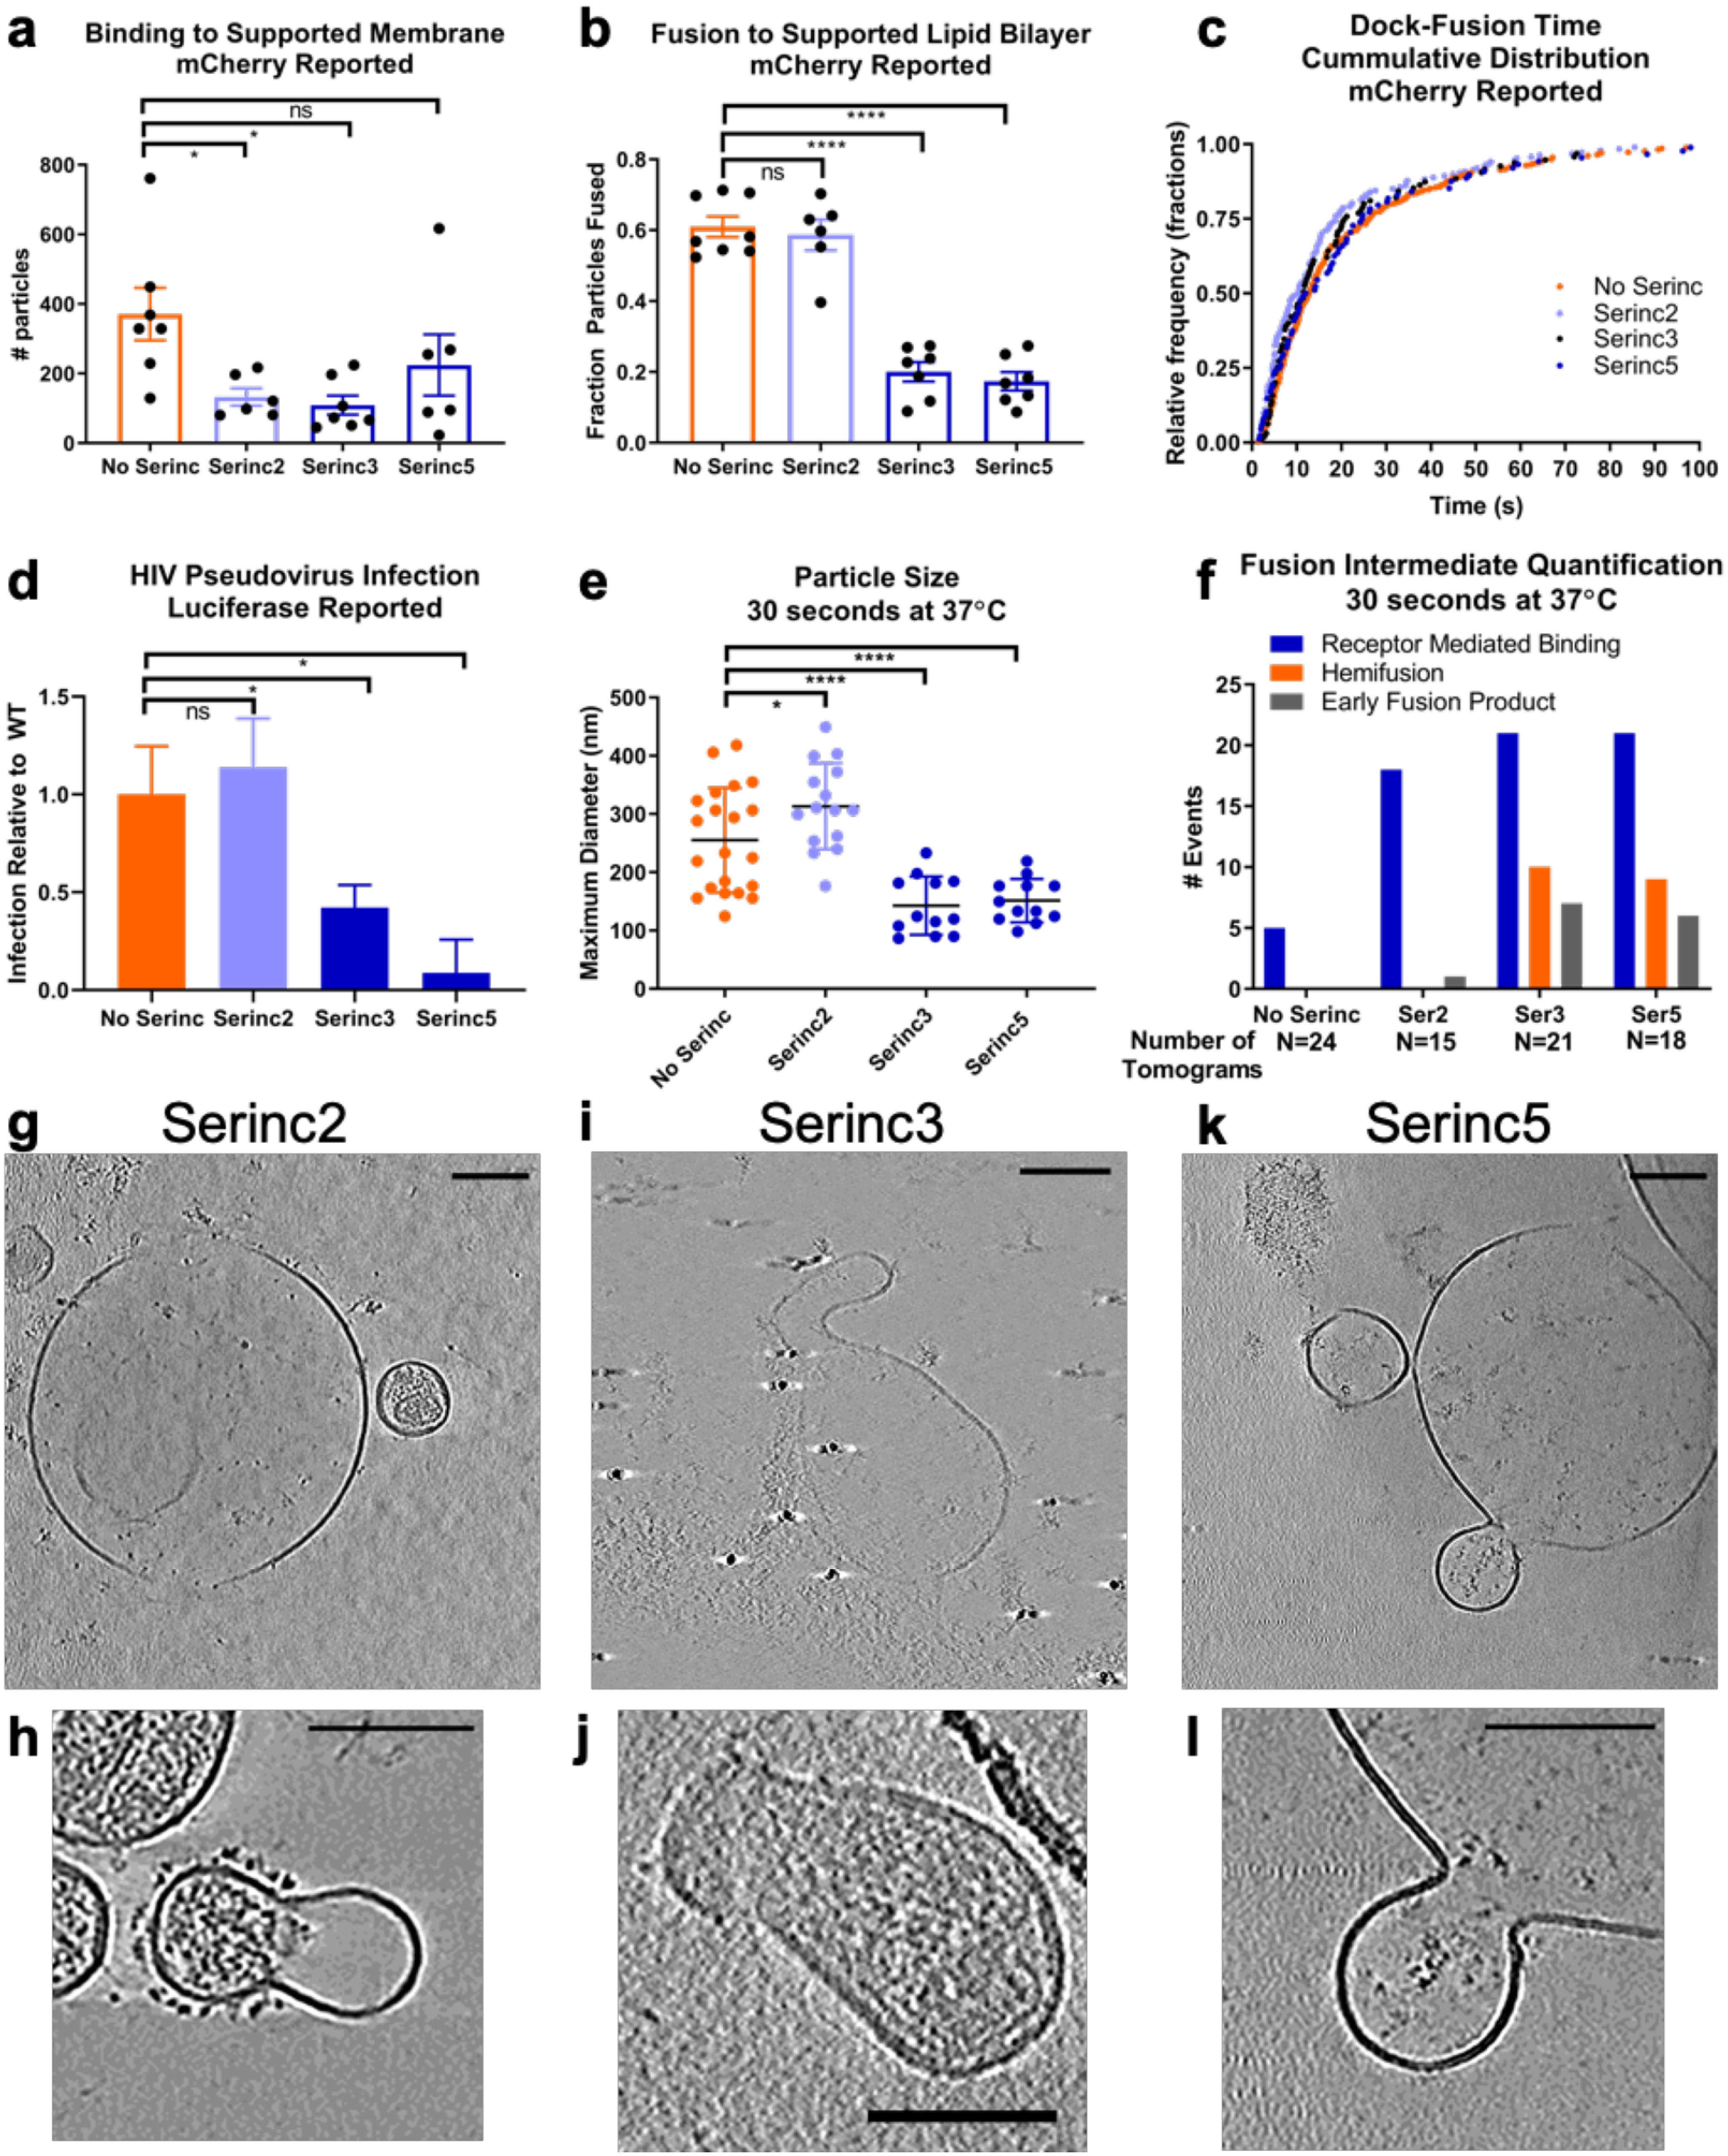
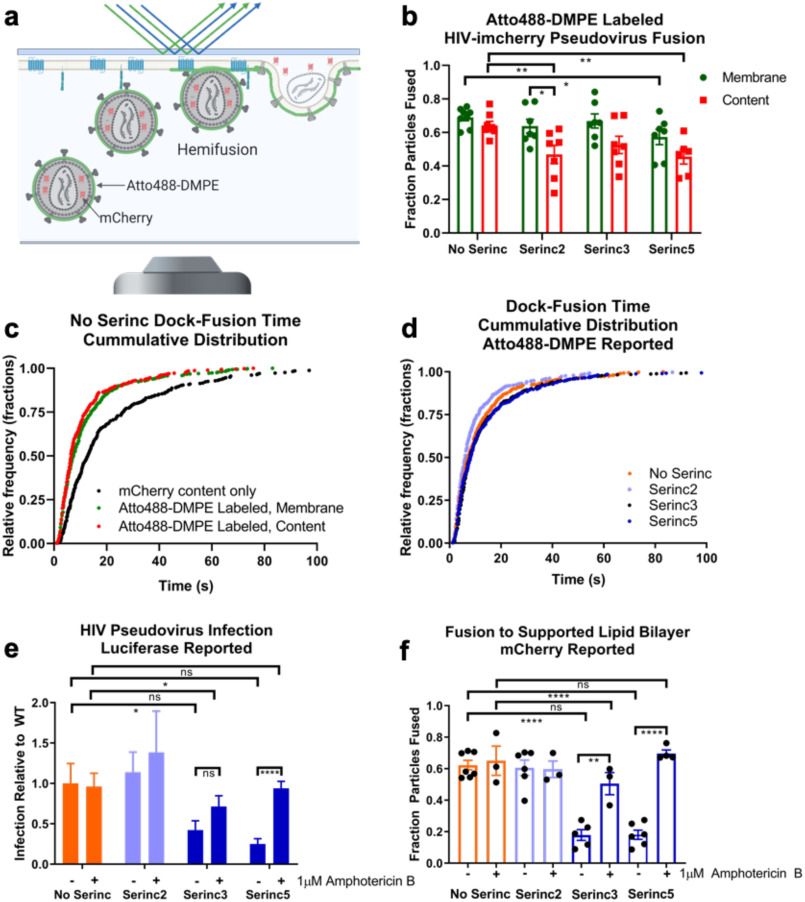
To enter a cell and establish infection, HIV must first fuse its lipid envelope with the host cell plasma membrane. Whereas the process of HIV membrane fusion can be tracked by fluorescence microscopy, the 3D configuration of proteins and lipids at intermediate steps can only be resolved with cryo-electron tomography (cryoET). However, cryoET of whole cells is technically difficult. To overcome this problem, we have adapted giant plasma membrane vesicles (or blebs) from native cell membranes expressing appropriate receptors as targets for fusion with HIV envelope glycoprotein-expressing pseudovirus particles with and without Serinc host restriction factors. The fusion behavior of these particles was probed by TIRF microscopy on bleb-derived supported membranes. Timed snapshots of fusion of the same particles with blebs were examined by cryo-ET. The combination of these methods allowed us to characterize the structures of various intermediates on the fusion pathway and showed that when Serinc3 or Serinc5 (but not Serinc2) were present, later fusion products were more prevalent, suggesting that Serinc3/5 act at multiple steps to prevent progression to full fusion. In addition, the antifungal amphotericin B reversed Serinc restriction, presumably by intercalation into the fusing membranes. Our results provide a highly detailed view of Serinc restriction of HIV-cell membrane fusion and thus extend current structural and functional information on Serinc as a lipid-binding protein.

Keywords: HIV; cryo-electron microscopy; host-pathogen interaction; human immunodeficiency virus (HIV); membrane fusion; single-particle tracking; virus entry.


Conflict of interest statement

Conflict of interest—The authors declare that they have no conflicts of interest with the contents of this article.

Figures

Figure 1.
Figure 1.
Membrane blebs as a model for studying viral fusion. a, cartoon depicting the protocol for making CD4- and CCR5-containing blebs from HeLa cells. Detached blebs are mixed with HIV pseudoviruses and frozen for cryoET or used to form a SPPM as shown in b. b, cartoon showing discrete steps of HIV fusion to a bleb-derived SPPM in a TIRF-based single-particle fusion assay. All pseudoviruses are grown with a genetically encoded soluble content marker, mCherry, that upon fusion diffuses out of the virus and into the cleft between the SPPM and the substrate (described in Ref. 21). c, example micrographs of an HIV pseudovirus particle with a diffusible mCherry content marker fusing with a CD4 and CCR5 containing SPPM. Each box represents the same region separated in time by 0.2 s. d, fluorescence intensity of the same particle is plotted over time, where peak is the intensity of the brightest pixel in the 7 × 7 region and mean is the average intensity of the same area. e, 30 intensity traces of fusing particles were aligned to the increase in intensity at the onset of fusion, averaged (black squares show the mean, gray shaded area shows S.D.), and fit to a release model as shown in Fig. S1 (red line). f, fraction of stably bound particles that undergo fusion to SPPMs made with blebs from CD4- and CCR5-overexpressing HeLa cells or HeLa cells that do not express either. Each point represents a separately prepared bilayer. Error bars, S.E.
Figure 2.
Figure 2.
Observation of HIV membrane fusion intermediate structures by cryoET. a, membraned particle size and enumeration of fusion intermediates for each sample treatment. Spherical CD4- and CCR5-containing blebs were mixed with HIV pseudoviruses on ice and warmed to 37 °C for the indicated time before freezing on a grid for cryoET. The number of intermediate structures observed for each condition (left y axis) and the maximum diameter in the z-direction of membraned particles in a tomogram (red bars and right y axis) were plotted. Data are from one set of matched samples prepared and frozen at the same time and are taken from 109 similar tomograms. The number of tomograms for each treatment in this matched set is listed below the x axis. Error bars, S.E. Welch's t test is shown above data: **, p < 0.01; ns, not significant. Examples of each type of event are shown in b–f. b–f, z-slices through tomograms of HIV pseudovirus and blebs. Additional slices at higher zoom are shown on the right and labeled with their slice number in the z-direction. Tomograms are shown with cryoCARE denoising to enhance contrast for display. Scale bars, 100 nm unless otherwise indicated. Videos showing the complete tomograms and additional examples can be found in the supporting data. b, tomogram of V4 High Env HIV pseudovirus and bleb mixture treated with 135 ng/ml T20. To highlight densities suggested to represent Env (orange arrow) or densities that could potentially be CD4 (white arrow), higher-magnification views are shown below with a 50-nm scale bar. c, example tomogram showing characteristics used to classify receptor-mediated binding events. The mixture of HIV pseudovirus and blebs with 40 μm IP6 was warmed to 37 °C for 10 s before freezing. Defocus was −10 μm. d, example tomogram showing characteristics used to classify hemifusion events. The mixture of HIV pseudovirus and blebs with 40 μm IP6 was warmed to 37 °C for 10 s before freezing. Defocus was −10 μm. e, example tomogram showing characteristics used to classify early fusion product events. The mixture of HIV pseudovirus and bleb was warmed to 37 °C for 10 s before freezing. These types of events were relatively rare in the data set. Defocus was −6 μm. f, example tomogram of HIV pseudoviruses and blebs warmed to 37 °C for 30 s, which likely represents the product of multiple rounds of membrane fusion. Densities extend from the membrane that resemble HIV Env (orange arrows) and CD4 (white arrows). Defocus was −6 μm. Complete tomograms of bd are presented in Videos S1S3.
Figure 3.
Figure 3.
Serinc incorporation enhances the probability of observing hemifusion and abnormal early fusion products. a, number of HIV pseudovirus particles that bound to a CD4- and CCR5-containing SPPM. An equal amount of pseudovirus as measured by HIV p24 was introduced to bilayers and observed by TIRF microscopy for 13.3 min. HIV pseudovirus particles used in this experiment were labeled only with an mCherry content marker. Each point represents a separately prepared SPPM. Three separate preparations of each type of pseudovirus were examined. b, fraction of bound HIV pseudovirus particles that underwent fusion, as reported by loss of mCherry content marker. Each point represents a separately prepared SPPM. Data were collected from five experiments from three separate preparations of each type of pseudovirus. c, single-particle kinetics of pseudovirus fusion. The time between docking and the beginning of fusion, as reported by loss of mCherry signal, was measured for individual viral fusion events; each point represents an event. Events from five experiments and three separate HIV pseudovirus preparations are shown for each type. In total, 336 Serinc-lacking events, 187 Serinc2 events, 95 Serinc3 events, and 88 Serinc5 events are shown. d, infection of TZM-bl reporter cells by an equal amount of each type of HIV pseudovirus as measured by HIV p24. Data shown are from three separate preparations of pseudovirus and three infection experiments. For each experiment, the luciferase signal was normalized to the Serinc-lacking signal from a parallel preparation of virus examined in the same experiment. Error bars, S.E. e, maximum diameter in the z-direction of membraned particles in a tomogram after mixing with CD4- and CCR5-containing blebs and warming to 37 °C for 30 s before freezing for cryoET. Each point represents a tomogram. Error bars, S.E. f, enumeration of fusion intermediate structures observed in tomograms of Serinc-lacking or Serinc-containing HIV pseudoviruses. The number of tomograms for each treatment is listed below the x axis. gl, z-slices through tomograms of Serinc-containing HIV pseudovirus and blebs that were warmed to 37 °C for 30 s before freezing for cryoET. Tomograms are shown with cryoCARE denoising to enhance contrast for display except where noted. Scale bars, 100 nm. g, representative image of tomograms of Serinc2-containing HIV pseudoviruses; h, the only early fusion product event observed in all tomograms of Serinc2 pseudoviruses and blebs. Both tomograms were prepared with 40 μm IP6 and acquired at −10 μm defocus. i and j, representative images of early fusion products of Serinc3-containing pseudoviruses from different tomograms. i was acquired with −4 μm defocus, and j was prepared with 40 μm IP6, taken at −10 μm defocus, and is shown with nonanisotropic diffusion filtering. k, representative image of an early fusion product of Serinc5-containing pseudovirus and blebs. l, an enlargement of the image in k. The tomogram was taken at −5 μm defocus. Welch's two-tailed t test is shown above data: p < 0.05; **, p < 0.01; ****, p < 0.0001; ns, not significant. Complete tomograms of g, i, and k are presented in Videos S4S6.
Figure 4.
Figure 4.
Perturbation of the viral membrane rescues HIV fusion and infection from Serinc restriction. a, cartoon depicting SPPM fusion experiment with double-labeled HIV pseudovirus. Because the vast majority of the Atto488-DMPE fluorescent membrane dye is in the outer leaflet of the viral membrane (supporting data), both hemifusion and full fusion are reported as decay of the Atto488 fluorescence. Only full fusion is reported as decay of mCherry fluorescence. b, fraction of bound HIV pseudovirus particles that underwent fusion, as reported by loss of mCherry content marker (red) or lipid mixing, as reported by loss of Atto488 fluorescence from membrane dye (green). Data are from four separate experiments with two technical replicates for each. Error bars, S.E. Unpaired two-tailed t test is shown above data. All comparisons not shown are not significant. c, comparison of single-particle kinetics of Atto488-DMPE–labeled versus non-membrane-labeled pseudovirus fusion. The time between docking and the beginning of fusion was measured for individual viral fusion events. Each point represents an event, and events are from four experiments. In total, 462 mCherry content only (unlabeled) events, 536 membrane-reported fusion events from Atto488-DMPE–labeled pseudovirus, and 330 content-reported fusion events from Atto488-DMPE–labeled pseudovirus are shown. d, single-particle kinetics of Atto488-DMPE–reported pseudovirus fusion. The time between docking and the beginning of lipid mixing was measured for individual viral fusion events; each point represents an event, and events are from four experiments. In total, 536 Serinc-lacking events, 373 Serinc2 events, 459 Serinc3 events, and 485 Serinc5 events are shown. e, infection of amphotericin B–treated TZM-bl cells by Serinc-containing or -lacking HIV pseudoviruses. Cells were pretreated with 1 μm amphotericin B for 30 min before spinfection with HIV pseudoviruses, also in medium with 1 μm amphotericin B. Data shown represent three separate preparations of pseudovirus and three infection experiments. Untreated data are replotted from Fig. 3d for comparison. Error bars, S.E. Paired two-way t test is shown above data. f, fraction of bound HIV pseudovirus particles that underwent fusion, as reported by loss of mCherry content marker. Each point represents a separately prepared SPPM. Untreated data are replotted from Fig. 3b for comparison. Amphotericin B–treated data were collected from three experiments from three separate preparations of each type of pseudovirus. Unpaired two-tailed t test is shown above data: *, p < 0.05; **, p < 0.01; ****, p < 0.0001; ns, not significant.

Comment in

  • HIV fusion: Catch me if you can.
    Denolly S, Cosset FL. Denolly S, et al. J Biol Chem. 2020 Nov 6;295(45):15196-15197. doi: 10.1074/jbc.H120.016022. J Biol Chem. 2020. PMID: 33158917 Free PMC article.

References

    1. Melikyan G. B. (2011) Membrane fusion mediated by human immunodeficiency virus envelope glycoprotein. Curr. Top. Membr. 68, 81–106 10.1016/B978-0-12-385891-7.00004-0 - DOI - PubMed
    1. Blumenthal R., Durell S., and Viard M. (2012) HIV entry and envelope glycoprotein-mediated fusion. J. Biol. Chem. 287, 40841–40849 10.1074/jbc.R112.406272 - DOI - PMC - PubMed
    1. Chen B. (2019) Molecular mechanism of HIV-1 entry. Trends Microbiol. 27, 878–891 10.1016/j.tim.2019.06.002 - DOI - PMC - PubMed
    1. Sougrat R., Bartesaghi A., Lifson J. D., Bennett A. E., Bess J. W., Zabransky D. J., and Subramaniam S. (2007) Electron tomography of the contact between T cells and SIV/HIV-1: implications for viral entry. PLoS Pathog. 3, e63 10.1371/journal.ppat.0030063 - DOI - PMC - PubMed
    1. Gui L., Ebner J. L., Mileant A., Williams J. A., and Lee K. K. (2016) Visualization and sequencing of membrane remodeling leading to influenza virus fusion. J. Virol. 90, 6948–6962 10.1128/JVI.00240-16 - DOI - PMC - PubMed

Publication types

Substances

LinkOut - more resources