. 2020 Sep 4;133(17):jcs248880.
doi: 10.1242/jcs.248880.

Mitofusin 2 regulates neutrophil adhesive migration and the actin cytoskeleton

Affiliations

Mitofusin 2 regulates neutrophil adhesive migration and the actin cytoskeleton

Wenqing Zhou et al. J Cell Sci. .

Abstract

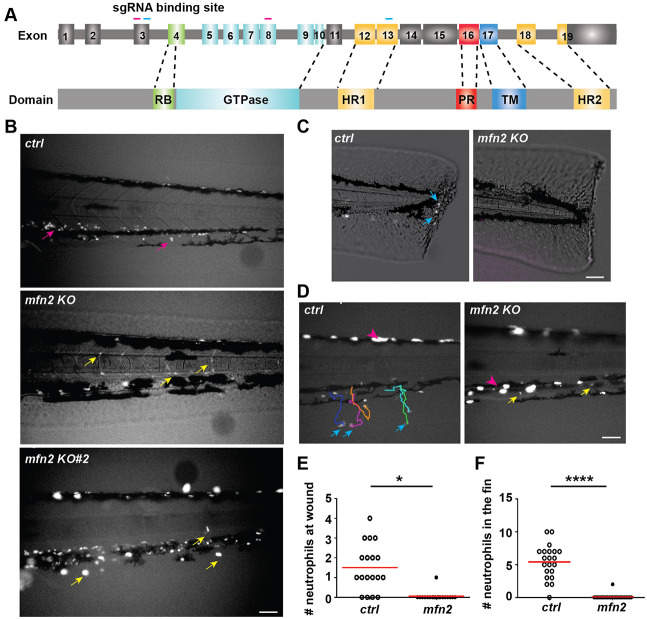
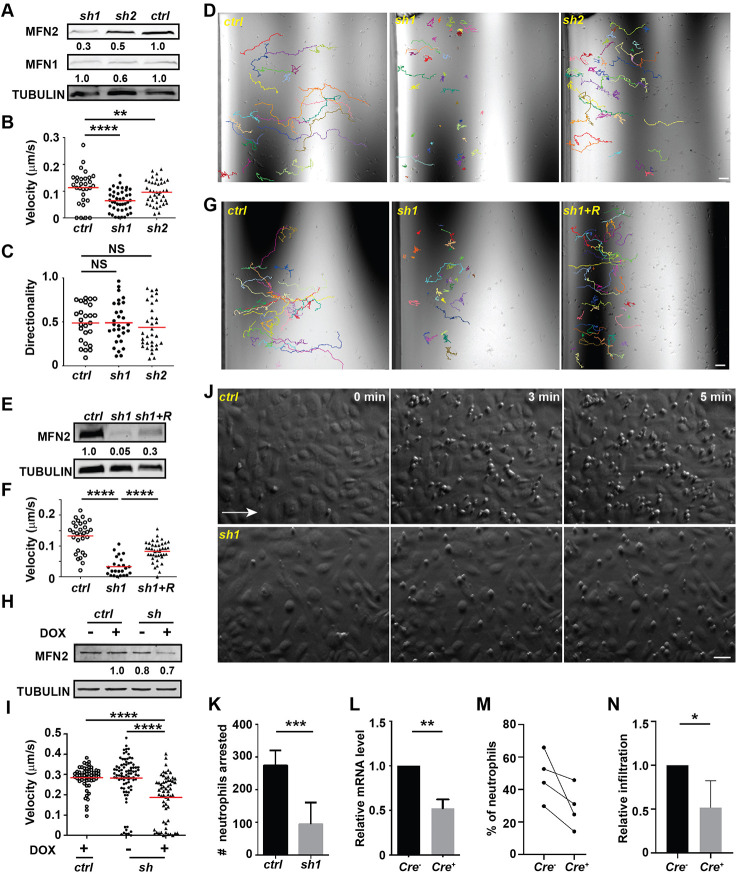
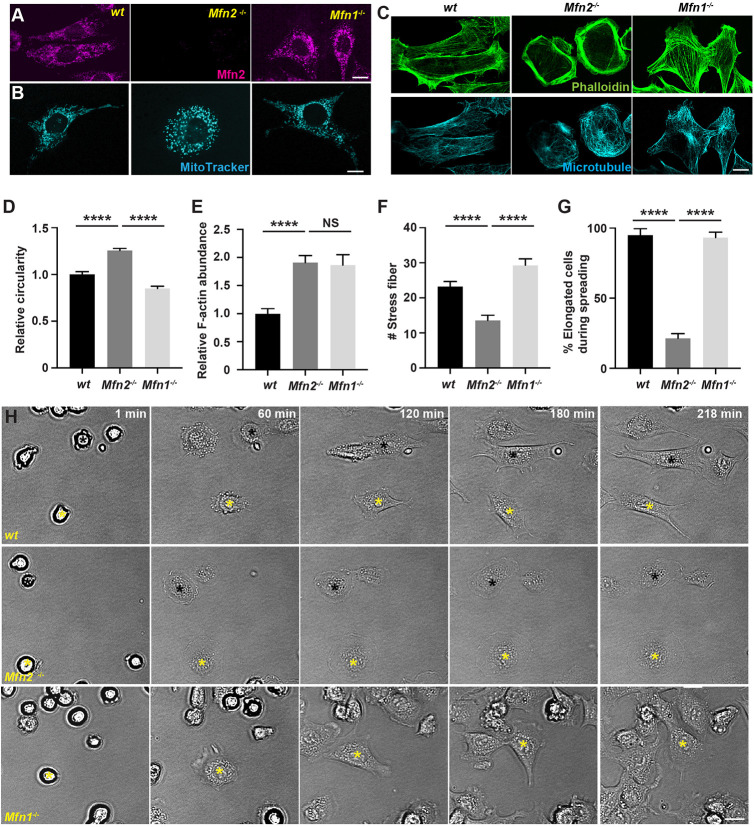
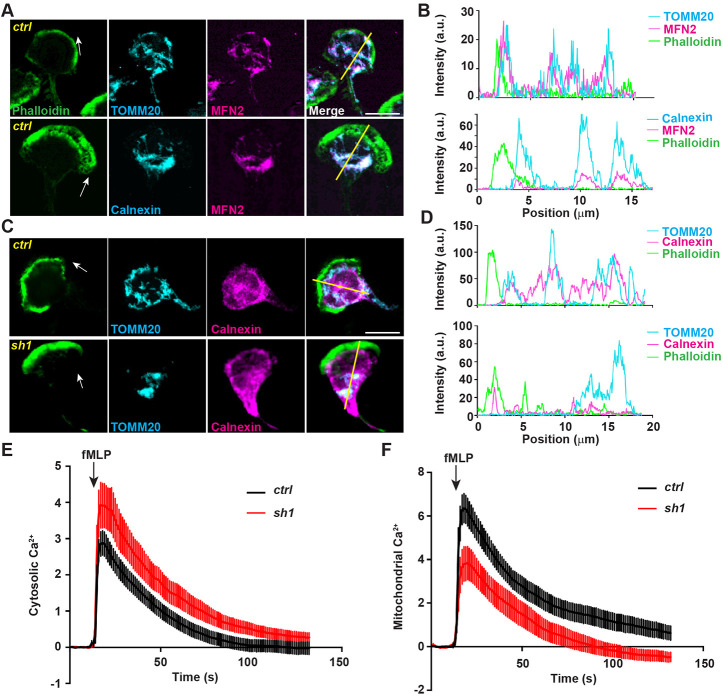
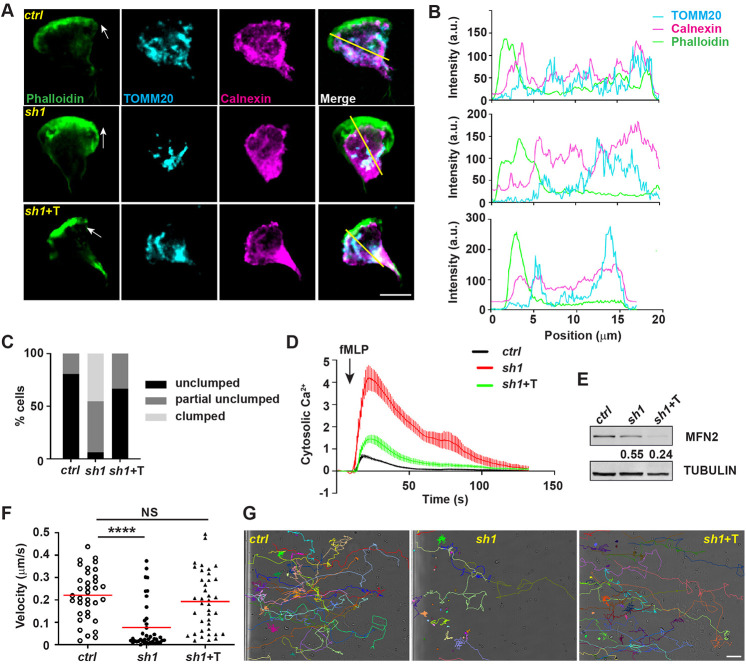
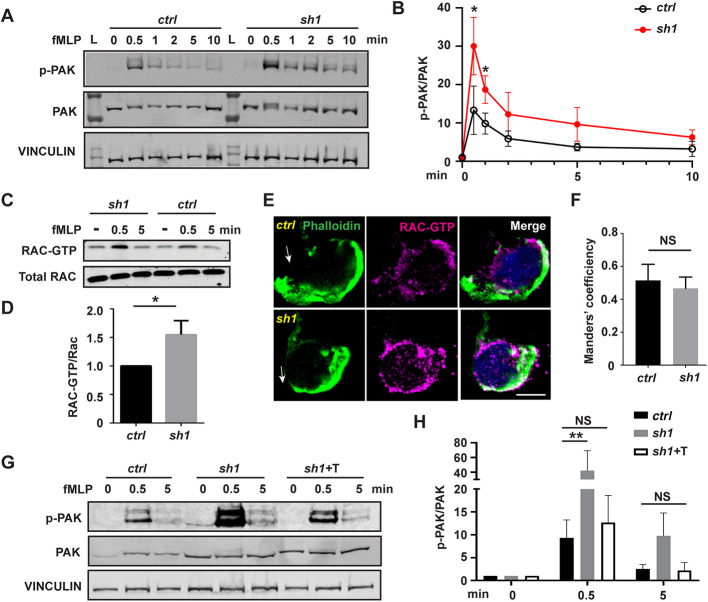
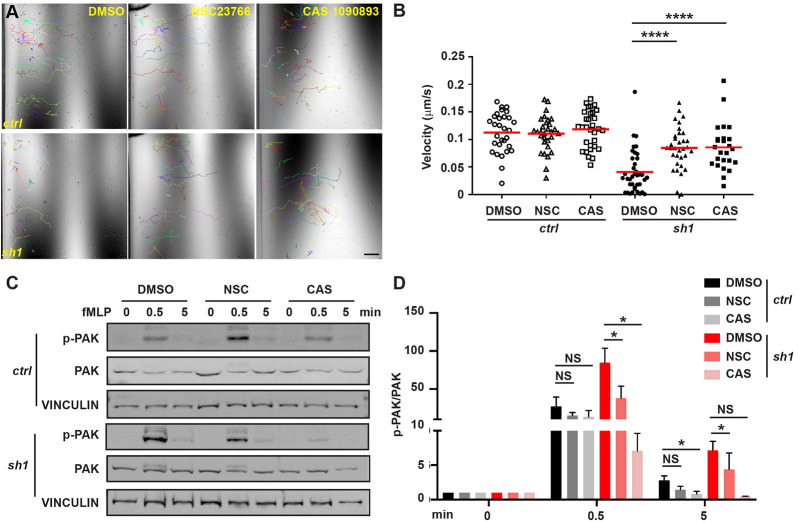
Neutrophils rely on glycolysis for energy production. How mitochondria regulate neutrophil function is not fully understood. Here, we report that mitochondrial outer membrane protein Mitofusin 2 (MFN2) regulates neutrophil homeostasis and chemotaxis in vivoMfn2-deficient neutrophils are released from the hematopoietic tissue, trapped in the vasculature in zebrafish embryos, and not capable of chemotaxis. Consistent with this, human neutrophil-like cells that are deficient for MFN2 fail to arrest on activated endothelium under sheer stress or perform chemotaxis on 2D surfaces. Deletion of MFN2 results in a significant reduction of neutrophil infiltration to the inflamed peritoneal cavity in mice. Mechanistically, MFN2-deficient neutrophil-like cells display disrupted mitochondria-ER interaction, heightened intracellular Ca2+ levels and elevated Rac activation after chemokine stimulation. Restoring a mitochondria-ER tether rescues the abnormal Ca2+ levels, Rac hyperactivation and chemotaxis defect resulting from MFN2 depletion. Finally, inhibition of Rac activation restores chemotaxis in MFN2-deficient neutrophils. Taken together, we have identified that MFN2 regulates neutrophil migration via maintaining the mitochondria-ER interaction to suppress Rac activation, and uncovered a previously unrecognized role of MFN2 in regulating cell migration and the actin cytoskeleton.This article has an associated First Person interview with the first authors of the paper.

Keywords: Actin; Chemotaxis; Leukocyte; Mitochondria; Rac; Zebrafish.


Conflict of interest statement

Competing interestsThe authors declare no competing or financial interests.

Figures

Fig. 1.
Fig. 1.
Mfn2 regulates neutrophil tissue retention and extravasation in zebrafish. (A) Schematics of the gene structure and protein domains of the zebrafish mfn2 gene. The first set of sgRNAs (magenta) targets exon 3 and exon 8 in the forward strand, and the second set (blue) targets exon 3 and exon 13 in the forward strand. (B) Representative images of neutrophils in the zebrafish trunk of the indicated transgenic lines at 3 dpf. Magenta arrows, neutrophils in the caudal hematopoietic tissue; yellow arrows, neutrophils in the vasculature. Images are representative of n>20 in ctrl and n>20 in the mfn2-knockout lines. (C,E) Representative images (C) and quantification (E) of neutrophil recruitment to the wound edge at 1 h post wound. Blue arrows, neutrophils migrated to the wound. (D,F) Representative tracks (D) and quantification (F) of neutrophil recruitment to the fin at 30 min post LTB4 treatment. Blue arrows, neutrophils in the fin; magenta arrowhead, pigments; yellow arrows, neutrophils in the vasculature. One representative result of three biological repeats is shown in E and F; n>20 fish embryos in each group were quantified. *P<0.05, ****P<0.0001 (unpaired t-test). Scale bars: 50 µm.
Fig. 2.
Fig. 2.
MFN2 regulates neutrophil migration in vitro and in vivo. (A) Western blot determining the expression level of MFN2 and MFN1 in indicated cell lines. Ctrl, standard control; sh1, shRNA targeting MFN2; sh2, a second shRNA targeting MFN2. (B) Quantification of velocity, (C) quantification of directionality and (D) representative images with individual tracks of neutrophil chemotaxis to fMLP. (E) Western blot showing the expression level of MFN2 in indicated cell lines. (F,G) Quantification (F) and representative images (G) with individual tracks of neutrophils migrating toward fMLP. (H) Western blot of MFN2 in indicated cell lines with or without doxycycline induction. (I) Quantification of velocity of neutrophil chemotaxis towards fMLP. (J,K) Adhesion of neutrophils under sheer stress. A HUVEC monolayer was activated with TNFα and neutrophils were flowed on top of the monolayer for 5 min. (J) Representative images showing neutrophils arrested by HUVECs at indicated time points. White arrow, flow direction. (K) Quantification of numbers of neutrophils arrested at 5 min. (L) The relative mRNA level of Mfn2 in mice neutrophils isolated from Mfn2flox/flox; S100A8:Cre+ or the control Mfn2flox/flox; S100A8:Cre littermates. (M) Percentage of neutrophils in the peritoneal cavity in the indicated mice. (N) Relative neutrophil infiltration to peritoneal cavity. Percentage of neutrophils in the lavage was normalized to that in sex-matched littermates in each experiment. One representative result of three (A–I) or two (J–K) biological repeats is shown. Numbers below each immunoblot indicates the normalized intensity of the bands with the respective loading control and is representative of more than three biological repeats. Data are pooled from two (K), three (L) or four (M and N) independent experiments; n>20 cells are tracked and counted in B–D,F,G,I. *P<0.05; **P<0.01; ***P<0.001; ****P<0.0001 [one-way ANOVA (B,C,F,I); unpaired t-test (K and L); paired t-test (N)]. Scale bars: 50 µm.
Fig. 3.
Fig. 3.
Mfn2 regulates cytoskeleton organization and cell migration in MEFs. (A) Immunofluorescence of MFN2 in wt, Mfn2-null and Mfn1-null MEFs. (B) MitoTracker staining in indicated MEFs. (C) Immunofluorescence of microtubule and F-actin (phalloidin) in indicated MEFs. Note, cells in B are different from those in A and C. Quantification of circularity (D), F-actin abundance (E) and number of stress fibers (F) in indicated cells. (G,H) Quantification (G) and representative images (H) of indicated MEFs during cell spreading at indicated time points. Asterisks of yellow and black label the same cells during spreading. Results are mean±s.e.m.; >100 cells quantified in D–G. NS, not significant; ****P<0.0001 (one-way ANOVA). Scale bars: 10 µm (A–C), 200 µm (H).
Fig. 4.
Fig. 4.
MFN2 regulates mitochondria-ER interaction. (A) Immunofluorescence of mitochondria (TOMM20) or ER membrane (calnexin) and MFN2 in indicated cells 3 min post fMLP stimulation. Cells were stained also with phalloidin to reveal F-actin. Arrows, direction of cell polarization. (B) Plot profiles of the fluorescence intensity (MFI) along the corresponding yellow lines in A. a.u., arbitrary units. (C) Immunofluorescence of mitochondria and ER membrane in indicated cells 3 min post fMLP stimulation. Arrows, direction of cell polarization. (D) Plot profiles of the fluorescence intensity (MFI) along the corresponding yellow lines in C. One representative result of three biological repeats was shown in A–D. Scale bars: 10 µm. (E) Cytosolic Ca2+ in the control or MFN2-knockdown cell lines after fMLP stimulation. (F) Mitochondrial Ca2+ in the control or MFN2-knockdown cell lines after fMLP stimulation. Data are presented as mean±s.d. (n>30). One representative result of three biological repeats is shown.
Fig. 5.
Fig. 5.
The mitochondria–ER tether restores neutrophil chemotaxis in MFN2-deficient dHL-60 cells. (A) Immunofluorescence of mitochondria (TOMM20), and ER membrane (calnexin) in indicated cells 3 min post fMLP stimulation. Arrows, direction of cell polarization. (B) Plot profiles of the fluorescence intensity (MFI) along the corresponding yellow lines in A. a.u., arbitrary units. (C) Quantification of clumped mitochondria in indicated cell lines. n=26 (ctrl), n=31 (sh1), n=42 (sh1+T). (D) Cytosolic Ca2+ in the indicated cell lines after fMLP stimulation. Data are presented as mean±s.d. (n>30). (E) Western blot of MFN2 in indicated cell lines. sh1+T, HL-60 cells with MFN2-sh1 and synthetic tether construct. Numbers below each immunoblot indicates the normalized intensity of the bands with the respective loading control and is representative of more than three biological repeats. (F,G) Quantification of neutrophil velocity (F) and representative images (G) of individual tracks of neutrophils migrating to fMLP. One representative result of three biological repeats is shown in A,B,D–G. Data are pooled from three independent experiments in C; n>20 cells are tracked in F and G. NS, not significant; ****P<0.0001 (one-way ANOVA). Scale bars: 10 µm (A), 100 µm (G).
Fig. 6.
Fig. 6.
Heightened Rac activation in MFN2-deficient dHL-60 cells is corrected by inducing a mitochondria–ER tether. (A) Western blot and (B) quantification determining the amount of phospho-PAK (pPAK) in dHL-60 cells treated with fMLP at indicated time points. L, protein ladder. (C) Western blot determining the amount of Rac-GTP and total Rac protein in dHL-60 cells treated with fMLP at indicated time points. (D) Quantification of Rac activation 5 min after stimulation with fMLP. (E) Immunofluorescence of F-actin and Rac-GTP in indicated cell lines 3 min after stimulation with fMLP. Arrows, direction of cell polarization. (F) Colocalization of Rac-GTP and F-actin. n>20. (G,H) Western blot (G) and quantification (H) determining the amount of pPAK in dHL-60 cells treated with fMLP at indicated time points. One representative result of three biological repeats is shown in A,C, and G. Data are pooled from three independent experiments in B, D and H. Error bars represent s.d. NS, non-significant; *P<0.05; **P<0.01 [unpaired t-test (B,D), and two-way ANOVA (H)]. Scale bar: 10 µm.
Fig. 7.
Fig. 7.
Heightened Rac activation underlies the chemotaxis defect in MFN2-deficient dHL-60 cells. (A) Representative images with individual tracks and (B) quantification of velocity of neutrophil chemotaxis towards fMLP in the presence of vehicle or the Rac inhibitor NSC23766 or CAS1090893. (C,D) Western blot (C) and quantification (D) determining the amount of phospho-PAK (pPAK) in dHL-60 cells treated with fMLP and the Rac inhibitors at indicated time points. One representative result of three biological repeats is shown in A–C. Data are pooled from three independent experiments in D. n>20 cells are tracked in B. NS, non-significant; *P<0.05; ****P<0.0001 (two-way ANOVA). Scale bar: 100 µm.

References

    1. Abram C. L., Roberge G. L., Pao L. I., Neel B. G. and Lowell C. A. (2013). Distinct roles for neutrophils and dendritic cells in inflammation and autoimmunity in motheaten mice. Immunity 38, 489-501. 10.1016/j.immuni.2013.02.018 - DOI - PMC - PubMed
    1. Amini P., Stojkov D., Felser A., Jackson C. B., Courage C., Schaller A., Gelman L., Soriano M. E., Nuoffer J.-M., Scorrano L. et al. (2018). Neutrophil extracellular trap formation requires OPA1-dependent glycolytic ATP production. Nat. Commun. 9, 2958 10.1038/s41467-018-05387-y - DOI - PMC - PubMed
    1. Bao Y., Ledderose C., Seier T., Graf A. F., Brix B., Chong E. and Junger W. G. (2014). Mitochondria regulate neutrophil activation by generating ATP for autocrine purinergic signaling. J. Biol. Chem. 289, 26794-26803. 10.1074/jbc.M114.572495 - DOI - PMC - PubMed
    1. Bao Y., Ledderose C., Graf A. F., Brix B., Birsak T., Lee A., Zhang J. and Junger W. G. (2015). mTOR and differential activation of mitochondria orchestrate neutrophil chemotaxis. J. Cell Biol. 210, 1153-1164. 10.1083/jcb.201503066 - DOI - PMC - PubMed
    1. Bi D., Lopez J. H., Schwarz J. M. and Manning M. L. (2014). Energy barriers and cell migration in densely packed tissues. Soft Mat. 10, 1885-1890. 10.1039/c3sm52893f - DOI - PubMed

Publication types