. 2020 Aug;8(2):e000949.
doi: 10.1136/jitc-2020-000949.

IL-6 regulates CCR5 expression and immunosuppressive capacity of MDSC in murine melanoma

Affiliations

IL-6 regulates CCR5 expression and immunosuppressive capacity of MDSC in murine melanoma

Rebekka Weber et al. J Immunother Cancer. 2020 Aug.

Abstract

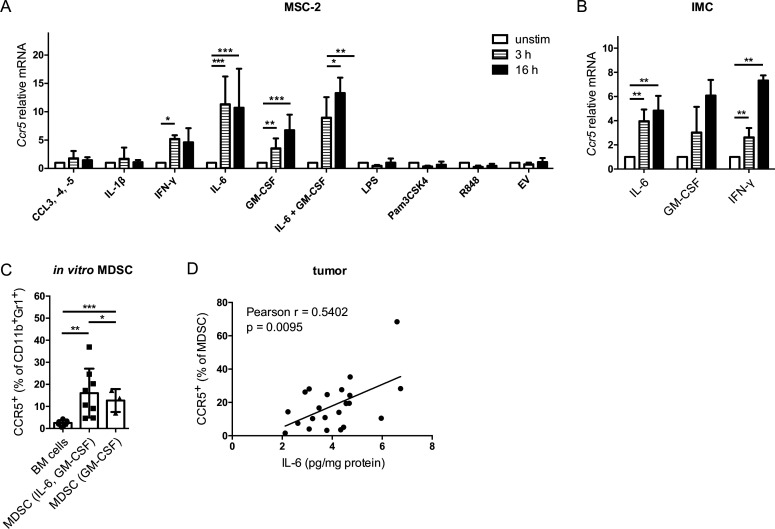
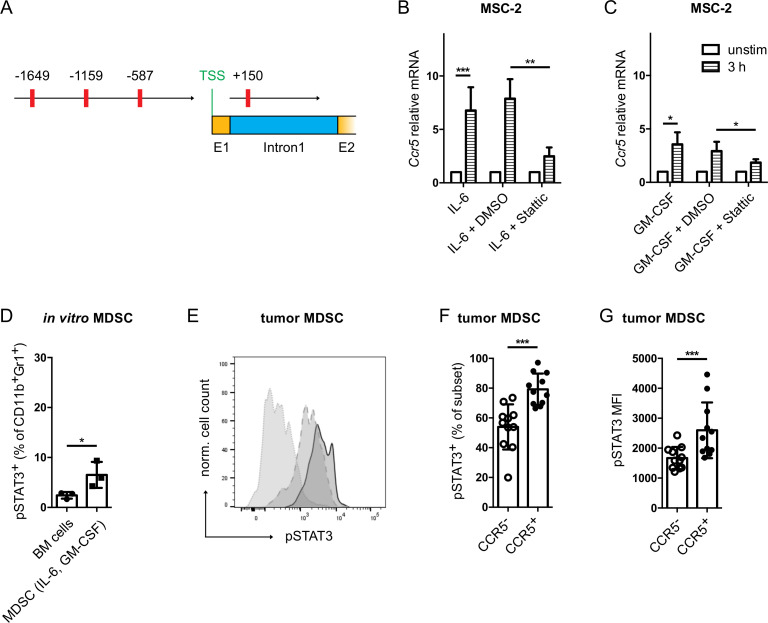
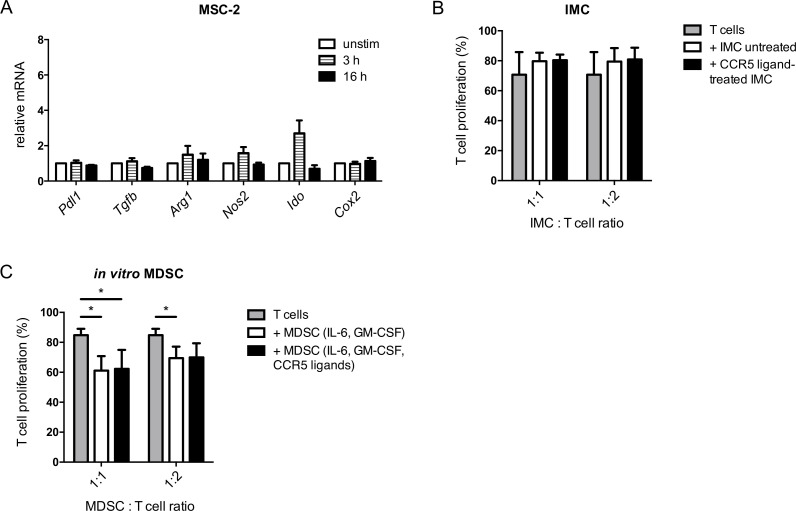
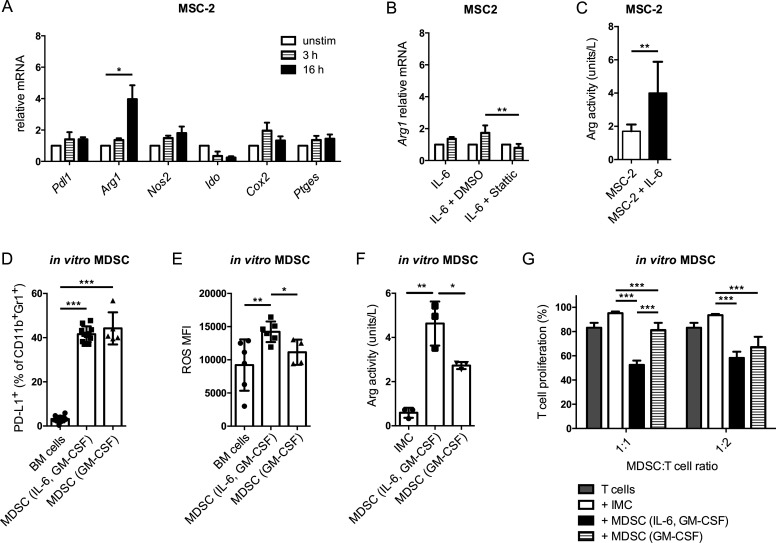
Background: Myeloid-derived suppressor cells (MDSC) play a major role in the immunosuppressive melanoma microenvironment. They are generated under chronic inflammatory conditions characterized by the constant production of inflammatory cytokines, chemokines and growth factors, including IL-6. Recruitment of MDSC to the tumor is mediated by the interaction between chemokines and chemokine receptors, in particular C-C chemokine receptor (CCR)5. Here, we studied the mechanisms of CCR5 upregulation and increased immunosuppressive function of CCR5+ MDSC.

Methods: The immortalized myeloid suppressor cell line MSC-2, primary immature myeloid cells and in vitro differentiated MDSC were used to determine factors and molecular mechanisms regulating CCR5 expression and immunosuppressive markers at the mRNA and protein levels. The relevance of the identified pathways was validated on the RET transgenic mouse melanoma model, which was also used to target the identified pathways in vivo.

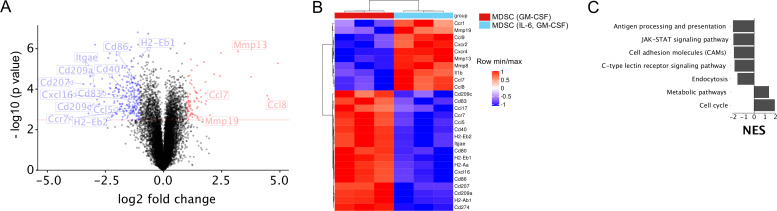
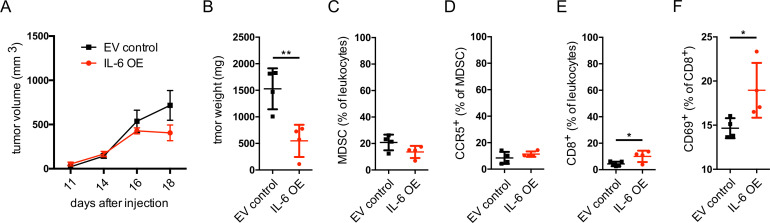
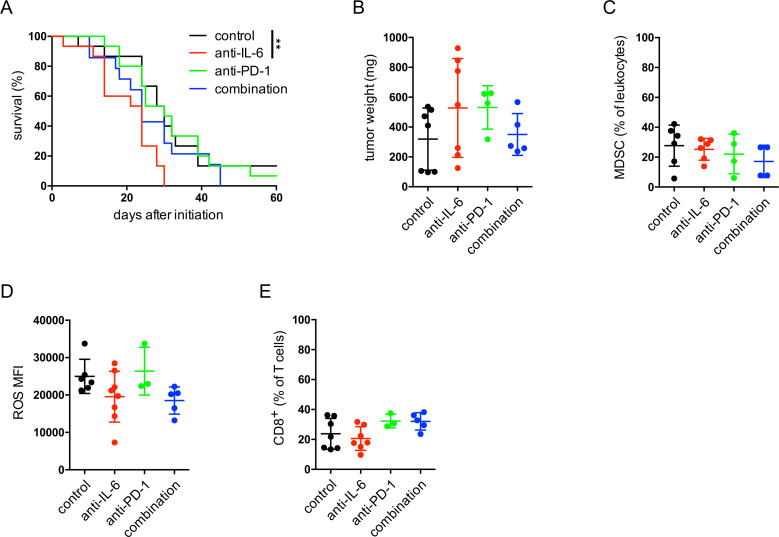
Results: IL-6 upregulated the expression of CCR5 and arginase 1 in MDSC by a STAT3-dependent mechanism. MDSC differentiated in the presence of IL-6 strongly inhibited CD8+ T cell functions compared with MDSC differentiated without IL-6. A correlation between IL-6 levels, phosphorylated STAT3 and CCR5 expression in tumor-infiltrating MDSC was demonstrated in the RET transgenic melanoma mouse model. Surprisingly, IL-6 overexpressing tumors grew significantly slower in mice accompanied by CD8+ T cell activation. Moreover, transgenic melanoma-bearing mice treated with IL-6 blocking antibodies showed significantly accelerated tumor development.

Conclusion: Our in vitro and ex vivo findings demonstrated that IL-6 induced CCR5 expression and a strong immunosuppressive activity of MDSC, highlighting this cytokine as a promising target for melanoma immunotherapy. However, IL-6 blocking therapy did not prove to be effective in RET transgenic melanoma-bearing mice but rather aggravated tumor progression. Further studies are needed to identify particular combination therapies, cancer entities or patient subsets to benefit from the anti-IL-6 treatment.

Keywords: cytokines; immune evasion; melanoma; myeloid-derived suppressor cells.


Conflict of interest statement

Competing interests: None declared.

Figures

Figure 1
Figure 1
CCR5 upregulation mediated by IL-6 and GM-CSF in vitro. MSC-2 cells (A) and IMC (B) were stimulated with indicated agents for 3 and 16 hours. Ccr5 mRNA expression was measured by qRT-PCR. Values were normalized for the housekeeping gene Rn18s expression and the unstimulated control according to the 2-ΔΔCT method (mean±SEM; n=3–5). Statistics were performed on ΔCT values. (C) Bone marrow cells were differentiated into MDSC with IL-6 and GM-CSF or with GM-CSF alone for 4 days. CCR5 expression was measured by flow cytometry. Results are presented as the percentage of CCR5+ cells among total CD11b+Gr1+ cells (mean±SD; n=8). (D) The IL-6 concentrations in tumors from RET transgenic mice measured by ELISA were plotted against the percentage of tumor-infiltrating CCR5+ MDSC detected within total MDSC by flow cytometry (n=22). The line was calculated by linear regression analysis, and Pearson correlation with two-tailed p value was used for correlation testing. *p<0.05, **p<0.01, ***p<0.001. BM, bone marrow; CCR5, C–C chemokine receptor 5; EV, extracellular vesicles; GM-CSF, granulocyte macrophage colony-stimulating factor; IFN, interferon; IL, interleukin; IMC, immature myeloid cells; LPS, lipopolysaccharide; MDSC, myeloid-derived suppressor cells; MSC, myeloid suppressor cell line.
Figure 2
Figure 2
IL-6 and GM-CSF induced CCR5 upregulation is STAT3 dependent. (A) The murine Ccr5 gene sequence was extracted from the NCBI database (Gene-ID: 12774). The TFbind online tool was used to search for STAT3 binding sites in the two Ccr5 promoters. The predicted STAT3 binding sites are shown in red with their respective distance to the transcription start site. MSC-2 cells were stimulated with IL-6 (B) or GM-CSF (C) together with the STAT3 inhibitor Stattic (10 µM) for 3 hours. Ccr5 mRNA expression was measured by qRT-PCR (mean±SEM; n=3). (D) Bone marrow cells were differentiated into MDSC with IL-6 and GM-CSF. pSTAT3 expression was measured by flow cytometry. Data are shown as the percentage of pSTAT3+ cells within total MDSC (mean±SD; n=3). (E) Evaluation of pSTAT3 expression in tumor infiltrating MDSC. A representative histogram for pSTAT3 staining is shown (dotted line: isotype control, dashed line: CCR5 MDSC, solid line: CCR5+ MDSC). (F) The frequency of tumor-infiltrating pSTAT3+ MDSC is expressed as the percentage within CCR5+ or CCR5 MDSC (mean±SD; n=10). (G) The level of pSTAT3 expression in CCR5+ or CCR5 MDSC is presented as median fluorescence intensity (mean±SD; n=10). *p<0.05, **p<0.01, ***p<0.001. BM, bone marrow; CCR5, C–C chemokine receptor; GM-CSF, granulocyte macrophage colony-stimulating factor; IL, interleukin; MDSC, myeloid-derived suppressor cells.
Figure 3
Figure 3
Impact of CCR5 ligands on immunosuppressive capacity of MDSC. (A) MSC-2 cells were incubated with CCL3, CCL4 and CCL5 (20 ng/mL each) for 3 and 16 hours. The mRNA expression of the indicated genes was measured by qRT-PCR (mean±SEM; n=3). (B) IMC were treated with CCL3, CCL4 and CCL5 (20 ng/mL each) for 24 hours followed by the coculture with CD8+ T cells labeled with CFSE and stimulated with anti-CD3 and anti-CD28 antibodies for 72 hours. Cumulative data for the inhibition of T cell proliferation by IMC are presented as the percentage of divided T cells (mean±SD; n=3). (C) MDSC were generated by the incubation with IL-6 and GM-CSF with or without adding CCL3, CCL4 and CCL5 for 4 days followed by the coculture with activated CD8+ T cells for 72 hours. Cumulative data for the inhibition of T cell proliferation by MDSC are presented as the percentage of divided T cells (mean±SD; n=5). MDSC:T cell ratios were as indicated. *p<0.05. CCR5, C–C chemokine receptor; CFSE, carboxyfluorescein succinimidyl ester; GM-CSF, granulocyte macrophage colony-stimulating factor; IMC, immature myeloid cells; MDSC, myeloid-derived suppressor cells; MSC, myeloid suppressor cell line.
Figure 4
Figure 4
IL-6 increased MDSC-mediated immunosuppression via the stimulation of Arg1. (A) MSC-2 cells were incubated with 40 ng/mL IL-6 for 3 and 16 hours. The mRNA expression of indicated genes was measured by qRT-PCR (mean±SEM; n=3). (B) MSC-2 cells were cocultured with 40 ng/mL IL-6 together with the STAT3 inhibitor Stattic (10 µM) for 3 hour. Arg1 mRNA expression was measured by qRT-PCR (mean±SEM; n=3). (C) MSC-2 cells were incubated with IL-6 for 24 hours. Arg activity was measured using the Arginase Activity Assay Kit and expressed as units/L (mean±SD; n=9). (D–F) MDSC were generated by IL-6 and GM-CSF or GM-CSF only. PD-L1 expression and ROS production were measured by flow cytometry. Arg activity was detected by the Arginase Activity Assay Kit. The data are presented as the percentage of PD-L1+ MDSC among total MDSC (D), as the MFI of ROS producing cells (E) and as units/L of Arg activity (mean±SD; n=3–10). (G) Suppressive capacity of MDSC differentiated with IL-6 and GM-CSF or GM-CSF only was determined in the suppression of T cell proliferation assay with activated CD8+ T cells. Cumulative data for the inhibition of CD8+ T cell proliferation by generated MDSC are presented as the percentage of divided T cells (mean±SD; n=6). MDSC:T cell ratios were as indicated. *p<0.05, **p<0.01, ***p<0.001. BM, bone marrow; CCR5, C–C chemokine receptor; CFSE, carboxyfluorescein succinimidyl ester; GM-CSF, granulocyte macrophage colony-stimulating factor; IL, interleukin; IMC, immature myeloid cells; MDSC, myeloid-derived suppressor cells; MFI, median fluorescence intensity; MSC, myeloid suppressor cell line; ROS, reactive oxygen species.
Figure 5
Figure 5
Microarray analysis of in vitro generated MDSC. Whole transcriptome of MDSC differentiated in vitro with IL-6 and GM-CSF versus GM-CSF only was analyzed by microarray. (A) Volcano plot shows differentially expressed genes. Red line indicates significance threshold. (B) Heatmap showing differential expression of selected genes important for MDSC functions. (C) Normalized enrichment score (NES) of important significantly regulated pathways found by GSEA pathway analysis using KEGG pathways. GM-CSF, granulocyte macrophage colony-stimulating factor; GSEA, gene set enrichment analysis; IL, interleukin; MDSC, myeloid-derived suppressor cells.
Figure 6
Figure 6
Growth of IL-6 overexpressing Ret melanoma cells in vivo. Ret melanoma cells were transduced to overexpress IL-6 and were injected subcutaneously into C57BL/6 mice. (A) Tumor growth is presented as tumor volume in mm3 (mean±SEM; n=4). (B–F) At day 21, tumor weight was measured, and tumor cell suspension was analyzed by flow cytometry (mean±SD; n=4). (B) Tumor weight expressed in mg. (C) CD11b+Gr1+ MDSC are shown as the percentage within leukocytes. (D) CCR5+ MDSC are shown as the percentage among total MDSC. (E) CD8+ T cells are presented as the percentage within leukocytes. (F) CD69+ cells are shown as the percentage within total CD8+ T cells. *p<0.05, **p<0.01. CCR5, C–C chemokine receptor; EV, extracellular vesicle; IL, interleukin; MDSC, myeloid-derived suppressor cells; OE, overexpressing.
Figure 7
Figure 7
Effect of IL-6 blockade combined with anti-PD-1 therapy in melanoma-bearing mice. RET transgenic mice with established tumors were injected intraperitoneally with anti-IL-6 blocking antibodies or with anti-PD-1 therapeutic antibodies for 4 weeks, twice per week. Some mice received both anti-IL-6 and anti-PD-1 antibodies. Control group of mice was treated with isotype control antibodies. (A) Survival of mice is shown as a Kaplan-Meier curve (n=15/group). **p<0.01. In another set of experiments, tumor weight was measured, and immune cells were analyzed by flow cytometry after 4 weeks of therapy. Results are presented as the weight of tumors in mg (mean±SD; n=4–7) (B), as the percentage of CD11b+Gr1+ MDSC within leukocytes (C), the MFI of ROS producing MDSC (D) and the percentage of CD8+ T cells within leukocytes (E) (mean±SD, n=3–8). MDSC, myeloid-derived suppressor cells; MFI, median fluorescence intensity; ROS, reactive oxygen species.

References

    1. Domingues B, Lopes J, Soares P, et al. . Melanoma treatment in review. ImmunoTargets Ther 2018;7:35–49. 10.2147/ITT.S134842 - DOI - PMC - PubMed
    1. Fleming V, Hu X, Weber R, et al. . Targeting myeloid-derived suppressor cells to bypass tumor-induced immunosuppression. Front Immunol 2018;9:398 10.3389/fimmu.2018.00398 - DOI - PMC - PubMed
    1. Meyer C, Cagnon L, Costa-Nunes CM, et al. . Frequencies of circulating MDSC correlate with clinical outcome of melanoma patients treated with ipilimumab. Cancer Immunol Immunother 2014;63:247–57. 10.1007/s00262-013-1508-5 - DOI - PMC - PubMed
    1. Groth C, Hu X, Weber R, et al. . Immunosuppression mediated by myeloid-derived suppressor cells (MDSCs) during tumour progression. Br J Cancer 2019;120:16–25. 10.1038/s41416-018-0333-1 - DOI - PMC - PubMed
    1. Bronte V, Brandau S, Chen S-H, et al. . Recommendations for myeloid-derived suppressor cell Nomenclature and characterization standards. Nat Commun 2016;7:12150 10.1038/ncomms12150 - DOI - PMC - PubMed

Publication types