Comparative Study
. 2020 Sep 4;369(6508):1210-1220.
doi: 10.1126/science.abc6261. Epub 2020 Aug 11.

Systems biological assessment of immunity to mild versus severe COVID-19 infection in humans

Affiliations
Comparative Study

Systems biological assessment of immunity to mild versus severe COVID-19 infection in humans

Prabhu S Arunachalam et al. Science. .

Abstract

Coronavirus disease 2019 (COVID-19) represents a global crisis, yet major knowledge gaps remain about human immunity to severe acute respiratory syndrome coronavirus 2 (SARS-CoV-2). We analyzed immune responses in 76 COVID-19 patients and 69 healthy individuals from Hong Kong and Atlanta, Georgia, United States. In the peripheral blood mononuclear cells (PBMCs) of COVID-19 patients, we observed reduced expression of human leukocyte antigen class DR (HLA-DR) and proinflammatory cytokines by myeloid cells as well as impaired mammalian target of rapamycin (mTOR) signaling and interferon-α (IFN-α) production by plasmacytoid dendritic cells. By contrast, we detected enhanced plasma levels of inflammatory mediators-including EN-RAGE, TNFSF14, and oncostatin M-which correlated with disease severity and increased bacterial products in plasma. Single-cell transcriptomics revealed a lack of type I IFNs, reduced HLA-DR in the myeloid cells of patients with severe COVID-19, and transient expression of IFN-stimulated genes. This was consistent with bulk PBMC transcriptomics and transient, low IFN-α levels in plasma during infection. These results reveal mechanisms and potential therapeutic targets for COVID-19.


Figures

Fig. 1
Fig. 1. Mass cytometry analysis of human peripheral blood leukocytes from COVID-19 patients.
(A) A schematic representation of the experimental strategy. PFA, paraformaldehyde. (B) Representation of mass cytometry–identified cell clusters visualized by t-SNE in two-dimensional space. The box plots on the bottom show frequency of plasmablasts (CD3, CD20, CD56, HLA-DR+, CD14, CD16, CD11c, CD123, CD19lo, CD27hi, and CD38hi) and effector CD8 T cells (CD3+, CD8+, CD38hi, and HLA-DRhi) in both cohorts. (C) Frequencies of pDCs (CD3, CD20, CD56, HLA-DR+, CD14, CD16, CD11c, and CD123+) in healthy and COVID-19–infected individuals in both cohorts. (D and E) Box plots showing fold change (FC) of pS6 staining in pDCs (D) and IκBα staining in mDCs (E) relative to the medians of healthy controls. The histograms on the right depict representative staining of the same. (F) Distinguishing features [false discovery rate (FDR) < 0.01] through linear modeling analysis of the mass cytometry data between healthy and infected subjects. In all box plots, the boxes show median, upper, and lower quartiles. The whiskers show 5th to 95th percentiles. Each dot represents an individual sample (healthy: n = 17 and 45; infected: n = 19 and 54, for Atlanta and Hong Kong cohorts, respectively). For the t-SNE analysis, n = 34 and 60 for Atlanta and Hong Kong cohorts, respectively. The colors of the dots indicate the severity of clinical disease, as shown in the legends. The differences between the groups were measured by Mann-Whitney rank sum test (Wilcoxon, paired = FALSE). The P values depicting significance are shown within the box plots.
Fig. 2
Fig. 2. Flow cytometry analysis of ex vivo stimulated human peripheral blood leukocytes from COVID-19 patients.
(A) Box plots showing the fraction of pDCs in PBMCs of healthy or infected donors (CD3, CD20, CD56, HLA-DR+, CD14, CD16, CD11c, and CD123+) producing IFN-α, TNF-α, or IFN-α + TNF-α in response to stimulation with the viral cocktail (polyIC + R848). The contour plots on the right show IFN-α, TNF-α, or IFN-α + TNF-α staining in pDCs. (B) Box plots showing the fraction of mDCs in PBMCs of healthy or infected donors (CD3, CD20, CD56, HLA-DR+, CD14, CD16, CD123+, and CD11c) producing IL-6, TNF-α, or IL-6 + TNF-α in response to no stimulation (top), the bacterial cocktail (middle; Pam3CSK4, LPS, and Flagellin), or the viral cocktail (bottom; polyIC + R848). The flow cytometry plots on the right are representative plots gated on mDCs showing IL-6, TNF-α, or IL-6 + TNF-α response. (C) Fold change of NF-κβ p65 (Ser529) staining in PBMCs stimulated with bacterial cocktail relative to no stimulation in healthy and infected donors to show the reduced induction of p65 phosphorylation in infected individuals. The histograms show representative flow cytometry plots of p65 staining in mDCs. GeoMFI, geometric mean fluorescence intensity. In all box plots, the boxes show median, upper, and lower quartiles. The whiskers show 5th to 95th percentiles. Each dot represents an Atlanta cohort patient (n = 14 and 17 for healthy and infected, respectively). Colors of the dots indicate the severity of clinical disease, as shown in the legends. The differences between the groups were measured by Mann-Whitney rank sum test. The P values depicting significance are shown within the box plots.
Fig. 3
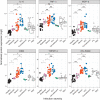
Fig. 3. Multiplex analysis of cytokines in the plasma of COVID-19 patients.
Cytokine levels in the plasma of healthy or infected individuals. The infected individuals are further classified on the basis of the severity of their clinical COVID-19 disease. The normalized protein expression values plotted on the y axes are arbitrary units defined by Olink Proteomics to represent Olink data. In all box plots, the boxes show median, upper, and lower quartiles. The whiskers show 5th to 95th percentiles. Each dot represents an Atlanta cohort sample (n = 18 healthy, 4 moderate, 18 severe, 12 ICU, 2 convalescent, 8 flu, and 11 RSV). The colors of the dots indicate the severity of clinical disease, as shown in the legends. The differences between the groups were measured by Mann-Whitney rank sum test (Wilcoxon, paired = FALSE; *P < 0.05; **P < 0.01; ***P < 0.001; ns, not significant).
Fig. 4
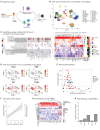
Fig. 4. Early, transient ISG expression in COVID-19 infection.
(A) A schematic representation of the DC enrichment strategy used in CITE-seq analysis. (B) UMAP representation of PBMCs from all analyzed samples (n = 12), colored by manually annotated cell type. (C) Pairwise comparison of genes from healthy individuals (n = 5) and COVID-19–infected patients (n = 7) was conducted for each cluster. DEGs were analyzed for overrepresentation of BTMs. The ringplot shows overrepresented pathways in up- and down-regulated genes of each cluster. The heatmap on the right shows the average expression levels of 33 ISGs derived from the enriched BTMs in different cell clusters of healthy (n = 5) and COVID-19 subjects (n = 7). (D) UMAP representation of PBMCs from all analyzed samples showing the expression levels of selected IFNs and ISGs. (E) Kinetics of circulating IFN-α levels (femtograms per milliliter) in plasma measured using SIMoA technology (n = 18 healthy and 40 COVID-19–infected patients). (F) Correlation between circulating IFN-α levels in plasma and the average expression of ISGs measured by CITE-seq analysis. (G) Hierarchically clustered heatmap of the expression of the CITE-seq ISG signature (C) in the bulk RNA-seq dataset, performed using an extended group of subjects (n = 17 healthy and 17 COVID-19–infected samples). Colors represent gene-wise z scores. (H) Bar chart representing the proportion of variance in CITE-seq ISG signature expression explained by the covariates in the x axis through principal variance component analysis (PVCA). resid, residual. (figure on next page)
Fig. 5
Fig. 5. Attenuated inflammatory response in peripheral innate immune cells from COVID-19 patients.
(A) Flow cytometry analysis of PBMCs analyzed in parallel to the CITE-seq experiment. The log10 median fluorescence intensity (MFI) of HLA-DR expression is shown. (B) Median intensity of HLA-DR expression in the phospho-CyTOF experiment from Fig. 1. Squares represent individual samples [Hong Kong (HK): healthy = 30, moderate = 15, and severe = 10; and Atlanta: healthy = 17, moderate = 4, and severe = 13]. The boxes indicate median, upper, and lower quartiles. The whisker length equals 1.5 times the interquartile range. (C) Relative (Rel.) expression of genes encoding different cytokines in the bulk RNA-seq dataset. The boxes show median, upper, and lower quartiles, and the whiskers show 5th to 95th percentiles. (D) UMAP representation of S100A12 expression in PBMCs from all samples analyzed by CITE-seq. (E and F) Correlation (Cor) analysis of S100A12 expression in cells from myeloid and dendritic cell clusters (C MONO_1, NC MONO, CDC2, PDC, C MONO_IFN, C MONO_2, and C MONO_3) with EN-RAGE levels in plasma (E) or HLA-DPA1 expression in the same clusters (F) (n = 5 healthy and 7 COVID-19 subjects). The statistical significance between the groups in (B) and (C) was determined by two-sided Mann-Whitney rank-sum test; *P < 0.05; **P < 0.01; ***P < 0.001.
Fig. 6
Fig. 6. Systemic release of microbial products in severe COVID-19 infection.
(A and B) Box plots showing bacterial 16S rRNA gene (A) and LPS (B) measured in the plasma of healthy or infected individuals. qPCR, quantitative PCR. (C) Spearman’s correlation between cytokines and bacterial DNA measured in plasma. Each dot represents a sample (n = 18 and 51 for healthy and infected, respectively). The colors of the dots indicate the severity of clinical disease, as shown in the legends. The boxes show median, upper, and lower quartiles in the box plots. The whiskers show 5th to 95th percentiles. The differences between the groups were measured by Mann-Whitney rank sum test; ***P < 0.001; ****P < 0.0001. NPX, normalized protein expression units; R, correlation coefficient.

References

    1. Wu Z., McGoogan J. M., Characteristics of and Important Lessons From the Coronavirus Disease 2019 (COVID-19) Outbreak in China: Summary of a Report of 72314 Cases From the Chinese Center for Disease Control and Prevention. JAMA 323, 1239–1242 (2020). 10.1001/jama.2020.2648 - DOI - PubMed
    1. CDC COVID-19 Response Team, Preliminary Estimates of the Prevalence of Selected Underlying Health Conditions Among Patients with Coronavirus Disease 2019 — United States, February 12–March 28, 2020. MMWR Morb. Mortal. Wkly. Rep. 69, 382–386 (2020). 10.15585/mmwr.mm6913e2 - DOI - PMC - PubMed
    1. Channappanavar R., Perlman S., Pathogenic human coronavirus infections: Causes and consequences of cytokine storm and immunopathology. Semin. Immunopathol. 39, 529–539 (2017). 10.1007/s00281-017-0629-x - DOI - PMC - PubMed
    1. Grifoni A., Weiskopf D., Ramirez S. I., Mateus J., Dan J. M., Moderbacher C. R., Rawlings S. A., Sutherland A., Premkumar L., Jadi R. S., Marrama D., de Silva A. M., Frazier A., Carlin A. F., Greenbaum J. A., Peters B., Krammer F., Smith D. M., Crotty S., Sette A., Targets of T Cell Responses to SARS-CoV-2 Coronavirus in Humans with COVID-19 Disease and Unexposed Individuals. Cell 181, 1489–1501.e15 (2020). 10.1016/j.cell.2020.05.015 - DOI - PMC - PubMed
    1. Hadjadj J., Yatim N., Barnabei L., Corneau A., Boussier J., Smith N., Péré H., Charbit B., Bondet V., Chenevier-Gobeaux C., Breillat P., Carlier N., Gauzit R., Morbieu C., Pène F., Marin N., Roche N., Szwebel T.-A., Merkling S. H., Treluyer J.-M., Veyer D., Mouthon L., Blanc C., Tharaux P.-L., Rozenberg F., Fischer A., Duffy D., Rieux-Laucat F., Kernéis S., Terrier B., Impaired type I interferon activity and inflammatory responses in severe COVID-19 patients. Science 369, 718–724 (2020). 10.1126/science.abc6027 - DOI - PMC - PubMed

Publication types

MeSH terms