. 2020 Aug 25;117(34):20741-20752.
doi: 10.1073/pnas.1917663117. Epub 2020 Aug 11.

Neural transcription factor Pou4f1 promotes renal fibrosis via macrophage-myofibroblast transition

Affiliations

Neural transcription factor Pou4f1 promotes renal fibrosis via macrophage-myofibroblast transition

Patrick Ming-Kuen Tang et al. Proc Natl Acad Sci U S A. .

Erratum in

Abstract

Unresolved inflammation can lead to tissue fibrosis and impaired organ function. Macrophage-myofibroblast transition (MMT) is one newly identified mechanism by which ongoing chronic inflammation causes progressive fibrosis in different forms of kidney disease. However, the mechanisms underlying MMT are still largely unknown. Here, we discovered a brain-specific homeobox/POU domain protein Pou4f1 (Brn3a) as a specific regulator of MMT. Interestingly, we found that Pou4f1 is highly expressed by macrophages undergoing MMT in sites of fibrosis in human and experimental kidney disease, identified by coexpression of the myofibroblast marker, α-SMA. Unexpectedly, Pou4f1 expression peaked in the early stage in renal fibrogenesis in vivo and during MMT of bone marrow-derived macrophages (BMDMs) in vitro. Mechanistically, chromatin immunoprecipitation (ChIP) assay identified that Pou4f1 is a Smad3 target and the key downstream regulator of MMT, while microarray analysis defined a Pou4f1-dependent fibrogenic gene network for promoting TGF-β1/Smad3-driven MMT in BMDMs at the transcriptional level. More importantly, using two mouse models of progressive renal interstitial fibrosis featuring the MMT process, we demonstrated that adoptive transfer of TGF-β1-stimulated BMDMs restored both MMT and renal fibrosis in macrophage-depleted mice, which was prevented by silencing Pou4f1 in transferred BMDMs. These findings establish a role for Pou4f1 in MMT and renal fibrosis and suggest that Pou4f1 may be a therapeutic target for chronic kidney disease with progressive renal fibrosis.

Keywords: Pou4f1; macrophage–myofibroblast transition; renal fibrosis.


Conflict of interest statement

The authors declare no competing interest.

Figures
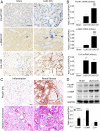
Fig. 1.
Fig. 1.
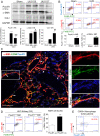
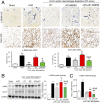
Pou4f1 is expressed in the fibrosing kidney. Pou4f1 expression by interstitial cells in the UUO kidney is associated with markers of renal fibrosis; α-SMA and collagen I (Col-I), compared to the sham control as shown by (A) immunostaining, and (B) real-time PCR. (C) Immunostaining in a case of human chronic allograft nephropathy shows Pou4f1 expression in many interstitial cells in an area of active fibrosis (Right), whereas little Pou4f1 staining is seen in a different area with severe inflammation only (Left). Lesions are also shown by Masson’s trichrome staining. (D) Western blot shows increased levels of Pou4f1 and fibrotic markers on day 7 UUO. Data represent results from eight mice/group. (B) *P < 0.05, ***P < 0.001 vs. sham control; ##P < 0.01, ###P < 0.001 vs. UUO day 5; (C) ***P < 0.001 vs. day 7 sham. (Scale bars, 50 μm.)
Fig. 2.
Fig. 2.
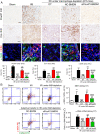
Pou4f1 is expressed by MMT cells in the UUO model. (A) Western blot analysis shows increased Pou4f1 expression on days 5 and 7 UUO in association with increased levels of the myofibroblast marker α-SMA and collagen I (Col-I). Graphs show quantification of the blots. (B) Flow cytometry analysis of kidney samples derived by enzyme digestion. The plots show double staining for Pou4f1 with F4/80 or α-SMA. Graphs show the percentage of F4/80+ cells and α-SMA+ cells that coexpress Pou4f1. (C) Confocal microscopy with z-stack scanning identified Pou4f1 (blue) expression by MMT cells (α-SMA, red; F4/80, green) in the day 7 UUO kidney. (D) Flow cytometric analysis of day 5 UUO kidney showing α-SMA expression by Pou4f1+F4/80+ and Pou4f1F4/80+ cells. Graph shows the percentage of MMT cells (α-SMA+F4/80+ cells) that coexpress Pou4f1 on day 5 UUO. (E) Flow cytometric analysis of double staining for Pou4f1 and α-SMA in a single kidney sample from a patient with chronic allograft dysfunction (CAD). Data represent results from eight mice/group. (A and B) **P < 0.01, ***P < 0.001 vs. sham control; #P < 0.05, ##P < 0.01, ###P < 0.001 vs. D5 UUO kidney; (D) ***P < 0.001 vs. Pou4f1−ve macrophages. (Scale bars, 50 μm.)
Fig. 3.
Fig. 3.
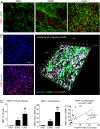
Pou4f1 is expressed by MMT cells in human kidney disease. (A) Confocal microscopy shows that CD68+ macrophages (red) and α-SMA+ myofibroblasts (green) are distinct cell populations in cases of end-stage renal disease (ESRD) and diabetic kidney disease (DKD). By contrast, many MMT cells coexpressing CD68 and α-SMA (yellow) can be seen in an area of active fibrosis in a case of chronic allograft dysfunction (CAD). (B) Opal multiplex IHC system identified that most CD68+ macrophages express Pou4f1 (purple) in an area of active fibrosis in CAD, including Pou4f1 expression by many α-SMA+CD68+ MMT cells (white). This is more clearly seen in the 3D illustration. (C) Graphs show quantification of staining from a cohort of 10 cases of kidney disease. A significant correlation is evident between Pou4f1+ macrophages and the contribution of the MMT cells in total α-SMA+ myofibroblasts. (C) *P < 0.05, **P < 0.01, ***P < 0.001 vs. ESRD; ##P < 0.001, ###P < 0.001 vs. ESRD. (Scale bars, 100 μm.)
Fig. 4.
Fig. 4.
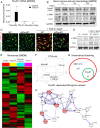
Pou4f1 expression is tightly regulated by Smad3 in MMT cells in vivo and in vitro. (A) Immunostaining shows many Pou4f1+ interstitial cells in the day 7 UUO kidney in wild-type mice (Smad3-WT), which were markedly reduced in the UUO kidney in mice lacking Smad3 (Smad3-KO). (B) Similarly, Pou4f1 mRNA levels were substantially increased in day 7 UUO kidney in Smad3-WT mice and reduced in day 7 UUO Smad3-KO mice. (C) Time course of TGF-β1 stimulation of cultured BMDMs shows increased Pou4f1 mRNA in Smad3-WT cells, but not in Smad3-KO cells. (D) A conserved Smad3 binding site (red narrow) is evident in the promoter region of the human and mouse Pou4f1 genomic sequence by ECR browser. (E) TGF-β1 stimulation of BMDMs significantly enriched physical binding of the Smad3 protein to the Pou4f1 promoter region as shown by ChIP and ChIP-PCR assays. (F) The Smad3 binding site, but not a mutated Smad3 binding site, induced transcription of Pou4f1 in a dual-luciferase assay. Data represent three independent in vitro experiments or from eight mice/group. (B and C) **P < 0.01, ***P < 0.001 vs. sham or control; ##P < 0.01, ###P < 0.001 vs. Smad3-WT; (E) *P < 0.05 vs. TGF-β1-stimulated IgG; (F) ***P < 0.001 vs. pcDNA3.1, ###P < 0.001 vs. Smad3-expressed Pou4f1-promoter group. (Scale bars, 50 μm.)
Fig. 5.
Fig. 5.
A Pou4f1-dependent fibrogenic gene network at an early stage of MMT. (A) TGF-β1 (5 ng/mL) induced Pou4f1 transcription in BMDM at day 1 which rapidly declined to baseline as shown by real-time PCR. (B) Western blot shows a peak of Pou4f1 protein expression on day 1 after TGF-β1 stimulation of BMDMs which preceded the peak expression of fibrosis markers α-SMA and collagen I on day 5. siRNA-mediated silencing of Pou4f1 (siPou4f1) inhibited TGF-β1-driven MMT on day 5 in BMDMs compared to the nonsense siRNA control (NC) in terms of (C) a reduction in α-SMA+CD68+ MMT cells via immunofluorescence microscopy, and (D) a reduction in the fibrosis markers α-SMA and collagen I via Western blotting. For microarray analysis, siPou4f1 or NC treated BMDMs, with or without TGF-β1 stimulation, were collected at 24 h. The transcriptome similarity was clearly distinguishable in each group containing a pool of three independent replicates shown by (E) heatmap, and (F) a 3D principal component analysis (PCA) plot. (G) A total of 215 MMT-dependent genes were identified at 24 h of TGF-β1-driven MMT, whereas 51 genes were regulated in a Pou4f1-dependent fashion in BMDMs as shown in the Venn diagram. (H) The Pou4f1-dependent genes formed a regulatory network containing a number of fibrogenic effectors (red) by STRING network analysis. Data represent three independent in vitro experiments. (A) **P < 0.01 vs. control. (Scale bars, 20 μm.)
Fig. 6.
Fig. 6.
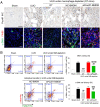
Silencing of Pou4f1 in BMDM inhibits MMT in an adoptive transfer version of the UUO model. A day 5 UUO model was performed in LysM-Cre/DTR mice. Mice were treated with diptheria toxin (DT) for 3 d before UUO surgery to deplete macrophages. At 6 h after UUO surgery, mice were injected with either Pou4f1-knockdown (siPou4f1) or nonsense siRNA-treated (NC) BMDMs (2 × 10⁶ cells/mouse) which had a 24-h stimulation with TGF-β1 (5 ng/mL) in culture prior to injection. (A) Immunostaining for Pou4f1 (Upper) and confocal microscopy for α-SMA (green) and F4/80 (red) (power panel), show that compared to the UUO control, DT treatment depleted both F4/80+ macrophages and Pou4f1+ interstitial cells. Both populations were restored by adoptive transfer with NC-BMDMs, while transfer of siPou4f1-BMDMs restored the F4/80+ macrophage population but not the interstitial Pou4f1+ cells on day 5 UUO. (B) Flow cytometry analysis shows that DT-induced macrophage depletion reduced both the total α-SMA+ myofibroblast population and SMA+CD68+ MMT cells. While NC-BMDM transfer restored both of these populations, the transfer of siPou4f1-BMDMs failed to achieve this. Data represent results from six mice/group. **P < 0.01, ***P < 0.001 vs. sham control; ##P < 0.01, ###P < 0.001 vs. UUO; @@P < 0.01, @@@P < 0.001 vs. adoptive transfer of NC-BMDMs under macrophage depletion (NC-BMDM). (Scale bars, 50 μm.)
Fig. 7.
Fig. 7.
Silencing of Pou4f1 in BMDMs inhibits renal fibrosis in an adoptive transfer version of the UUO model. (A) Immunohistochemistry staining of α-SMA and collagen I in the adoptive transfer day 5 UUO model in macrophage-depleted LysM-Cre/DTR mice. Macrophage depletion with DT reduced both α-SMA and Col-I staining in the UUO kidney. This was restored by adoptive transfer with nonsense siRNA treated (NC) BMDMs, whereas transfer of Pou4f1 siRNA-treated (siPou4f1) BMDMs failed to restore renal fibrosis. These findings were confirmed by (B) Western blot and (C) real-time PCR, for α-SMA and Col-I. Data represent results from six mice/group. **P < 0.01, ***P < 0.001 vs. sham control; #P < 0.05, ###P < 0.001 vs. UUO; ^P < 0.01, ^^P < 0.001, ^^^P <0.001 vs. macrophage depletion (DT); @P < 0.05, @@@P < 0.001 vs. adoptive transfer of NC-BMDM under macrophage depletion (NC-BMDM). (Scale bars, 50 μm.)
Fig. 8.
Fig. 8.
Silencing of Pou4f1 in BMDMs inhibits MMT in an adoptive transfer version of the IRI model. A day 7 IRI model was performed in LysM-Cre/DTR mice. Mice were treated with DT for 3 d before IRI surgery to deplete macrophages. At 24 h after IRI surgery, mice were injected with either Pou4f1-knockdown (siPou4f1) or nonsense siRNA treated (NC) BMDM (2 × 10⁶ cells/mouse) which had a 24-h stimulation with TGF-β1 (5 ng/mL) in culture prior to injection. (A) Immunohistochemistry staining for Pou4f1 (Upper) and Col-I (Middle), and confocal microscopy for α-SMA (green) and F4/80 (red) (power panel). Compared to the IRI control, DT treatment reduced F4/80+ macrophages, α-SMA+ myofibroblasts, Pou4f1+ interstitial cells, and interstitial collagen I deposition. Adoptive transfer of NC-BMDMs restored all of these populations and collagen I deposition in the IRI model. However, transfer of siPou4f1-BMDMs restored only the F4/80+ macrophage population. (B) Flow cytometry analysis, and (C) real-time PCR show that DT-induced macrophage depletion reduced both total α-SMA expression and α-SMA+CD68+ MMT cells. Transfer of NC-BMDMs, but not siPou4f1-BMDMs, restored both α-SMA expression and α-SMA+CD68+ MMT cells. Data represent results of six mice/group. *P < 0.05, **P < 0.01, ***P < 0.001 vs. sham control; #P < 0.05, ###P < 0.001 vs. IRI; ^^^0.001 vs. macrophage depletion (DT); @@P < 0.01, @@@0.001 vs. adoptive transfer of NC-BMDMs under macrophage depletion (NC-BMDM). (Scale bars, 50 μm.)

Comment in

  • Uro-Science.
    Atala A. Atala A. J Urol. 2021 May;205(5):1517-1519. doi: 10.1097/JU.0000000000001658. Epub 2021 Feb 24. J Urol. 2021. PMID: 33625915 No abstract available.

References

    1. Rockey D. C., Bell P. D., Hill J. A., Fibrosis–A common pathway to organ injury and failure. N. Engl. J. Med. 372, 1138–1149 (2015). - PubMed
    1. Klingberg F., Hinz B., White E. S., The myofibroblast matrix: Implications for tissue repair and fibrosis. J. Pathol. 229, 298–309 (2013). - PMC - PubMed
    1. LeBleu V. S.et al. ., Origin and function of myofibroblasts in kidney fibrosis. Nat. Med. 19, 1047–1053 (2013). - PMC - PubMed
    1. Jinde K.et al. ., Tubular phenotypic change in progressive tubulointerstitial fibrosis in human glomerulonephritis. Am. J. Kidney Dis. 38, 761–769 (2001). - PubMed
    1. Ng Y. Y.et al. ., Tubular epithelial-myofibroblast transdifferentiation in progressive tubulointerstitial fibrosis in 5/6 nephrectomized rats. Kidney Int. 54, 864–876 (1998). - PubMed

Publication types

MeSH terms

LinkOut - more resources