. 2021 Apr;39(4):451-461.
doi: 10.1038/s41587-020-0645-6. Epub 2020 Aug 12.

Massively parallel single-cell mitochondrial DNA genotyping and chromatin profiling

Affiliations

Massively parallel single-cell mitochondrial DNA genotyping and chromatin profiling

Caleb A Lareau et al. Nat Biotechnol. 2021 Apr.

Erratum in

Abstract

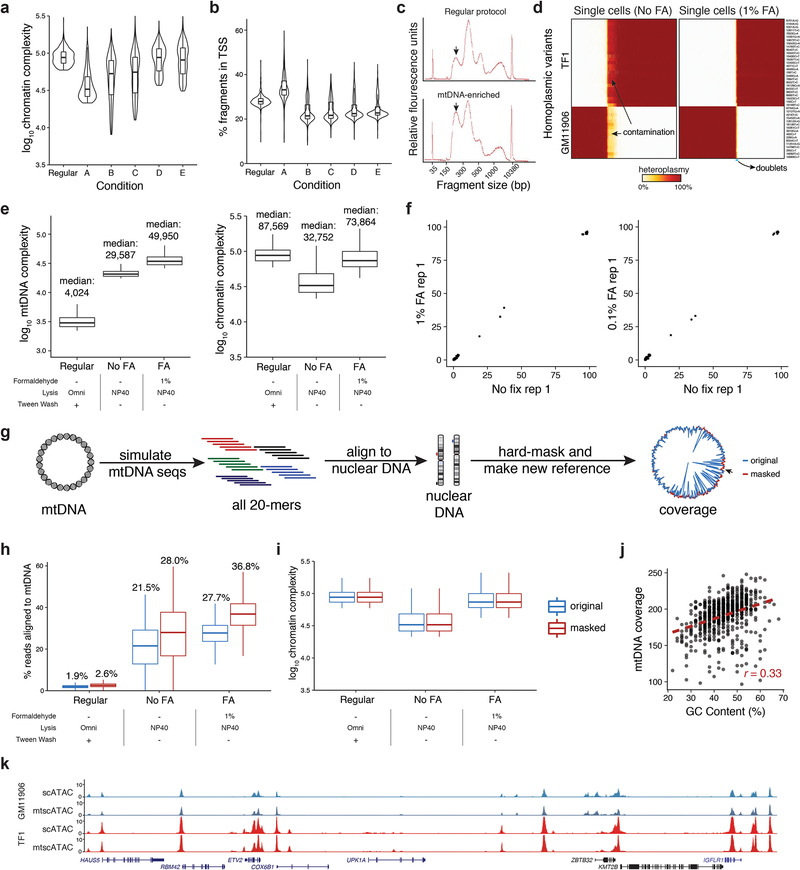
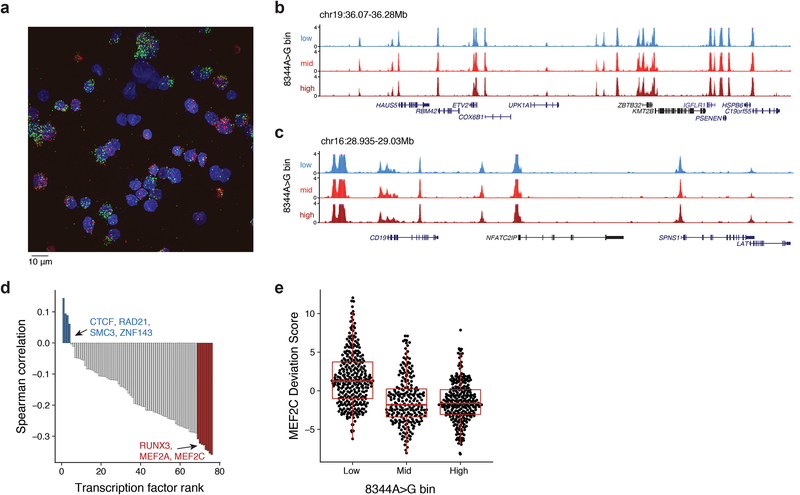
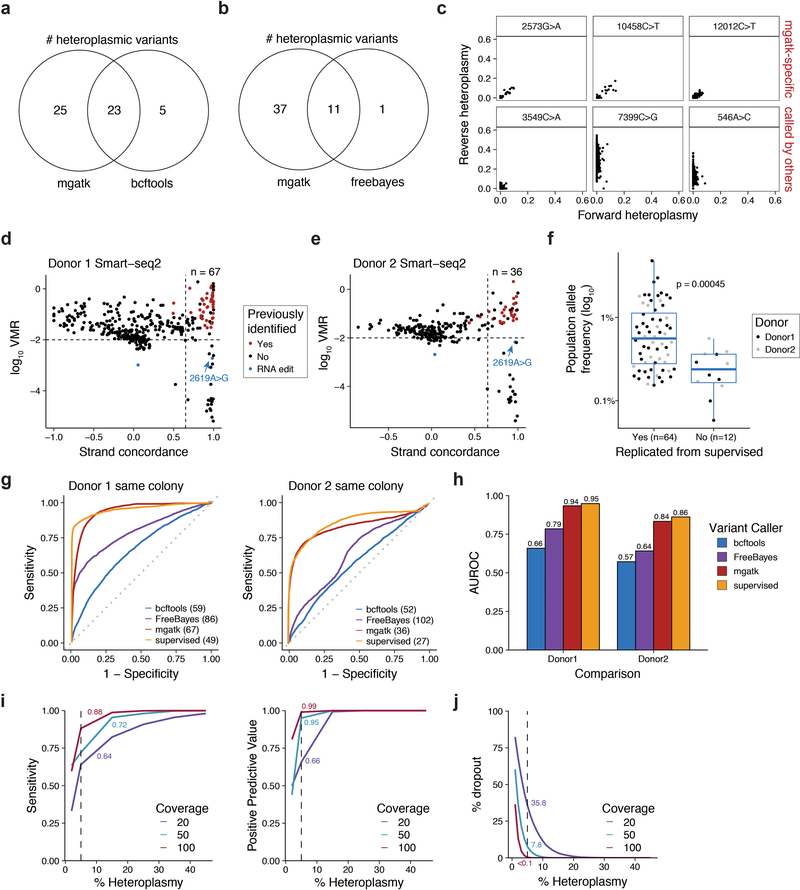
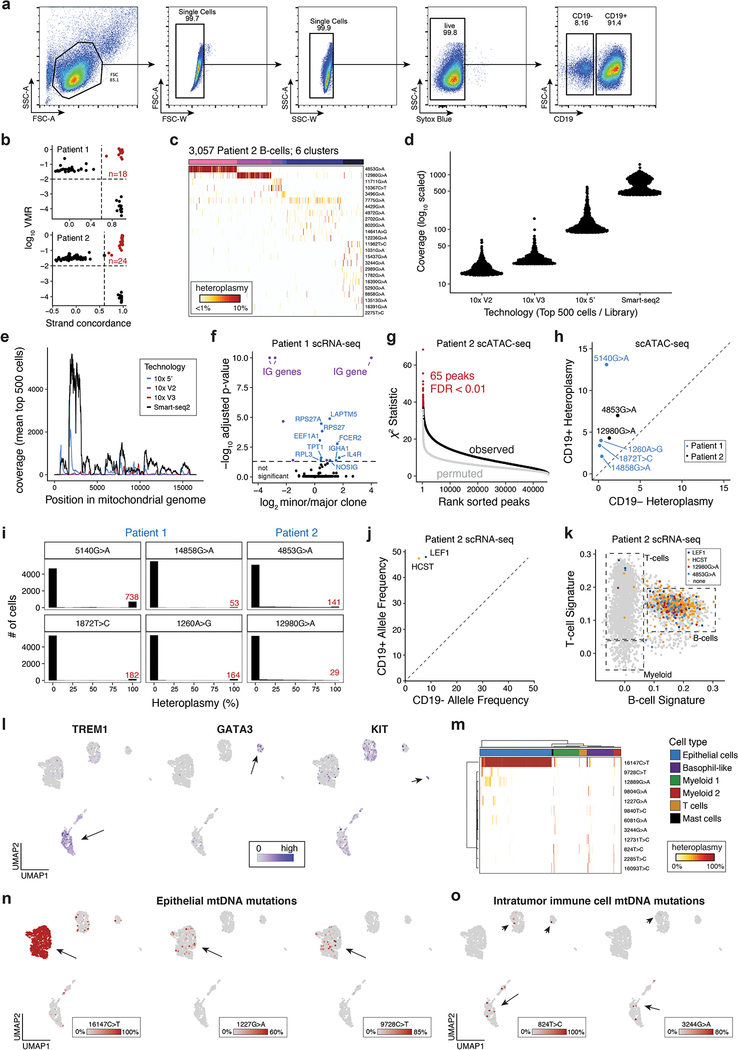
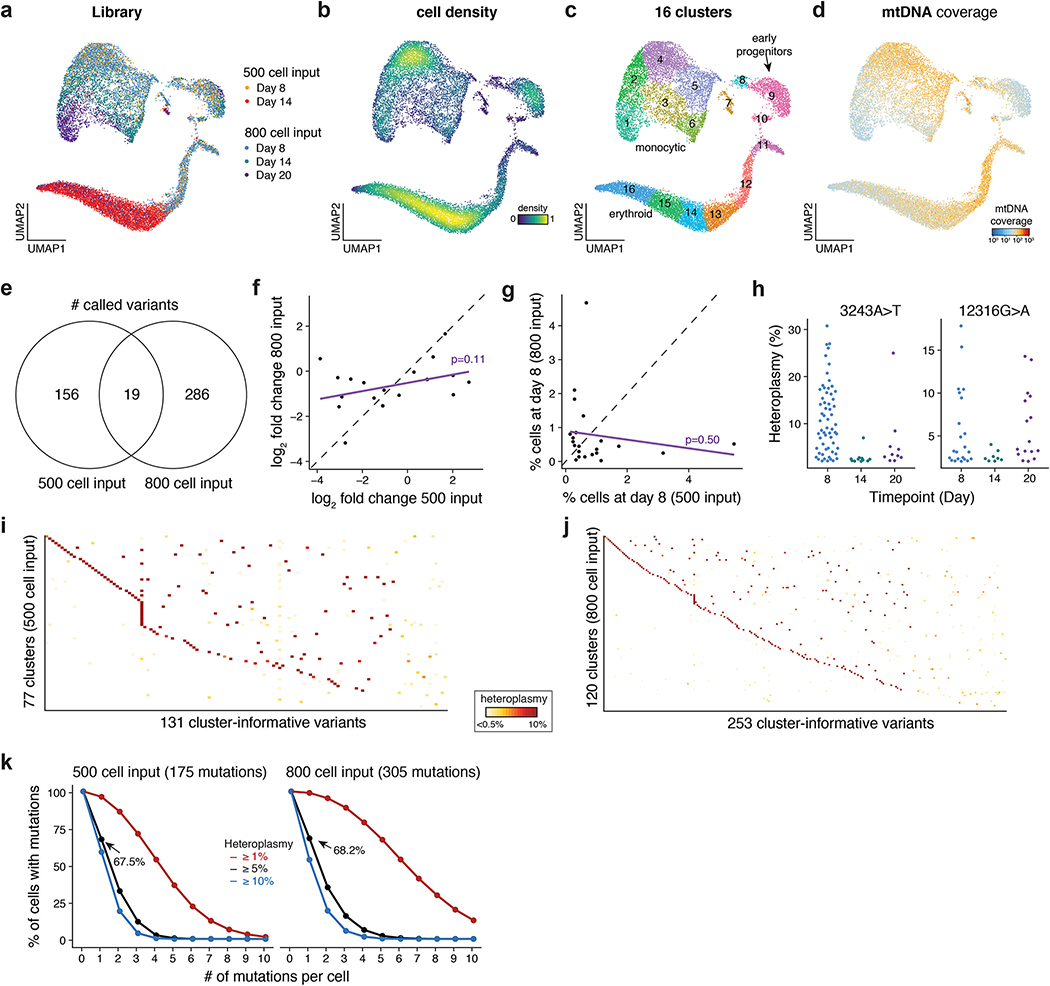
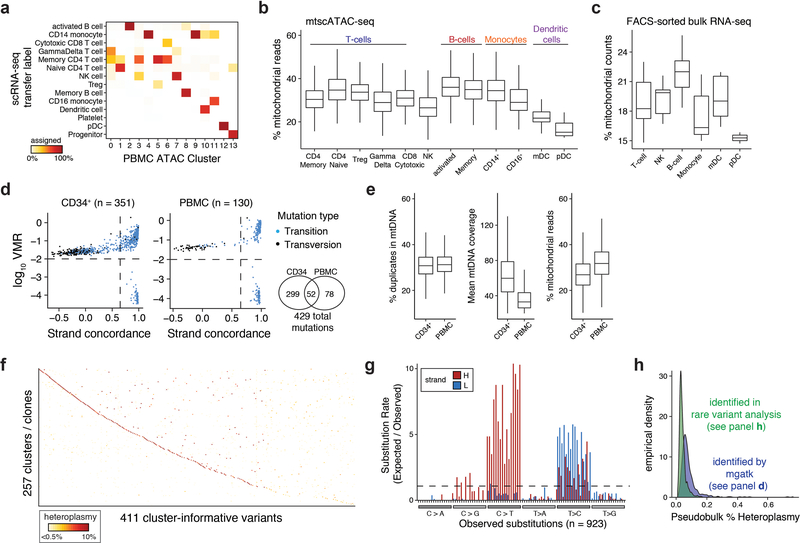
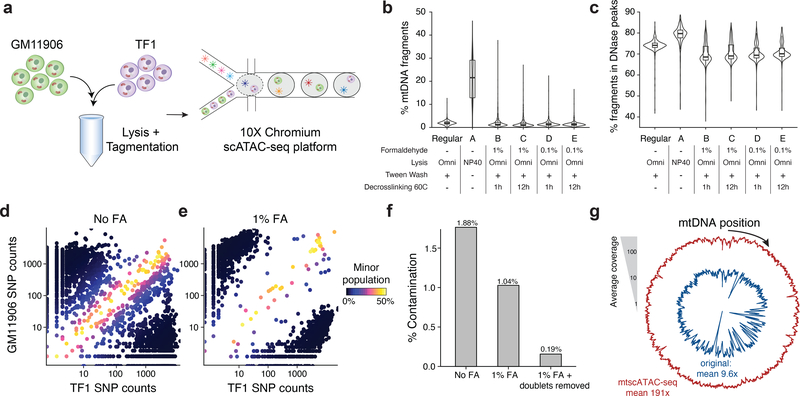
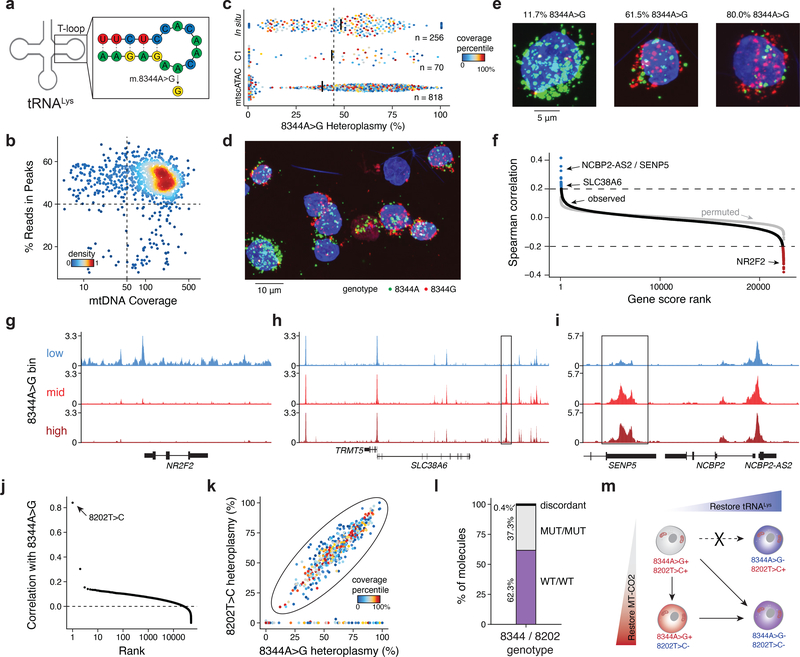
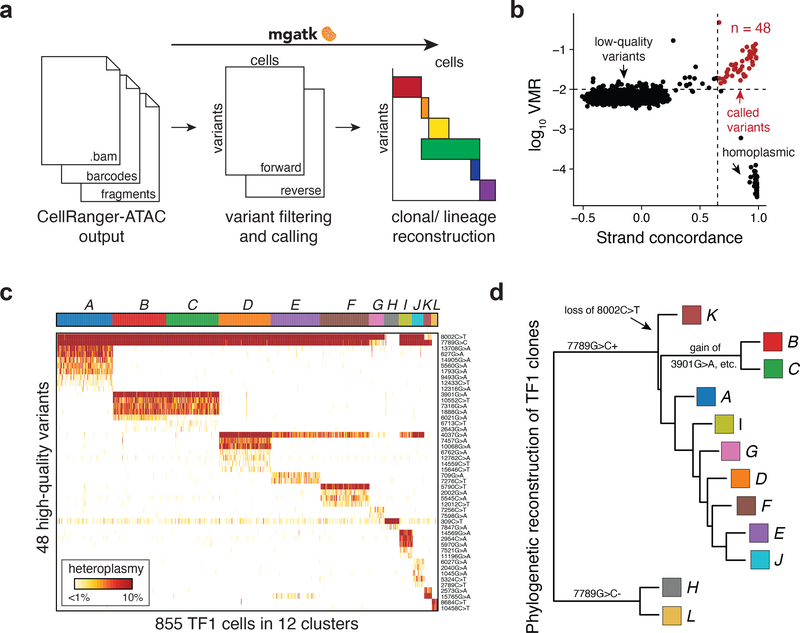
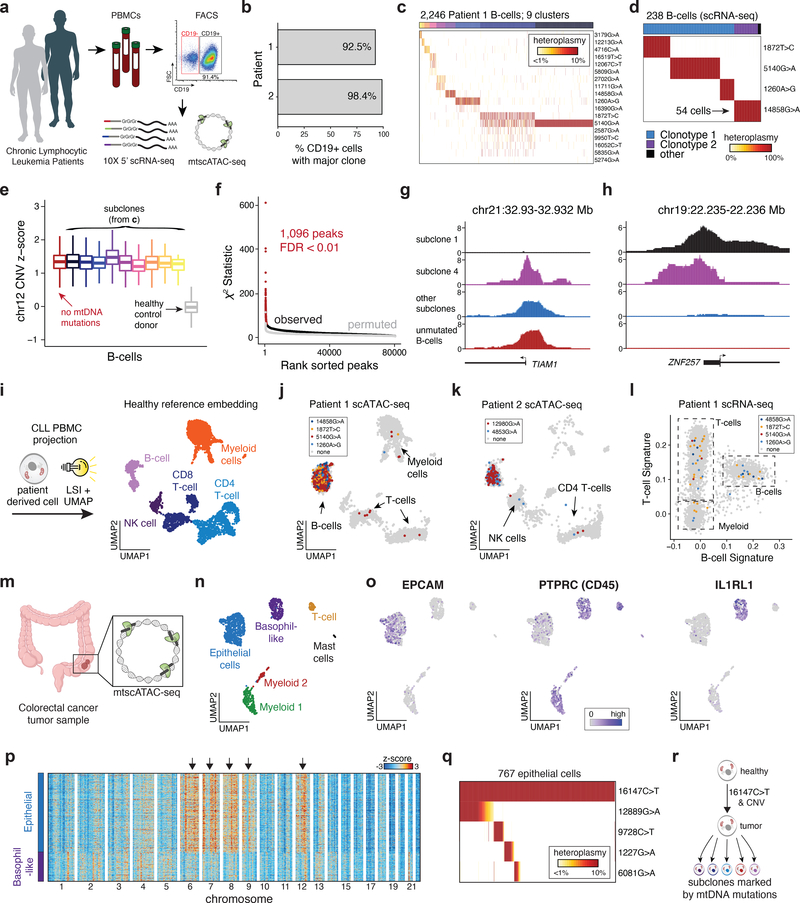
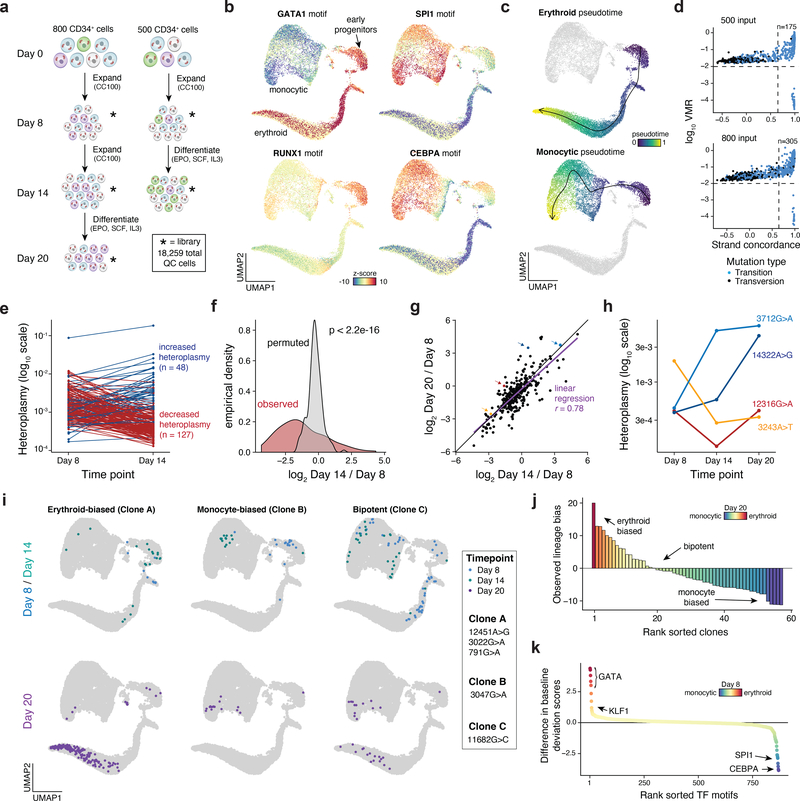
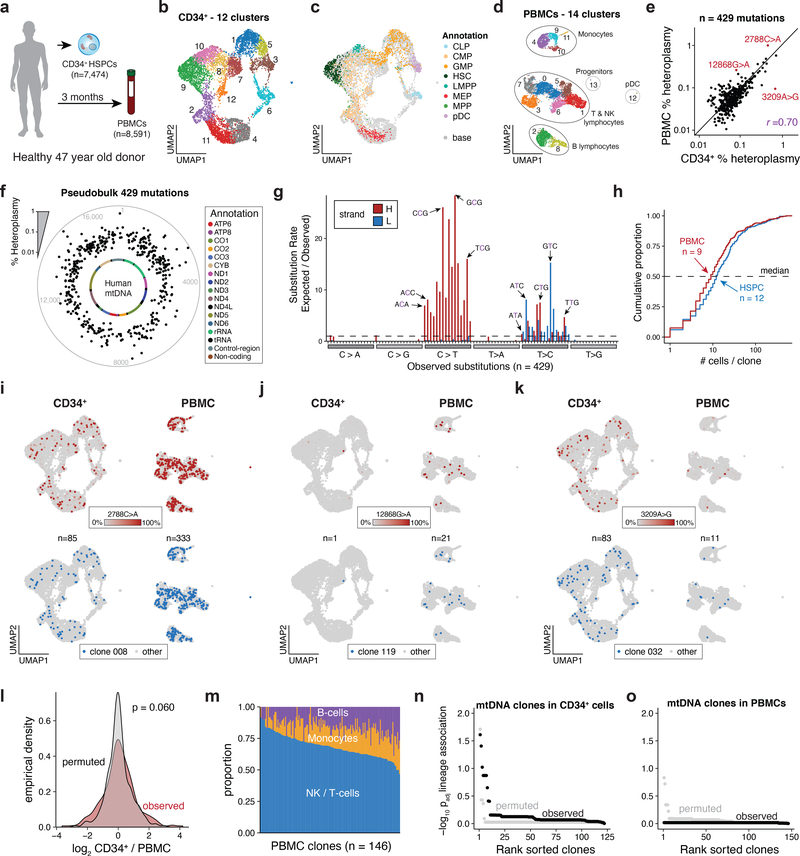
Natural mitochondrial DNA (mtDNA) mutations enable the inference of clonal relationships among cells. mtDNA can be profiled along with measures of cell state, but has not yet been combined with the massively parallel approaches needed to tackle the complexity of human tissue. Here, we introduce a high-throughput, droplet-based mitochondrial single-cell assay for transposase-accessible chromatin with sequencing (scATAC-seq), a method that combines high-confidence mtDNA mutation calling in thousands of single cells with their concomitant high-quality accessible chromatin profile. This enables the inference of mtDNA heteroplasmy, clonal relationships, cell state and accessible chromatin variation in individual cells. We reveal single-cell variation in heteroplasmy of a pathologic mtDNA variant, which we associate with intra-individual chromatin variability and clonal evolution. We clonally trace thousands of cells from cancers, linking epigenomic variability to subclonal evolution, and infer cellular dynamics of differentiating hematopoietic cells in vitro and in vivo. Taken together, our approach enables the study of cellular population dynamics and clonal properties in vivo.


Figures

Extended Data Fig. 1:
Extended Data Fig. 1:. Additional validation of biotechnological and computational basis for single-cell mtDNA genotyping.
(a) Comparison of chromatin library complexity (estimated number of unique fragments) across screened lysis conditions as shown in Fig. 1. (b) The same variable lysis conditions showing the TSS rate per cell. (c) BioAnalyzer traces of mtscATAC-seq library fragment size distribution for regular conditions and mtDNA-enriched conditions. (d) Heteroplasmy heatmap of single cells (columns) for 43 private homoplasmic mutations (rows) in the TF1 or GM11906 cell lines with (left) and without (right) FA treatment. Color bar, heteroplasmy (% allele frequency). (e) Comparison of mtDNA fragment complexity and chromatin complexity between the original/ regular 10x scATAC protocol and modified lysis conditions with and without formaldehyde (FA) treatment. (f) Heteroplasmy of sum of single-cell ATAC-seq libraries with variable FA treatment. (g) Schematic, method, and results of improving mtDNA genome coverage via hard-masking the reference genome (Methods). (h) Comparison of % reads mapping to mtDNA and (i) chromatin complexity with (red) and without (blue) the hard masking. (j) Comparison of average coverage of mtscATAC-seq (y axis) and GC content (x axis) at each 50bp bin (dot) in the mtDNA genome. (k) Accessible chromatin landscapes aggregated from single cells near the ETV2 locus for both cell lines as assayed via regular scATAC-seq and mtscATAC-seq. For boxplots in (a,b,e,h,i), each condition represents the top 1,000 cells (based on chromatin complexity) for one experiment. Boxplots: center line, median; box limits, first and third quartiles; whiskers, 1.5x interquartile range.
Extended Data Fig. 2:
Extended Data Fig. 2:. Further inferences in analysis of the GM11906 (MERRF) lymphoblastoid cell line.
(a) Alternative field of view for GM11906 in situ genotyping imaging experiment. Representative image selected from one of seven fields of view for one experiment. Pseudo bulk accessibility track plots are shown for the (b) ETV2 and (c) CD19 loci. Pseudo-bulk groups represent 0–10% (low), 10–60% (mid), and 60–100% (high) m.8344A>G heteroplasmy. (d) Spearman correlation of heteroplasmy against the ChIP-seq deviation scores computed via chromVAR. Each bar is a single transcription factor with selected factors highlighted. (e) Depiction of MEF2C deviation scores from chromVAR for m.8344A>G heteroplasmy bins, corresponding to 0–10% (Low), 10–60% (Mid), and 60–100% (High). Boxplots: center line, median; box limits, first and third quartiles; whiskers, 1.5x interquartile range. Bins contain single cells collected over one experiment where bins correspond to high (>60%; n=273), intermediate (10–60%; n=228), and low (<10%; n=313) heteroplasmy (see Fig. 2c).
Extended Data Fig. 3:
Extended Data Fig. 3:. Supporting information for somatic mtDNA mutation calling via mgatk.
(a) Venn diagrams depicting comparisons of heteroplasmic mutations identified by mgatk, samtools/ bcftools, and (b) FreeBayes. (c) Comparison of heteroplasmy estimated from reads aligned to either strand. The top row are three variants called specifically by mgatk; 3549C>A was identified only by FreeBayes. 7399C>G and 546A>C were called specifically by bcftools. (d) Identification of 67 and (e) 36 heteroplasmic variants from previously published SMART-seq2 hematopoietic colony data. Blue variants represent known RNA-editing events. (f) Comparison of population heteroplasmy values for variants replicated by mgatk from a previous supervised approach. Boxplots: center line, median; box limits, first and third quartiles; whiskers, 1.5x interquartile range. Statistical test: two-sided Mann-Whitney U Test. (g) Concordance between discerning cells sharing a clonal origin based on colony-specific mtDNA mutations and their unsupervised identification using indicated algorithms (mgatk, bcftools, FreeBayes) and previously described supervised approach. Receiver operating characteristic (ROC) using the per cell pair mtDNA similarity metric to identify pairs of cells sharing a clonal origin based on sets of mtDNA variants. The number of variants in each set is also depicted. (h) Area under the ROC (AUROC) is denoted for each donor group and indicated variant caller as depicted in (g). Each bar represents the statistic from one evaluation per donor per tool. (i) Estimated sensitivity (y axis, left), positive predictive value (y axis, right), and (j) estimated % dropout (y axis) for mtscATAC-seq at different simulated levels of heteroplasmy (x axis; Methods). Vertical line: 5% heteroplasmy for a subclonal mutation. The in-graph numbers indicate the values from the curve at a single-cell heteroplasmy of 5% with colors corresponding to different per-cell coverage values in the simulation.
Extended Data Fig. 4:
Extended Data Fig. 4:. Supporting information for clonal and functional heterogeneity in malignant populations revealed by mtDNA mutations.
(a) Flow cytometry gating strategy of CLL patient derived PBMCs showing expansion of CD19+ cells. (b) Identification of high-confidence variants for Patient 1 (top) and Patient 2 (bottom). The number of variants n is indicated. (c) Inference of subclonal structure from somatic mtDNA mutations for patient 2. Cells (columns) are clustered based on mitochondrial genotypes (rows). Colors at the top of the heatmap represent clusters or putative subclones. Color bar, heteroplasmy (% allele frequency). (d) Dot plots showing the mitochondrial genome coverage (log10; y-axis) for the top 500 cells per technology for four indicated scRNA-seq technologies. (e) The mean per-position mitochondrial genome coverage for the same 500 cells as in (d). (f) Volcano plot showing differential gene expression analysis from major and minor clonotypes defined by BCR sequence. Immunoglobulin (IG) genes are shown in purple; all other genes with an FDR < 0.05 are shown in blue. (g) Results for per-peak chi-squared association with sub-clonal group. Each dot is a peak rank-sorted by the chi-squared statistic. (h) Heteroplasmy from the sum of single-cells in the CD19+ and CD19- mtscATAC-seq experiments for indicated mutations and patients. (i) Histograms showing the distribution of heteroplasmy across the profiled population of cells for six selected variants, four from Patient 1 (left) and two from Patient 2 (right). The number of variants in the top heteroplasmy bin (>90%) are shown in red. (j) Allele frequency from the sum of single cells from the 5’ CD19+ and CD19- scRNA-seq libraries for two indicated variants - chr4:109,084,804A>C (“LEF1”) and chr19:36,394,730G>A (“HSCT”). (k) Corroboration of T cells based on gene expression signatures and carrying indicated somatic nuclear and mtDNA mutations (Patient 2). (l) Gene activity scores supporting cell type annotations in Fig. 4n. Arrows: cluster enriched for respective gene score. (m) All mtDNA mutations (rows) by cells (columns) observed in the CRC tumor. Columns are colored by defined chromatin cell state defined as in Fig. 4n. (n,o) Chromatin-derived UMAP with cells marked by select mtDNA mutations enriched in (n) epithelial and (o) immune cells. Color bar: heteroplasmy (% allele frequency).
Extended Data Fig. 5:
Extended Data Fig. 5:. Supporting information for clonal lineage tracing across accessible chromatin landscapes and time in an in vitro model of hematopoiesis.
(a) Depiction of single-cell UMAP embedding showing the original distribution of cells for each library/ time point, (b) relative cell density, (c) Louvain cluster, and (d) mitochondrial DNA coverage per single cell. (e) Overlap of variants called for each of the two datasets. (f) Comparison of log2 fold change in heteroplasmy from day 14 to day 8 for 19 overlapping variants. The p-value shown is for the beta 1 coefficient of the depicted linear regression model. (g) Proportion of cells (%) at day 8 of the 500 cell (x axis) and 800 cell (y axis) input culture carrying shared mtDNA variants as derived from panel (e) suggests limited clonal overlap. (h) Known pathogenic mtDNA mutations detected from a healthy donor. Each dot is a cell separated by the sampled library. All cells with a heteroplasmy of at least 2% are shown. (i) Depiction of unsupervised clustering of groups of cells based on shared somatic mtDNA mutations (y-axis) with corresponding individual mtDNA mutations (x-axis) associated with each cluster for the 500 cell input and (j) 800 cell input culture. Color bar, heteroplasmy (% allele frequency). (k) Fraction of cells (y-axis) carrying number of somatic mtDNA variants (x-axis) above indicated thresholds (≥1%, ≥5%, ≥10% heteroplasmy; red, black, and blue lines, respectively) for indicated cultures.
Extended Data Fig. 6:
Extended Data Fig. 6:. Support information for cellular population dynamics in native hematopoiesis in vivo resolved by mtDNA based tracing.
(a) Assignment probabilities (%, colorbar) of scRNA-seq data derived transfer labels (rows) across mtscATAC-seq derived Louvian data clusters (columns) as identified in Fig. 6d. (b) Distribution of percent mitochondrial reads derived from mtscATAC-seq data (y axis) across PBMC populations (x axis). (c) Percent mitochondrial counts (y axis) in FACS sorted populations (x axis) from bulk RNA-seq data. (d) Identification of high confidence variants from CD34+ HSPC and PBMC cell populations. Number of variants passing both thresholds (dotted lines) is indicated. A Venn diagram depicts the overlap of shared mutations. (e) Percent duplicates of sequenced mtDNA fragments, mean mtDNA coverage and percent mitochondrial reads for CD34+ HSPC and PBMC cell populations as derived from mtscATAC-seq data. Boxplots: center line, median; box limits, first and third quartiles; whiskers, 1.5x interquartile range. (f) Distribution of maximum level of heteroplasmy of mgatk derived variants from (d) in individual cells. (g) Unsupervised clustering of groups of cells based on shared somatic mtDNA mutations (y-axis) with corresponding individual mtDNA mutations (x-axis) associated with each cluster/clone. (h) Fold-change (observed over expected) of identified rare mutations (y axis) in each class of mononucleotide and trinucleotide change from the CD34+ HSPC data. (i) Comparison of pseudobulk allele frequencies from mgatk identified variants (blue) and rare variants (green). Boxplots for (b,c,e): center line, median; box limits, first and third quartiles; whiskers, 1.5x interquartile range. Bounds are contained within the data range shown. Sample sizes exceed 100 single cells from one experiment.
Figure 1 -
Figure 1 -. Optimization of a high-throughput single-cell mitochondrial DNA genotyping platform with concomitant accessible chromatin measurements.
(a) Schematic of cell line mixing experiment between indicated two human hematopoietic cell lines. (b) Distribution of percentage of mtDNA reads per single cell for screened conditions. (c) Distribution of percentage of reads mapping to annotated DNase hypersensitivity peaks (nuclear reads only) per single cell. Each condition in panels (b,c) represents the top 1,000 cells (based on chromatin complexity) from one experiment. (d) Mitochondrial SNP mixing depiction of variants for the TF1 or GM11906 cell line for “Condition A” as in (b). Both axes are log10 transformed. (e) Same as (d) but for “Condition A” with 1% FA treatment. (f) Summary of contamination (percent of reads from minor cell population) for FA treated and untreated comparison. Each bar represents the mean over one experiment. (g) Depiction of overall mitochondrial genome coverage improvements from three biotechnological and computational optimizations (mtscATAC-seq) compared to the original protocol. Boxplots for (b,c): center line, median; box limits, first and third quartiles; whiskers, 1.5x interquartile range.
Figure 2 -
Figure 2 -. Pathogenic mtDNA variability and clonal evolution in cells derived from a patient with MERRF.
(a) Schematic of the mitochondrial lysine tRNA secondary structure with sequence and the pathogenic single nucleotide variant (8344A>G). (b) Quality control filtering for GM11906 single cells based on mean mtDNA genome coverage and percentage of nuclear reads in chromatin accessibility peaks. (c) Quantification of 8344A>G heteroplasmy variability in single GM11906 cells across three technologies. Numbers (n) of cells plotted are shown. Color represents the within-assay coverage percentile. Black bars indicate the median heteroplasmy per technology; the dotted line presents the mean heteroplasmy as determined for bulk ATAC-seq. (d) Field of view for in situ genotyped GM11906 cells, highlighting (e) single cells with low, medium, and high heteroplasmy as indicated for the pathogenic allele. Representative image selected from one of seven fields of view for one experiment. (f) Per-gene score Spearman correlations with the 8344A>G allele heteroplasmy. The grey dots show values for a permutation. Pseudo bulk chromatin accessibility track plots are shown for the (g) NR2F2, (h) TRMT5, and (i) SENP5/ NCBP2-AS2 loci. Pseudo-bulk groups were binned based on 0–10% (low), 10–60% (mid), and 60–100% (high) 8344A>G heteroplasmy. (j) Per-mutation heteroplasmy correlation with 8344A>G allele. The 8202T>C mutation is highlighted as the most correlated mutation. (k) Single-cell heteroplasmy for two indicated mutations. The circled population represents a double-positive population for both mutations. (l) Abundances of each variant on single molecule sequencing reads in the double positive population. (m) Schematic of the co-evolution of two subclonal populations marked by indicated mutations detected based on single-cell genotyping data. Putative cell transitions are indicated with solid arrows that may be a result of selective pressure of the pathogenic variant or genetic drift.
Figure 3 -
Figure 3 -. Identification of high-confidence variants and subclonal structure in TF1 cells.
(a) Schematic of mgatk workflow. (b) Identification of high-confidence variants from high strand concordance in paired-end sequencing data and high variance mean ratio (VMR). (c) Unsupervised clustering of TF1 cells using 48 high-quality variants into 12 population clusters. Each column is a cell. Rows show detected mutation. Heatmap color indicates percent heteroplasmy. (d) Phylogenetic reconstruction of clonal TF1 groups. The tree was constructed using neighbor joining; each tip represents a cell cluster from (c).
Figure 4 -
Figure 4 -. Clonal and functional heterogeneity in human malignancies resolved by somatic mtDNA mutations.
(a) Schematic of experimental design. Populations of peripheral blood mononuclear cells (PBMCs) from two CLL patients were separated by FACS or magnetic bead enrichment and profiled with mtscATAC-seq and 10× 5’ scRNA-seq. (b) Fraction of CD19+ cells with major B cell receptor (BCR) clonotype as determined from V(D)J receptor sequencing. (c) Inference of subclonal structure from somatic mtDNA mutations for patient 1. Cells (columns) are clustered based on mitochondrial genotypes (rows). Colors at the top of the heatmap represent clusters or putative subclones. Color bar, heteroplasmy (% allele frequency). (d) Clonotype receptors (columns) associated with somatic mtDNA mutations (rows) from patient 1. Colors at the top of the heatmap represent BCR clonotypes. Color bar, heteroplasmy (% allele frequency). (e) Estimated copy number of chromosome 12 across putative subclones for patient 1. Patient derived cells showed elevated DNA read counts of chromosome 12, consistent with a trisomy for this chromosome (Methods). Boxplots: center line, median; box limits, first and third quartiles; whiskers, 1.5x interquartile range. (f) Sub-clone associations with accessible chromatin. Red dots denote peaks associated at a false-discovery rate of <0.01. (g,h) Examples of subclone-associated differential accessibility peaks near the (g) TIAM1 and (h) ZNF257 promoters. (i) Schematic of scATAC projection framework using latent semantic indexing (LSI) and UMAP. A healthy PBMC reference embedding with indicated cell types is shown. (j) Projection of cells collected from Patient 1 and (k) Patient 2. Colors indicate cells positive for indicated somatic mtDNA mutations. Non-B-cells are highlighted. (l) Gene signature plots of PBMCs from single-cell RNA-seq for Patient 1 corroborating mtDNA mutations in non-B-cells. (m) Schematic showing mtscATAC-seq profiling of a colorectal cancer resection specimen. (n) Two dimensional embedding of all quality controlled tumor derived cells using UMAP showing the distribution of cells based on Louvain clustering and annotation based on marker gene scores as exemplified in panel (o) and Extended Data Fig. 4l. (o) Projection of marker gene scores for indicated genes EPCAM, PTPRC and IL1RL1. Color bar, gene score activity. (p) Inferred CNV profiles for indicated cell types (x axis) and chromosomes. Arrows indicate relative increase of copy numbers in the epithelial tumor cells. Cells from the basophil-like population are shown as a control group of cells. Color bar, z-score transformed fragment abundance. (q) Inference of subclonal structure from somatic mtDNA mutations in colorectal cancer. Epithelial cells (columns) are clustered based on mitochondrial genotypes (rows). Color bar, heteroplasmy (% allele frequency). (r) Putative model of clonal evolution of the profiled colorectal cancer specimen as suggested based on integrated analysis of nuclear CNV and somatic mtDNA mutation profiles.
Figure 5 -
Figure 5 -. Clonal lineage tracing across accessible chromatin landscapes and time in an in vitro model of hematopoiesis.
(a) Schematic of experimental design. Approximately 800 or 500 CD34+ HSPCs were derived from the same donor, expanded, and differentiated in two independent cultures over the course of 20 days as shown. Stars represent timepoints/ populations of cells that were profiled via mtscATAC-seq. (b) Two dimensional embedding of all quality controlled cells using UMAP. Single-cell TF motif deviation scores for indicated factors are shown in color for all cells. (c) Pseudotime trajectories for monocytic and erythroid trajectories are depicted. (d) Identification of high confidence variants derived from both cultures. The number of variants passing both thresholds (dotted lines) is indicated. (e) Changes in heteroplasmy for 175 variants identified from the 500 input culture from day 8 to day 14. Values represent the mean over all single-cells in the library. (f) Increased variability in heteroplasmy shifts for the 500 cell input culture. P-value is reported from a two-sided Kolmogorov–Smirnov test comparing the observed and permuted distributions log fold-changes of heteroplasmy. (g) Comparison of heteroplasmy shifts for the 800 cell input culture. Linear regression indicates that most of the variability in heteroplasmy changes at the late time point (day 20, y-axis) can be explained by the intermediate time point (day 14, x-axis). Colored dots are mutations highlighted in the next panel. (h) Heteroplasmy trajectories for four selected mutations from (g). Values represent the mean over all single-cells in the library for the indicated time point. (i) Three examples of clonal populations marked by indicated mutations identified in the 800 cell input culture that result in erythroid, monocytic, or bipotent lineage outcomes. (j) Systematic identification of clonal outcomes using the late time point (day 20). y-axis depicts the difference between z-score in erythroid and monocytic bias of a single clone. (k) Differences in transcription factor motif activity comparing erythroid-biased and monocytic biased clones at the earliest sampled time point (day 8).
Figure 6 -
Figure 6 -. Cellular population dynamics in native hematopoiesis in vivo resolved by mtDNA mutations.
(a) Schematic of experimental design. CD34+ HSPCs and PBMCs were derived from the same healthy donor at 0 and 3 months, respectively, and processed using mtscATAC-seq. (b,c) Two dimensional embedding of all quality controlled CD34+ cells using (b) UMAP colored by Louvain clustering or (c) by cell cluster annotation using previously published reference data. CLP = common lymphoid progenitor, CMP = common myeloid progenitor, GMP = granulocyte monocyte progenitor, HSC = hematopoietic stem cell, LMPP = lymphoid-primed multipotent progenitors, MEP = megakaryocyte-erythrocyte progenitors, MPP = multipotent progenitor, pDC = plasmacytoid dendritic cells. (d) Two dimensional embedding of all quality controlled PBMCs using UMAP colored by the distribution of cells based on Louvain clustering and annotation using scRNA-seq data derived label transfer (Extended Data Fig. 6a). (e) % heteroplasmy (log10 scale) of mgatk nominated variants and respective allele frequencies in pseudobulk CD34+ HSPC (x axis) and PBMC populations (y axis). Indicated select variants are further highlighted in panels (i-k). (f) Distribution of mgatk nominated mutations along the mitochondrial genome averaged over both populations (pseudobulk). Inner circle, mitochondrial genome; dots, % heteroplasmy of each mutation; outer gray circle, genome coordinates; annotation shows color coded mitochondrial genes. (g) Substitution rate (observed over expected) of mgatk identified heteroplasmic mutations (y-axis) in each class of mononucleotide and trinucleotide change resolved by the heavy (H) and light (L) strand of the mitochondrial genome. (h) Empirical cumulative distribution plots of the number of cells per clone for both HSPCs and PBMCs. The median number of cells per clone n is shown for each of the two populations. (i-k) Specific mutations (top) and cell clones to which they belong (bottom) marking CD34+ cells and PBMCs chromatin accessibility profiles (as in b-d). Number of cells n assigned to the respective clonal groups are shown for the CD34+ HSPC and PBMC cell populations. Color bar, heteroplasmy (% allele frequency). (l) Distribution of heteroplasmy shifts in the CD34+ HSPC over the PBMC cell population. P-value: two-sided Kolmogorov–Smirnov test comparing the observed and permuted distributions log2 fold-changes of clonal abundances. (m) Relative proportion of cells from indicated hematopoietic lineages (y axis) in each clone (x axis) identified in PBMCs. (n,o) Summary statistics of (n) CD34+ HSPC and (o) PBMC association between lineage (cell state) and clone. Adjusted p-values (of lineage association) represent the Benjamini-Hochberg adjusted Chi-squared goodness of fit per clone with at least 10 cells.

References

    1. Stewart JB & Chinnery PF The dynamics of mitochondrial DNA heteroplasmy: implications for human health and disease. Nat. Rev. Genet 16, 530–542 (2015). - PubMed
    1. Shoffner JM & Wallace DC Mitochondrial genetics: principles and practice. Am. J. Hum. Genet 51, 1179–1186 (1992). - PMC - PubMed
    1. Elliott HR, Samuels DC, Eden JA, Relton CL & Chinnery PF Pathogenic mitochondrial DNA mutations are common in the general population. Am. J. Hum. Genet 83, 254–260 (2008). - PMC - PubMed
    1. Morris J et al. Pervasive within-Mitochondrion Single-Nucleotide Variant Heteroplasmy as Revealed by Single-Mitochondrion Sequencing. Cell Rep. 21, 2706–2713 (2017). - PMC - PubMed
    1. Kang E et al. Age-Related Accumulation of Somatic Mitochondrial DNA Mutations in Adult-Derived Human iPSCs. Cell Stem Cell 18, 625–636 (2016). - PubMed

METHODS ONLY REFERENCES

    1. Hu J et al. Isolation and functional characterization of human erythroblasts at distinct stages: implications for understanding of normal and disordered erythropoiesis in vivo. Blood 121, 3246–3253 (2013). - PMC - PubMed
    1. Giani FC et al. Targeted Application of Human Genetic Variation Can Improve Red Blood Cell Production from Stem Cells. Cell Stem Cell 18, 73–78 (2016). - PMC - PubMed
    1. Huang W, Li L, Myers JR & Marth GT ART: a next-generation sequencing read simulator. Bioinformatics 28, 593–594 (2012). - PMC - PubMed
    1. Quinlan AR & Hall IM BEDTools: a flexible suite of utilities for comparing genomic features. Bioinformatics 26, 841–842 (2010). - PMC - PubMed
    1. Lareau CA, Ma S, Duarte FM & Buenrostro JD Inference and effects of barcode multiplets in droplet-based single-cell assays. Nat. Commun 11, 866 (2020). - PMC - PubMed

Publication types

Substances