. 2020 Aug 12;10(1):13581.
doi: 10.1038/s41598-020-70492-2.

Salmonella enterica serovar Typhi exposure elicits ex vivo cell-type-specific epigenetic changes in human gut cells

Affiliations

Salmonella enterica serovar Typhi exposure elicits ex vivo cell-type-specific epigenetic changes in human gut cells

Marcelo B Sztein et al. Sci Rep. .

Erratum in

Abstract

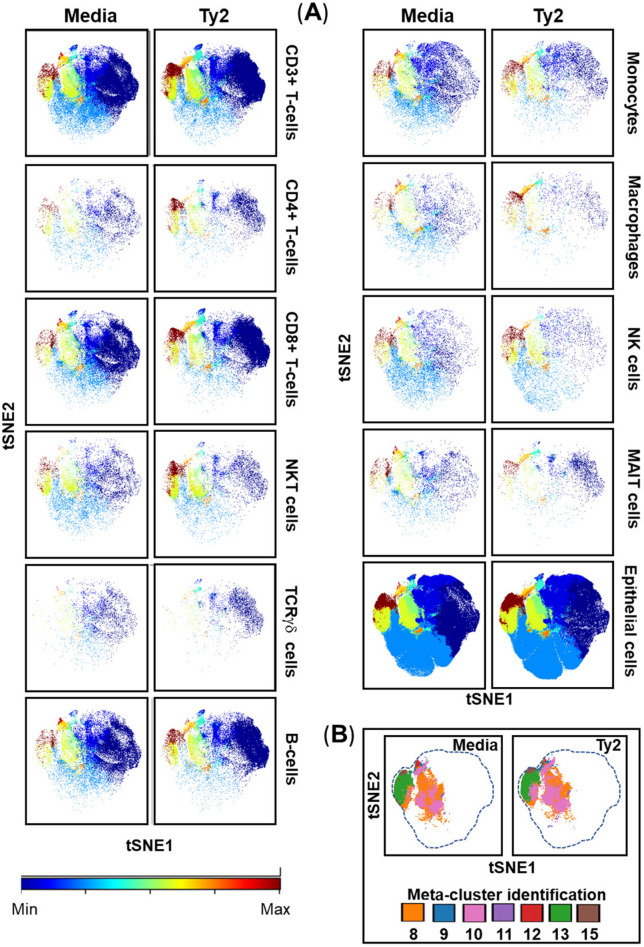
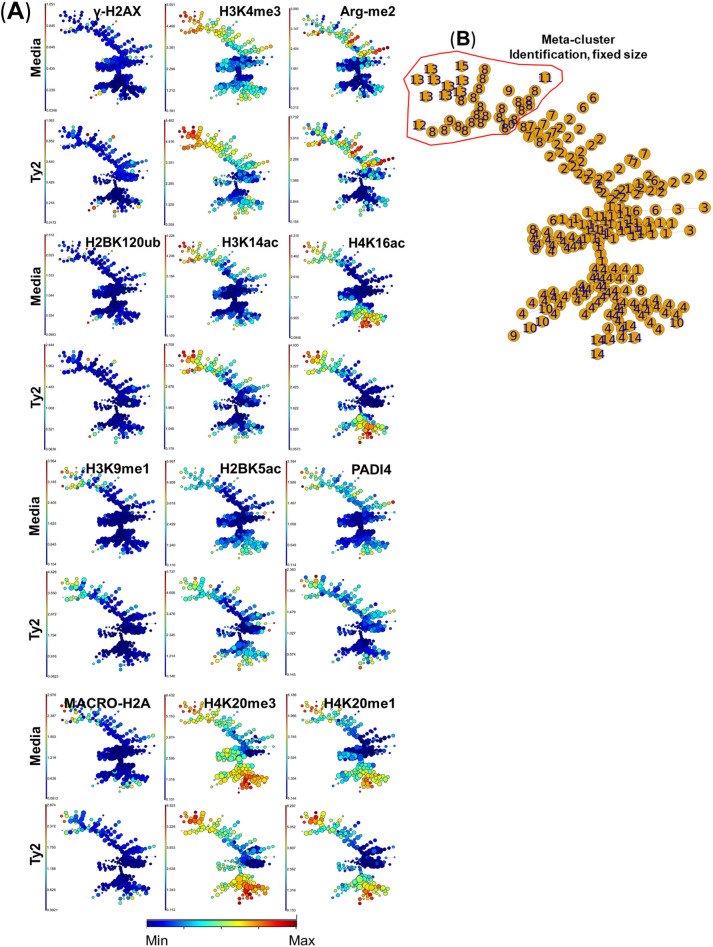
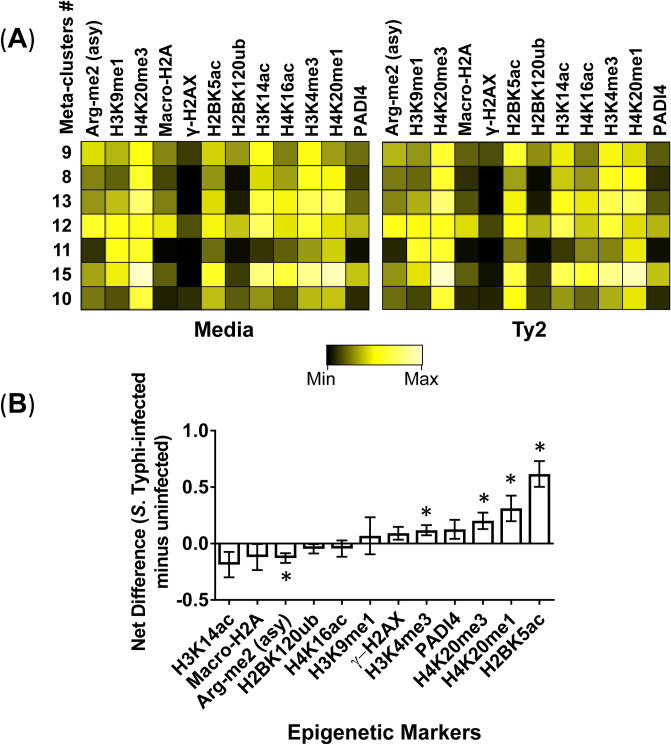
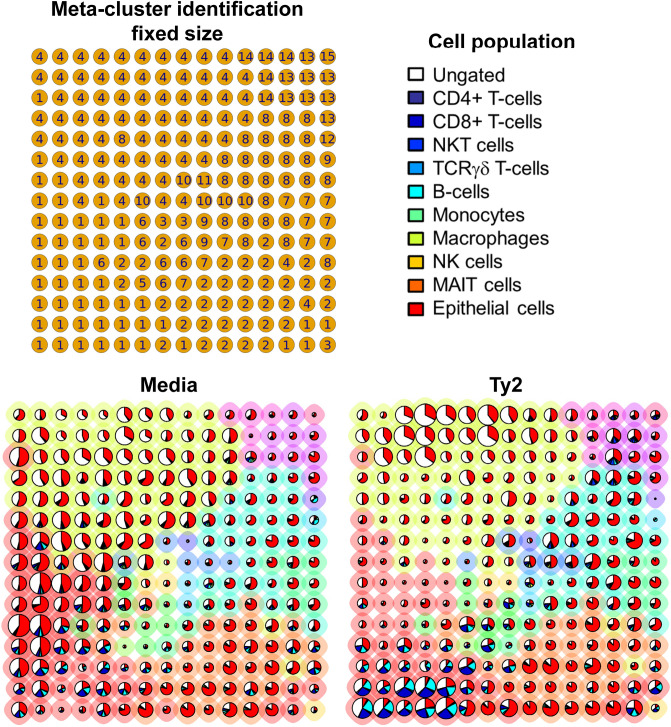
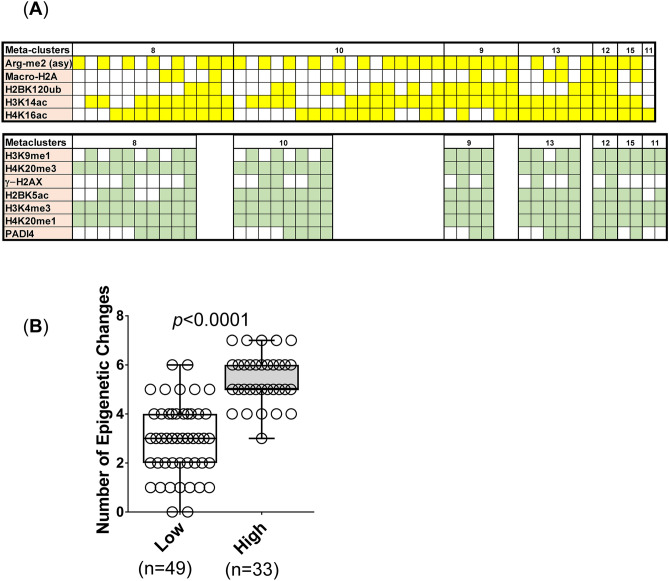
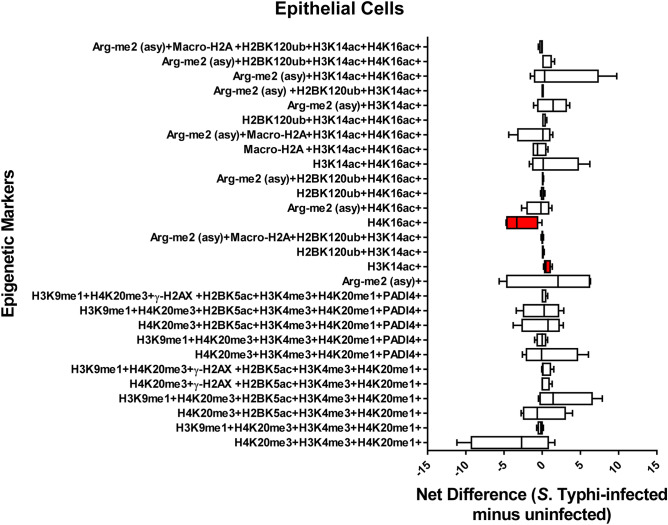
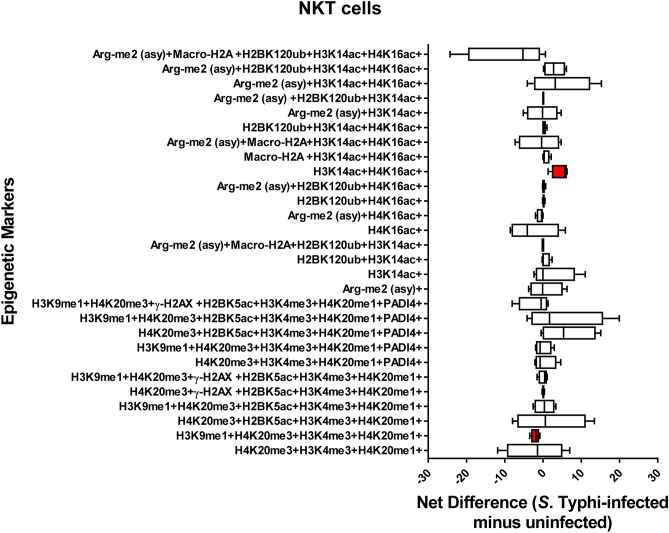
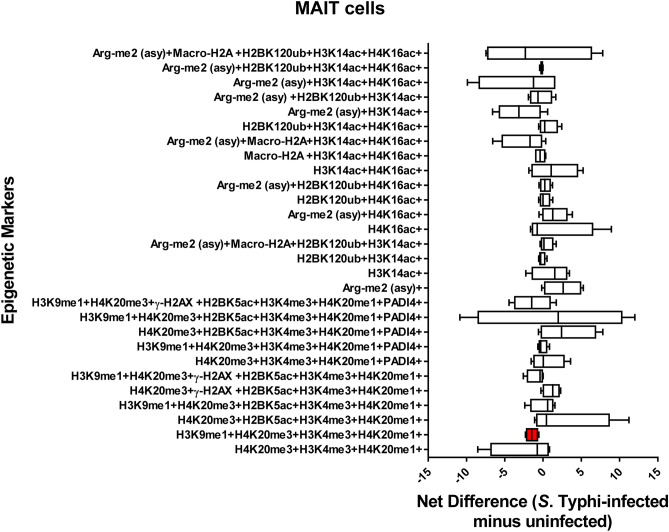
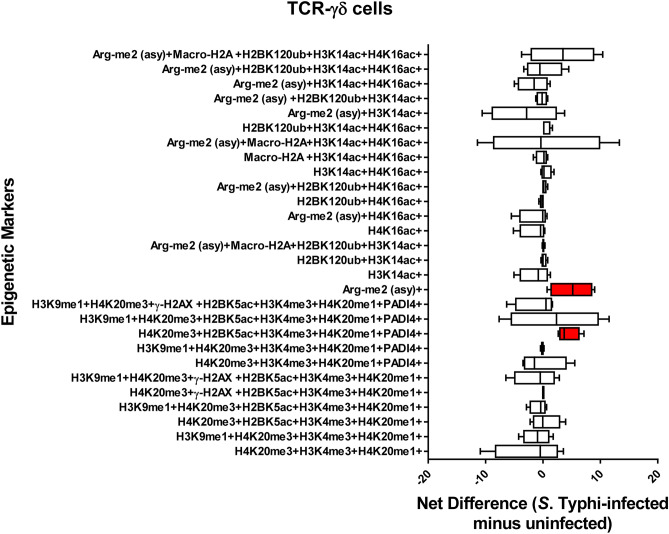
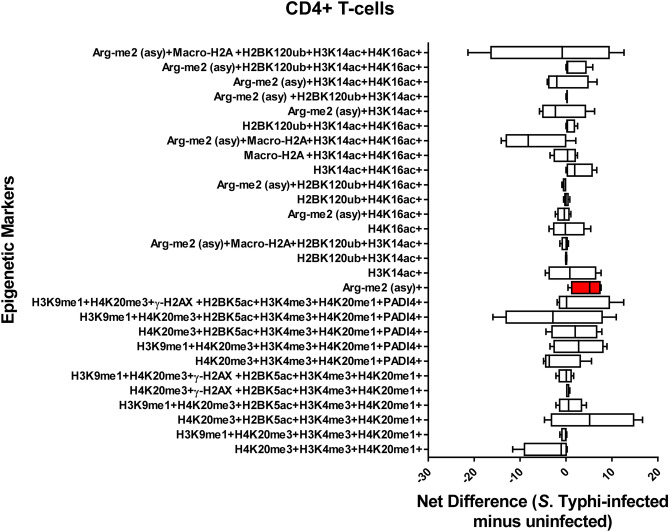
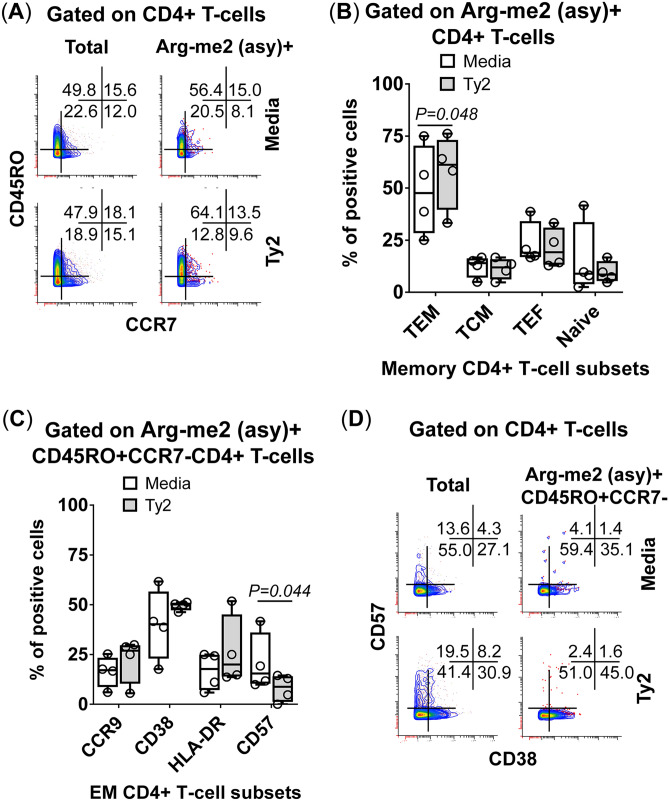
Salmonella enterica serovar Typhi (S. Typhi) causes substantial morbidity and mortality worldwide, particularly among young children. Humans develop an array of mucosal immune responses following S. Typhi infection. Whereas the cellular mechanisms involved in S. Typhi infection have been intensively studied, very little is known about the early chromatin modifications occurring in the human gut microenvironment that influence downstream immune responses. To address this gap in knowledge, cells isolated from human terminal ileum exposed ex vivo to the wild-type S. Typhi strain were stained with a 33-metal-labeled antibody panel for mass cytometry analyses of the early chromatin modifications modulated by S. Typhi. We measured the cellular levels of 6 classes of histone modifications, and 1 histone variant in 11 major cell subsets (i.e., B, CD3 + T, CD4 + T, CD8 + T, NK, TCR-γδ, Mucosal associated invariant (MAIT), and NKT cells as well as monocytes, macrophages, and epithelial cells). We found that arginine methylation might regulate the early-differentiation of effector-memory CD4+ T-cells following exposure to S. Typhi. We also found S. Typhi-induced post-translational modifications in histone methylation and acetylation associated with epithelial cells, NKT, MAIT, TCR-γδ, Monocytes, and CD8 + T-cells that are related to both gene activation and silencing.


Conflict of interest statement

The authors declare no competing interests.

Figures

Figure 1
Figure 1
Unsupervised clustering of epigenetic changes between and within the different mucosal cell subsets after wild-type S. Typhi infections. Cells isolated cells from healthy terminal ileum surgical tissues were exposed to S. Typhi strain Ty2 (Ty2) at 1:100 MOI. Cells cultured with media only were used as controls (media). After 3 h of incubation, cells were stained using a panel of 33 metal-labeled Abs, and the chromatin modifications were analyzed at the single-cell level by mass cytometry. To visualize the clustering of the 11 cell subsets (i.e., B-, CD3+ T-, CD4+ T-, CD8 + T-, NK, TCR-γδ, Mucosal associated invariant (MAIT) and NKT cells, as well as monocytes, macrophages, and epithelial cells), tSNE-defined population distributions and clustering were colored by meta-cluster. (A) t-SNE maps of chromatin modifications. Settings to run the t-SNE algorithm were set-up in Cytobank. (B) Color-coded key showing the location of epigenetic marks meta-clusters. Data are representative of one out of three experiments with terminal ileum segments from 2 different donors, one replicate each.
Figure 2
Figure 2
Unsupervised clustering of epigenetic changes associated with exposure to S. Typhi. Isolated cells from terminal ileum surgical tissues were exposed to S. Typhi strain Ty2 (Ty2) and cultured as described in Fig. 1. Cells cultured with media only were used as controls (media). (A) Using FlowSOM unsupervised clustering, 225 clusters were grouped into 15 meta-clusters of different sizes and organized based on their similarities in high-dimensional space. Settings to run the FlowSOM algorithm were set-up in Cytobank (see Materials and Methods). (B) Meta-cluster identification as observed in trees with nodes of a fixed size. Data are representative of one out of three experiments with terminal ileum segments from 2 different donors, one replicate each.
Figure 3
Figure 3
Chromatin changes elicited by S. Typhi infection. Cells isolated from healthy terminal ileum surgical tissues were exposed to S. Typhi strain Ty2 (Ty2) and cultured as described in Fig. 1. Cells cultured with media only were used as controls (media). (A) Heatmap of unsupervised hierarchical clustering of the 13 markers specific to 6 histone modifications and one histone variant. Heatmap colors represent the relative difference in the transformed ratio of the median detection of the markers, from low (black) to high (bright yellow). Each heatmap uses the same minimum and maximum gradient scale values. These values are calculated automatically in Cytobank and are based on the transformed ratio of the minimum value in the heatmap compared to each data point within the heatmap. The seven meta-clusters showing the greatest changes in the FlowSOM unsupervised clustering were analyzed. (B) The transformed ratio of the median of specific chromatin markers associated with the seven meta-clusters was assembled, and the differences in their detections between uninfected (media) and S. Typhi (Ty2) cultures were evaluated. P-values between uninfected and S. Typhi-infected cultures are from paired Student’s t-tests. P values < 0.05 were considered significant. Bar graphs represent the mean of the pooled data. The whiskers delineate the standard errors. Data are representative of one out of three experiments with terminal ileum segments from 2 different donors, one replicate each.
Figure 4
Figure 4
Meta-cluster maps of mucosal cell subset abundances. Cells isolated from healthy terminal ileum surgical tissues were exposed to S. Typhi strain Ty2 (Ty2) and cultured as described in Fig. 1. Cells cultured with media only were used as controls (media). We used FlowSOM’s built-in pie charts to assess how the FlowSOM meta-clustered data of the 13 markers specific to 6 histone modifications and one histone variant relate to the abundance of the different mucosal cell subsets. The background halo of each pie indicates its meta-cluster assignment, and its associated identification number is shown in the top-left grid. Each pie slice indicates the proportion of the selected manually gated cell population (top-right legend), and the pie size corresponds to the average representation of the population. These data are representative of one out of three experiments with terminal ileum segments from 2 different donors, one replicate each.
Figure 5
Figure 5
Multifunctional patterns of the epigenetic changes in mucosal cells induced by S. Typhi. Cells isolated cells from healthy terminal ileum surgical tissues were exposed to S. Typhi strain Ty2 (Ty2) and cultured as described in Fig. 1. Cells cultured with media only were used as controls (media). (A) Cells were grouped based on the detection levels of the chromatin markers (i.e., top row, decreases [Arg-me2 (asy), Macro-H2A, H2BK120ub, H3K14ac, and H4K16ac]; and bottom row, increases [H3K9me1, H4K20me3, γ-H2AX, H2BK5ac, H3K4me3, H4K20me1, and PADI4]). FCOM analyses were used to evaluate the changes based on the 32 possible combinations for the 5 epigenetic markers in the group showing decreases, and the changes based on the 128 possible combinations for the 7 markers in the group showing increases. Data show all the changes that occurred after Ty2 exposure. (B) Comparison between the number of epigenetic changes between the group showing decreases (low) and the group showing increases (high) in the chromatin marks. P values < 0.05 were considered significant. Bar graphs contain all combinations observed in 8, 10, 9, 13, 12, 15 and 11 meta-clusters in each of the 2 groups. Bar graphs extend from the 25th to 75th percentiles; the line in the middle represents the median of the pooled data. The whiskers delineate the smallest to the largest value. These data are representative of one out of three experiments with terminal ileum segments from 2 different donors, one replicate each.
Figure 6
Figure 6
Chromatin profiles of the epigenetic changes in epithelial cells induced by S. Typhi. Cells isolated cells from healthy terminal ileum surgical tissues were exposed to S. Typhi strain Ty2 (Ty2) and cultured as described in Fig. 1. Cells cultured with media only were used as controls (media). FCOM data of the 28 combinations within the acceptability criteria for changes of the chromatin marks are shown. Bars represent the net difference (S. Typhi-infected minus uninfected cultures). Bar graphs extend from the 25th to 75th percentiles; the line in the middle represents the median of the pooled data. The whiskers delineate the smallest to the largest value. Data are representative of three experiments with terminal ileum segments from 4 different donors, one replicate each. P values < 0.05 were considered significant (red-colored boxes).
Figure 7
Figure 7
Chromatin profiles of the epigenetic changes in NKT cells induced by S. Typhi. Cells isolated cells from healthy terminal ileum surgical tissues were exposed to S. Typhi strain Ty2 (Ty2) and cultured as described in Fig. 1. Cells cultured with media only were used as controls (media). FCOM data of the 28 combinations within the acceptability criteria for changes of the chromatin marks are shown. Bars represent the net difference (S. Typhi-infected minus uninfected cultures). Bar graphs extend from the 25th to 75th percentiles; the line in the middle represents the median of the pooled data. The whiskers delineate the smallest to the largest value. Data are representative of three experiments with terminal ileum segments from 4 different donors, one replicate each. P values < 0.05 were considered significant (red-colored boxes).
Figure 8
Figure 8
Chromatin profiles of the epigenetic changes in MAIT cells induced by S. Typhi. Cells isolated cells from healthy terminal ileum surgical tissues were exposed to S. Typhi strain Ty2 (Ty2) and cultured as described in Fig. 1. Cells cultured with media only were used as controls (media). FCOM data of the 28 combinations within the acceptability criteria for changes of the chromatin marks are shown. Bars represent the net difference (S. Typhi-infected minus uninfected cultures). Bar graphs extend from the 25th to 75th percentiles; the line in the middle represents the median of the pooled data. The whiskers delineate the smallest to the largest value. Data are representative of three experiments with terminal ileum segments from 4 different donors, one replicate each. P values < 0.05 were considered significant (red-colored box).
Figure 9
Figure 9
Chromatin profiles of the epigenetic changes in TCR-γδ cells induced by S. Typhi. Cells isolated cells from healthy terminal ileum surgical tissues were exposed to S. Typhi strain Ty2 (Ty2) and cultured as described in Fig. 1. Cells cultured with media only were used as controls (media). FCOM data of the 28 combinations within the acceptability criteria for changes of the chromatin marks are shown. Bars represent the net difference (S. Typhi-infected minus uninfected cultures). Bar graphs extend from the 25th to 75th percentiles; the line in the middle represents the median of the pooled data. The whiskers delineate the smallest to the largest value. Data are representative of three experiments with terminal ileum segments from 4 different donors, one replicate each. P values < 0.05 were considered significant (red-colored boxes).
Figure 10
Figure 10
Chromatin profiles of the epigenetic changes CD4 + T-cells induced by S. Typhi. Cells isolated cells from healthy terminal ileum surgical tissues were exposed to S. Typhi strain Ty2 (Ty2) and cultured as described in Fig. 1. Cells cultured with media only were used as controls (media). FCOM data of the 28 combinations within the acceptability criteria for changes of the chromatin marks are shown. Bars represent the net difference (S. Typhi-infected minus uninfected cultures). Bar graphs extend from the 25th to 75th percentiles; the line in the middle represents the median of the pooled data. The whiskers delineate the smallest to the largest value. Data are representative of three experiments with terminal ileum segments from 4 different donors, one replicate each. P values < 0.05 were considered significant (red-colored box).
Figure 11
Figure 11
Phenotype of Arg-me2 (asy) + CD4+ T-cells induced by S. Typhi. Detection of Arg-me2 (asy) + in CD4+  T-cells and association with functionality as measured by mass cytometric analyses of (A) memory markers: effector memory (TEM, CD45RO + CCR7-), central memory (TCM, CD45RO + CCR7 +), effector (TEF, CD45RO-CCR7-), and naïve (CD45RO-CCR7 +) populations. (B) Bars represent the mean expression of the TEM, TCM, TEF and naïve in S. Typhi-infected (gray bars) and uninfected (open bars) cultures in the 4 volunteers. (C) Expression of homing (CCR9 +), activation (CD38 + and HLA-DR +), and maturation (CD57 +) markers in S. Typhi-infected (gray bars) and uninfected (open bars) cultures in the 4 volunteers. (D) CD57 and CD38 expression on Arg-me2 (asy) + CD45RO + CCR7-CD4 + T-cells in a representative volunteer. Bar graphs (B, C) extend from the 25th to 75th percentiles; the line in the middle represents the median of the pooled data. The whiskers delineate the smallest to the largest value. Data are representative of three experiments with terminal ileum segments from 4 different donors, one replicate each. P values < 0.05 were considered significant.

References

    1. Levine, M. M. in Plotkin's vaccines (eds S A Plotkin, W A Oreinstein, P A Offit, & K M Edwards) Ch. 61, 1114–1144 (Elsevier, 2018).
    1. Sztein MB. Is a human CD8 T-cell vaccine possible, and if so, what would it take? CD8 T-cell-mediated protective immunity and vaccination against enteric bacteria. Cold Spring Harbor Perspect. Biol. 2018;10:a028910. doi: 10.1101/cshperspect.a029546. - DOI - PMC - PubMed
    1. Sztein MB, Salerno-Goncalves R, McArthur MA. Complex adaptive immunity to enteric fevers in humans: lessons learned and the path forward. Front. Immunol. 2014;5:516. doi: 10.3389/fimmu.2014.00516. - DOI - PMC - PubMed
    1. Mastroeni P, Grant A. Dynamics of spread of Salmonella enterica in the systemic compartment. Microbes Infect. 2013;15:849–857. doi: 10.1016/j.micinf.2013.10.003. - DOI - PubMed
    1. Dougan G, John V, Palmer S, Mastroeni P. Immunity to salmonellosis. Immunol Rev. 2011;240:196–210. doi: 10.1111/j.1600-065X.2010.00999.x. - DOI - PubMed

Publication types

MeSH terms