. 2020 Aug;584(7822):624-629.
doi: 10.1038/s41586-020-2611-3. Epub 2020 Aug 12.

cDC1 prime and are licensed by CD4+ T cells to induce anti-tumour immunity

Affiliations

cDC1 prime and are licensed by CD4+ T cells to induce anti-tumour immunity

Stephen T Ferris et al. Nature. 2020 Aug.

Abstract

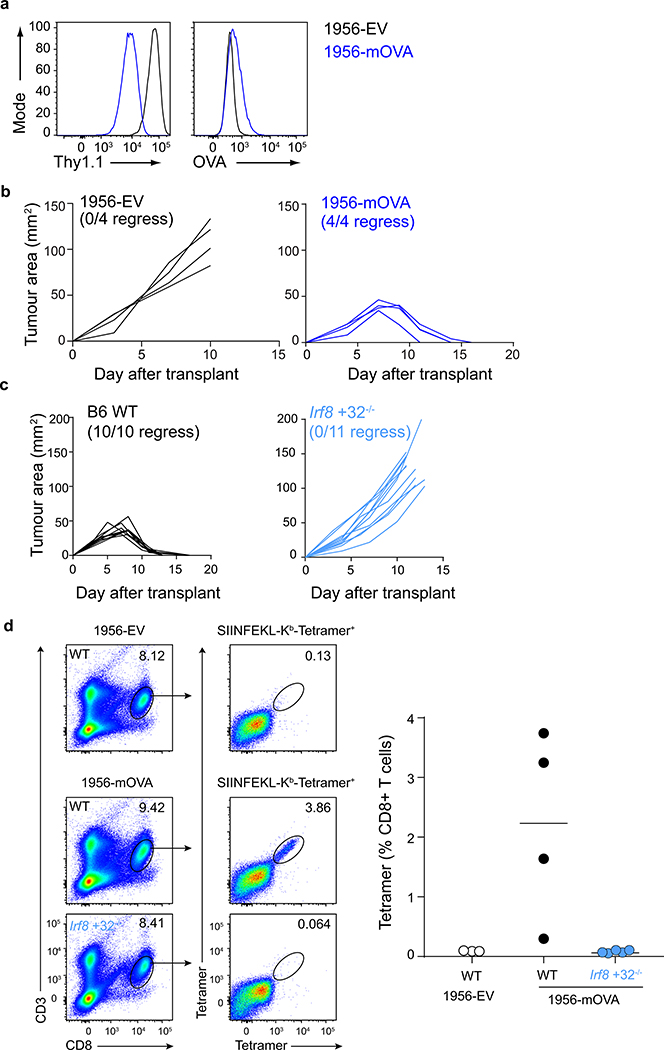
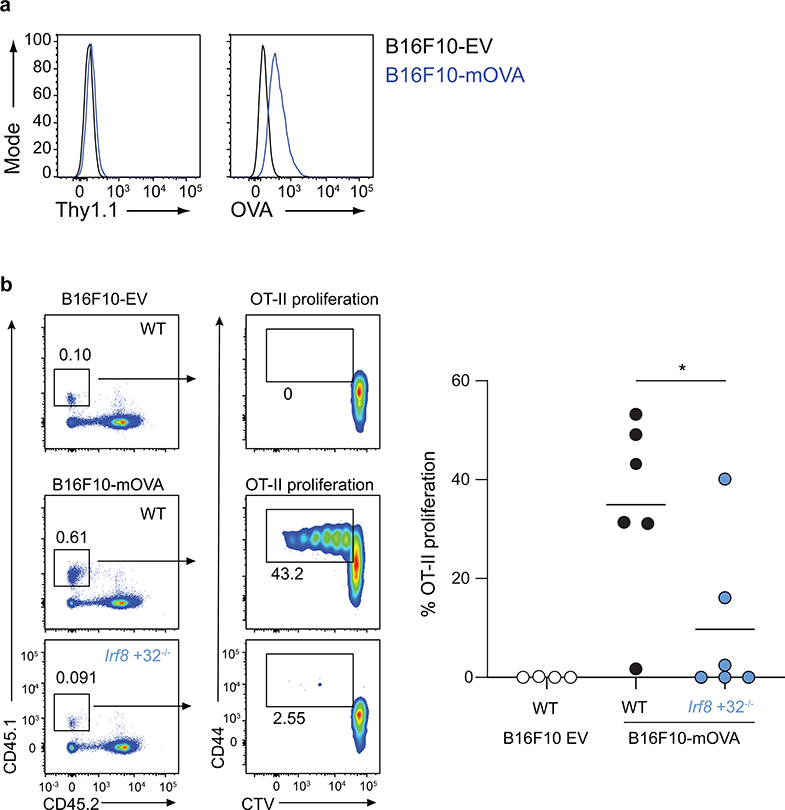
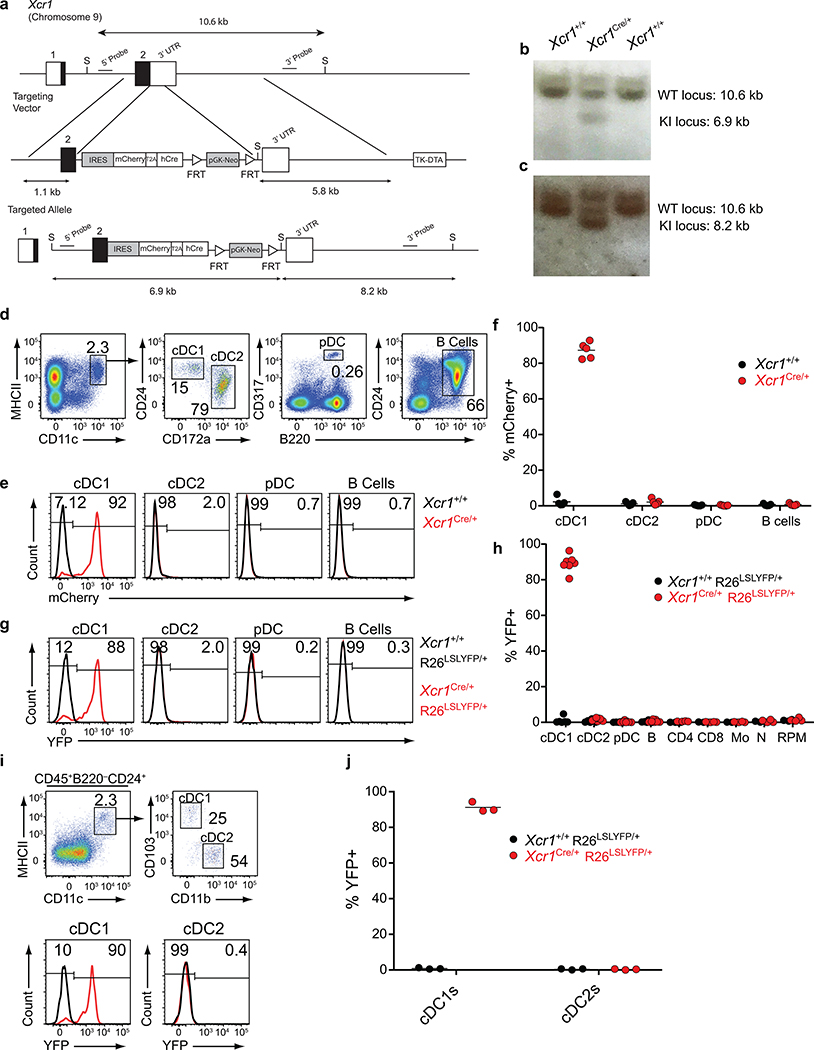
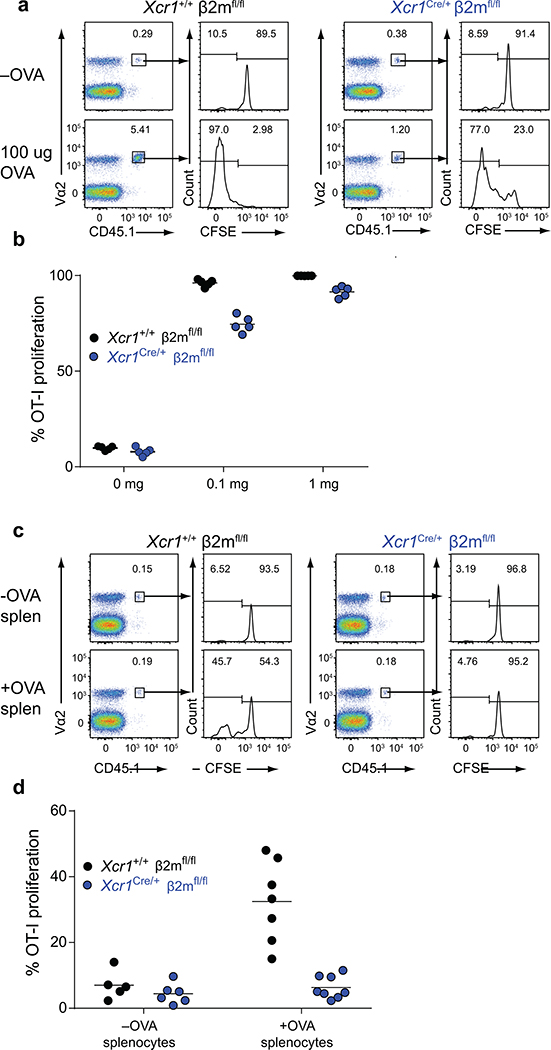
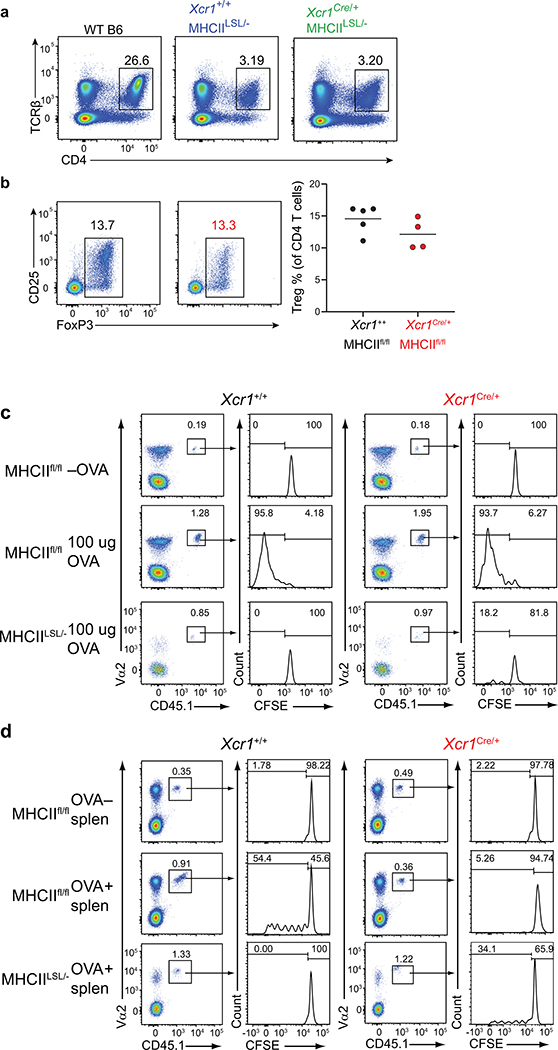
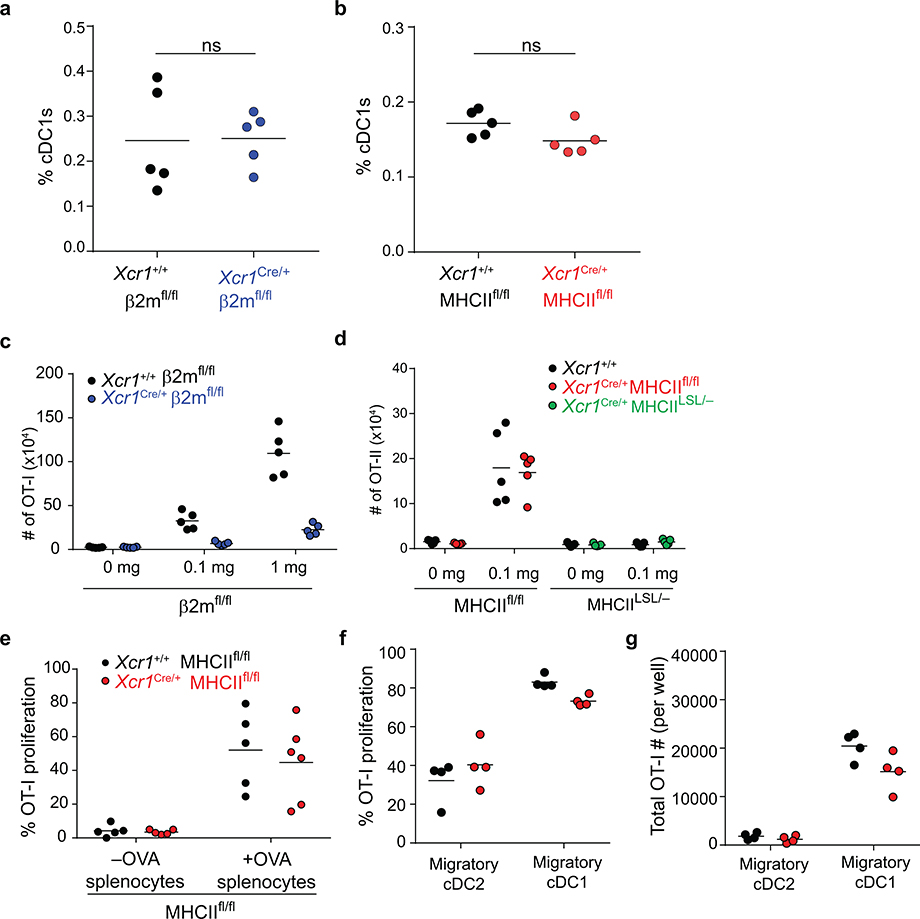
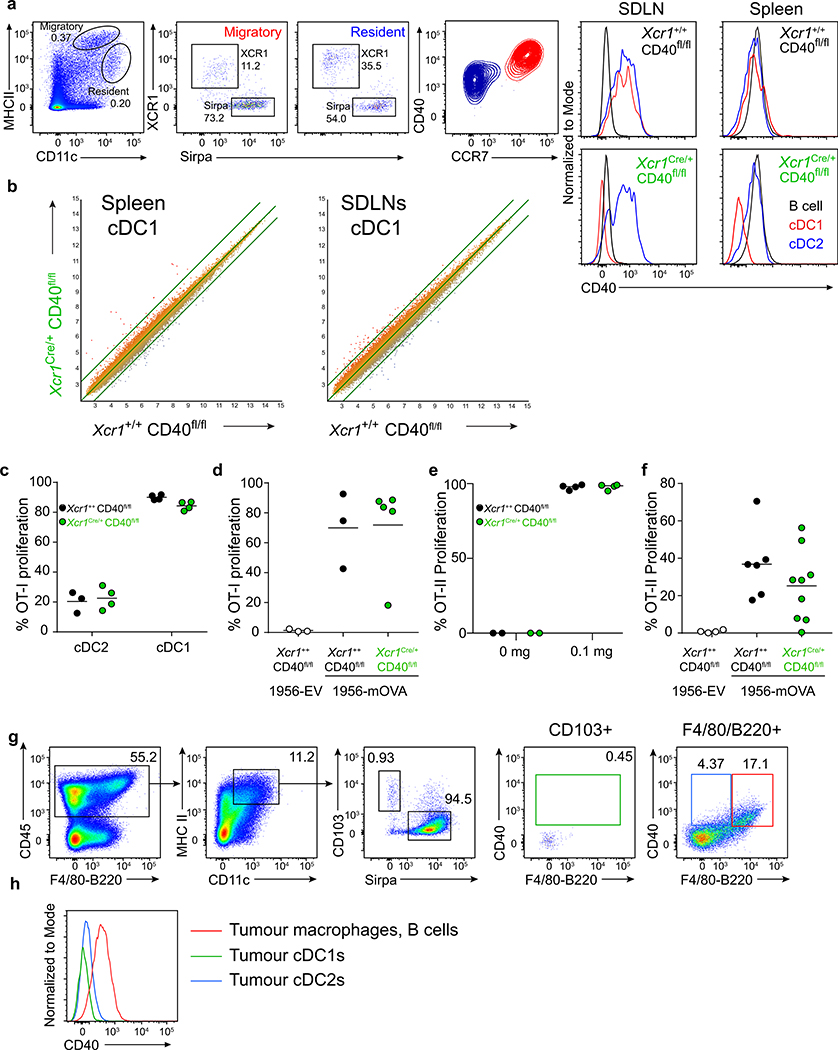
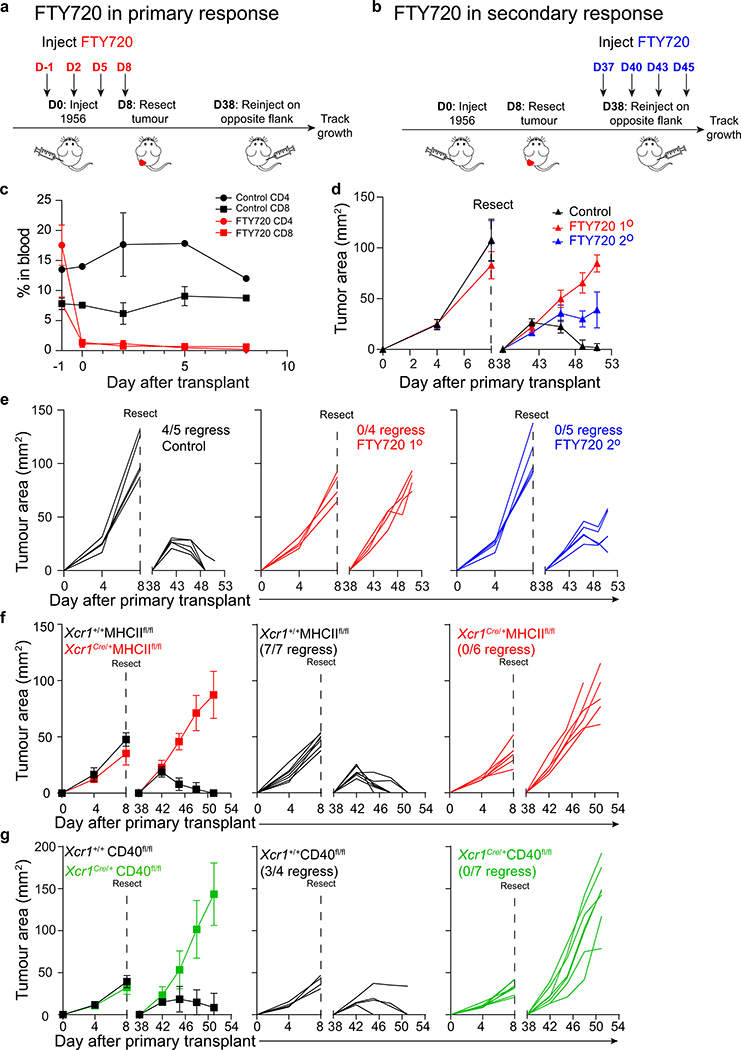
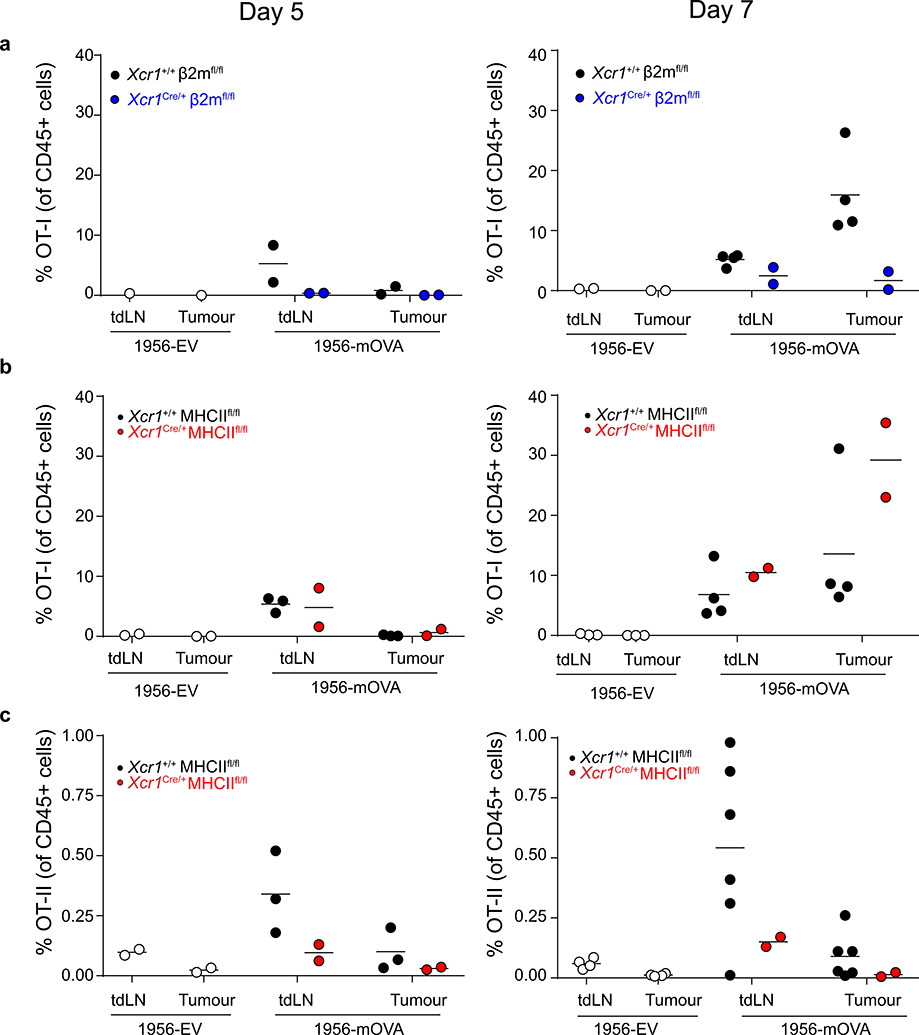
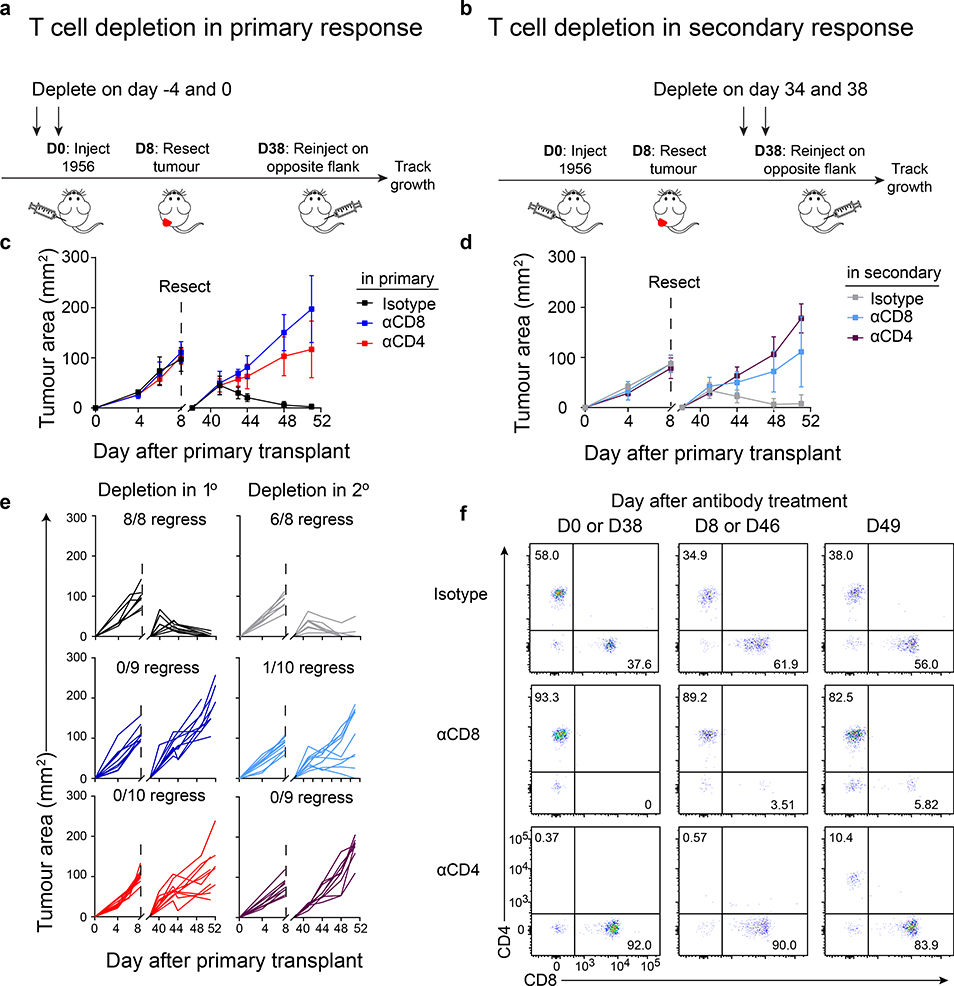
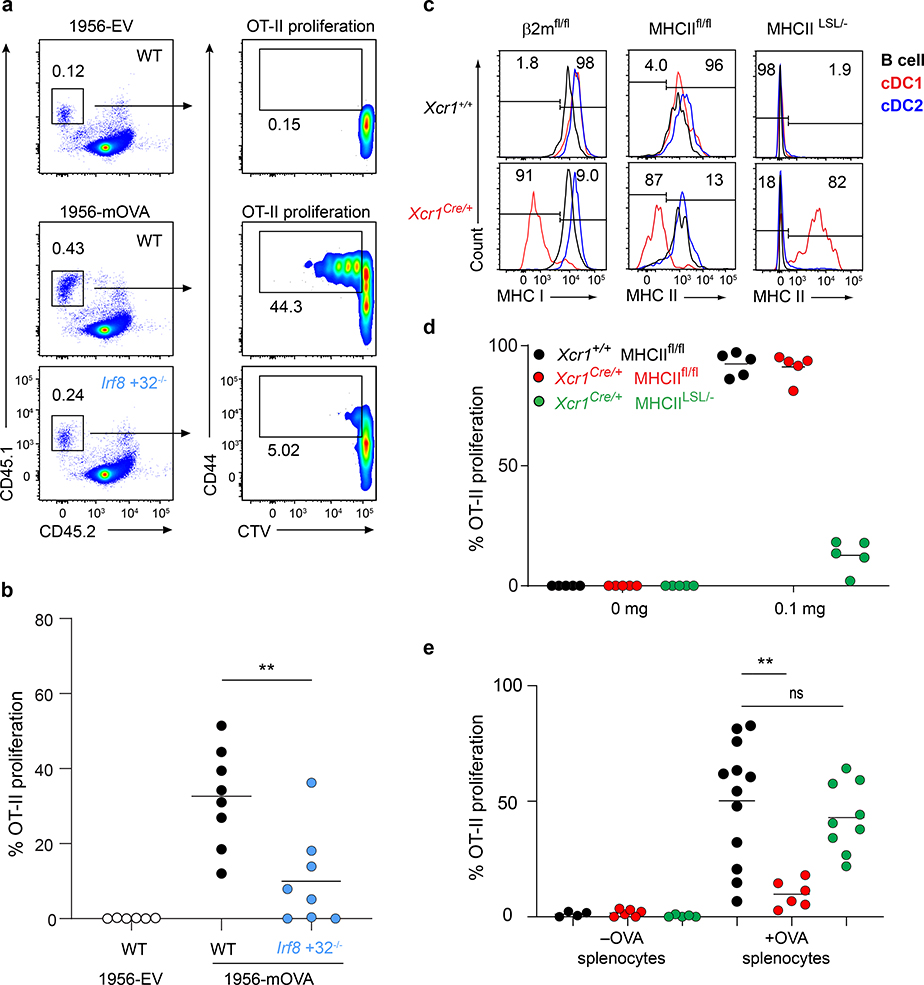
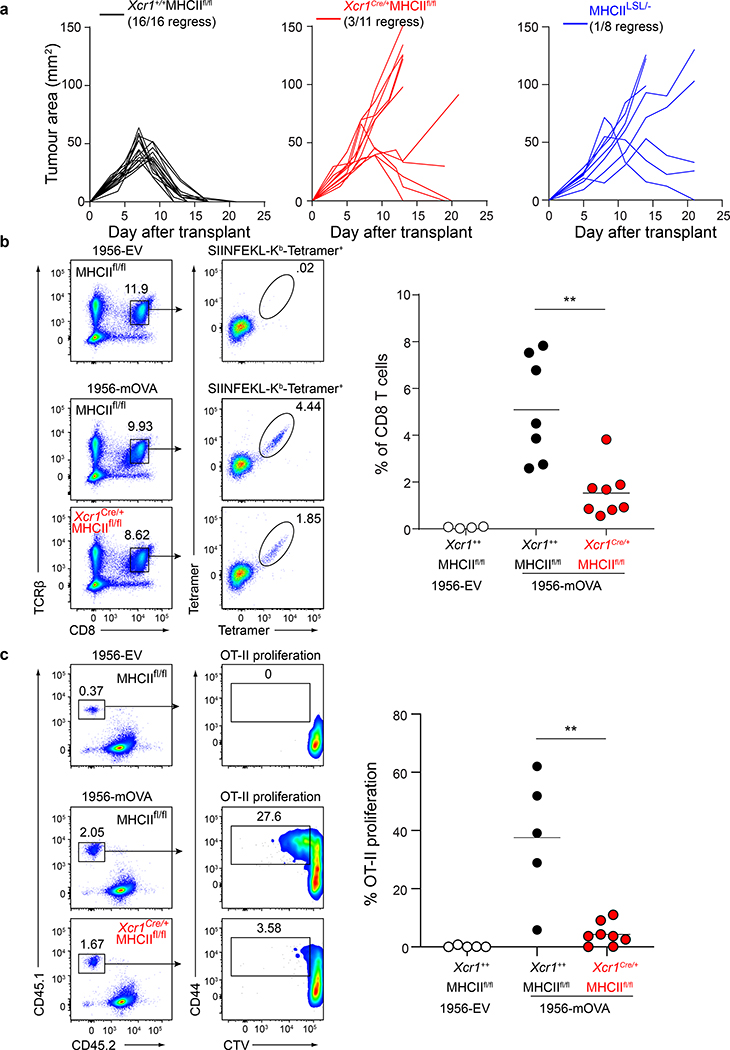
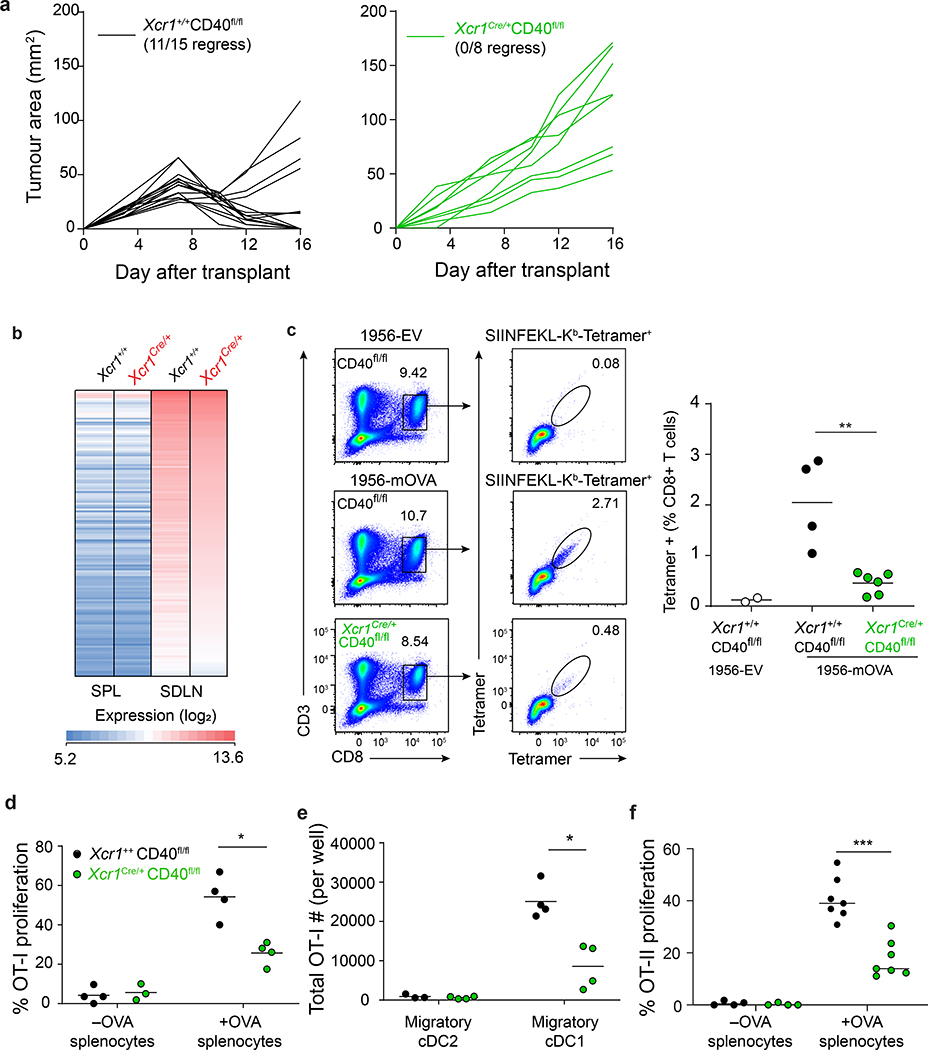
Conventional type 1 dendritic cells (cDC1)1 are thought to perform antigen cross-presentation, which is required to prime CD8+ T cells2,3, whereas cDC2 are specialized for priming CD4+ T cells4,5. CD4+ T cells are also considered to help CD8+ T cell responses through a variety of mechanisms6-11, including a process whereby CD4+ T cells 'license' cDC1 for CD8+ T cell priming12. However, this model has not been directly tested in vivo or in the setting of help-dependent tumour rejection. Here we generated an Xcr1Cre mouse strain to evaluate the cellular interactions that mediate tumour rejection in a model requiring CD4+ and CD8+ T cells. As expected, tumour rejection required cDC1 and CD8+ T cell priming required the expression of major histocompatibility class I molecules by cDC1. Unexpectedly, early priming of CD4+ T cells against tumour-derived antigens also required cDC1, and this was not simply because they transport antigens to lymph nodes for processing by cDC2, as selective deletion of major histocompatibility class II molecules in cDC1 also prevented early CD4+ T cell priming. Furthermore, deletion of either major histocompatibility class II or CD40 in cDC1 impaired tumour rejection, consistent with a role for cognate CD4+ T cell interactions and CD40 signalling in cDC1 licensing. Finally, CD40 signalling in cDC1 was critical not only for CD8+ T cell priming, but also for initial CD4+ T cell activation. Thus, in the setting of tumour-derived antigens, cDC1 function as an autonomous platform capable of antigen processing and priming for both CD4+ and CD8+ T cells and of the direct orchestration of their cross-talk that is required for optimal anti-tumour immunity.


Figures

Extended Data Figure 1.
Extended Data Figure 1.. cDC1 are required to prime CD4 T cells during the tumour immune response.
a, 1956-EV and 1956-mOVA were stained with antibodies against (left) Thy1.1 and (right) OVA. b, Tumour growth curves of B6 WT mice injected with 106 (left)1956-EV or (right)1956-mOVA. c, Tumour growth curves of (left) B6 WT or (right) Irf8 +32−/− mice injected with 106 1956-mOVA. d, B6 WT or Irf8 +32−/− mice were subcutaneously injected with 106 1956-EV or 106 1956-mOVA. Spleens were isolated and stained for presence of SIINFEKL-Kb-tetramer+ CD8 T cells. (Left) Representative flow plots of percentage of tetramer+ CD8 T cells. (Right) Graph of tetramer+ CD8 T cells as a percentage of all T cells. Data are pooled biologically independent samples from two independent experiments (n=3 for WT EV, n=4 for WT 1956-mOVA, n=5 for Irf8 +32−/− 1956-mOVA).
Extended Data Figure 2.
Extended Data Figure 2.. cDC1 are required to prime CD4 T cells during the immune response to B16F10 melanoma.
a, B16F10-EV and B16F10-mOVA were stained with antibodies against (left) Thy1.1 and (right) OVA. b, B6 WT or Irf8 +32−/− mice were subcutaneously injected with 106 B16F10-EV or 106 B16F10-mOVA. (Left) Representative flow plots of OT-II T cells 3 days after transfer. (Right) Graph of percent proliferated OT-II transferred. Data are pooled biologically independent samples from two independent experiments (n=4 for WT B16F10-EV, n=6 for all other groups).* p=0.04 (unpaired, two-tailed Mann-Whitney test).
Extended Data Figure 3.
Extended Data Figure 3.. Validation of mCherry expression and lineage tracing of Xcr1Cre mouse.
a, Schematic diagrams of the mouse Xcr1 WT allele, the targeting vector (IRES-mCherry-T2a-hCRE with FRT flanked pGK-Neo cassettes), and the targeted allele. Filled and open boxes denote coding and noncoding exons of Xcr1, respectively. b, Southern blot analysis of Xcr1+/+ and Xcr1Cre/+. Genomic DNAs were isolated from mice tails, digested with SalI, electrophoresed, and hybridized with the 5’ radiolabeled probe indicated in a. Southern blot gave a 10.6 and a 6.9 kbp band for WT and targeted allele, respectively. For southern blot source data, see Supplementary Figure 1. c, Southern blot analysis of Xcr1+/+ and Xcr1Cre/+. Genomic DNAs were isolated from mice tails, digested with SalI, electrophoresed, and hybridized with the 3’ radiolabeled probe indicated in a. Southern blot gave a 10.6 and a 8.2 kbp band for WT and targeted allele, respectively. For southern blot source data, see Supplementary Figure 1. d, Gating strategy to delineate splenic cell populations. e, FACs histograms of mCherry expression from subpopulations in d isolated from Xcr1Cre/+ and Xcr1+/+ mice. f, Graph of mCherry expression in APC populations gated from d isolated from Xcr1Cre/+ and Xcr1+/+ mice. Data are pooled biologically independent samples from two independent experiments (n=5 in all groups). g, FACs histograms for YFP expression from subpopulations in d isolated from Xcr1Cre/+ R26LSLYFP/+ and Xcr1+/+ R26LSLYFP/+ mice. h, Graph of YFP expression in splenic cell populations (Mo, monocytes; N, neutrophils; RPM, red pulp macrophages). Data are pooled biologically independent samples from two independent experiments (n=6 for cDC1s, cDC2s, pDCs, and B cells from Xcr1+/+ R26LSLYFP/+ mice, n= 7 for cDC1s, cDC2s, pDCs, and B cells from Xcr1Cre/+ R26LSLYFP/+ mice, and n=4 for all other groups). i, (Top) Gating strategy to delineate SDLN cell populations. (Bottom) FACs histograms for YFP expression in cDC1 and cDC2 isolated from Xcr1Cre/+ R26LSLYFP/+ and Xcr1+/+ R26LSLYFP/+ mice. j, Graph of YFP expression from subpopulations in i isolated from Xcr1Cre/+ R26LSLYFP/+ and Xcr1+/+ R26LSLYFP/+ mice. Data are pooled biologically independent samples from two independent experiments (n=3 in all groups).
Extended Data Figure 4.
Extended Data Figure 4.. Proliferation of OT-I in Xcr1Cre/+ β2mfl/fl mice receiving soluble or cell-associated OVA.
a, Representative FACs analysis and histograms of CFSE dilution of proliferated OT-I on day 3 after transfer into (left) Xcr1+/+ β2mfl/fl and (right) Xcr1Cre/+ β2mfl/fl immunized with soluble OVA. b, Graph of percent proliferation of transferred OT-I in mice immunized with soluble OVA. Data are pooled biologically independent samples from two independent experiments (n=5 for all groups). c, Representative FACs analysis and histograms of CFSE dilution of proliferated OT-I on day 3 after transfer into (left) Xcr1+/+ β2mfl/fl and (right) Xcr1Cre/+ β2mfl/fl immunized with cell-associated OVA. d, Graph of percent proliferation of transferred OT-I in mice immunized with cell-associated OVA. Data are pooled biologically independent samples from two independent experiments (n=5 Xcr1+/+ β2mfl/fl –OVA, n=6 for Xcr1Cre/+ β2mfl/fl +OVA, n=7 for Xcr1+/+ β2mfl/fl +OVA, and n=8 for Xcr1Cre/+ β2mfl/fl +OVA).
Extended data Figure 5.
Extended data Figure 5.. Proliferation of OT-II in Xcr1Cre /+ MHCIIfl/fl and Xcr1Cre /+ MHCIILSL/- mice immunized with soluble and cell-associated OVA.
a, Representative FACS analysis of splenic CD4 T cell percentage in WT B6, Xcr1+/+ MHCIILSL/-, and Xcr1Cre/+ MHCIILSL/- mice at steady state. b, (Left) Representative FACS analysis of splenic Treg percentage in Xcr1+/+ MHCIIfl/fl and Xcr1Cre/+ MHCIIfl/fl at steady state. (Right) Graph of splenic Treg percentage as a percentage of all CD4 T cells. Data are pooled biologically independent samples from two independent experiments (n=5 for Xcr1+/+ MHCIIfl/fl, n=4 for Xcr1Cre/+ MHCIIfl/fl). c, Representative FACs analysis and histograms of CFSE dilution of proliferated OT-II on day 3 after transfer into Xcr1+/+ MHCIIfl/fl, Xcr1Cre/+ MHCIIfl/fl, and Xcr1Cre/+ MHCIILSL/- immunized with soluble OVA. d, Representative FACs analysis and histograms of CFSE dilution of proliferated OT-II on day 3 after transfer into Xcr1+/+ MHCIIfl/fl, Xcr1Cre/+ MHCIIfl/fl, and Xcr1Cre/+ MHCIILSL/- immunized with cell-associated OVA.
Extended Data Figure 6.
Extended Data Figure 6.. Analysis of cDC1 in conditionally deleted mice.
a, Graph of splenic cDC1 percentage in Xcr1+/+ β2mfl/fl and Xcr1Cre/+ β2mfl/fl. Data are pooled biologically independent samples from two independent experiments (n=5 for all groups). p=ns (unpaired, two-tailed Mann-Whitney test). b, Graph of splenic cDC1 percentage in Xcr1+/+ MHCIIfl/fl and Xcr1Cre/+ MHCIIfl/fl. Data are pooled biologically independent samples from two independent experiments (n=5 for all groups). p=ns (unpaired, two-tailed Mann-Whitney test). c, Graph of absolute numbers of transferred OT-I in soluble OVA treated Xcr1+/+ β2mfl/fl and Xcr1Cre/+ β2mfl/fl mice. Data are pooled biologically independent samples from two independent experiments (n=5 for all groups). d, Graph of absolute numbers of transferred OT-II in soluble OVA treated Xcr1+/+ MHCIIfl/fl and Xcr1Cre/+ MHCIIfl/fl mice. Data are pooled biologically independent samples from two independent experiments (n=5 for all groups). e, Graph of percent proliferated OT-I in cell-associated treated Xcr1+/+ MHCIIfl/fl and Xcr1Cre/+ MHCIIfl/fl mice. Data are pooled biologically independent samples from two independent experiments (n=6 for Xcr1Cre/+ MHCIIfl/fl OVA- and OVA+ and n =5 for all other groups). f, Graph of percent proliferation of OT-I after 72 h coculture with ex vivo migratory cDC2 or cDC1 harvested from tumour-draining lymph nodes of Xcr1+/+ MHCIIfl/fl or Xcr1Cre/+ MHCIIfl/fl mice injected 6 days earlier with 106 1956-mOVA cells. Cells were cultured at a ratio of 10:1 naïve OT-I: cDCs. Data are pooled independent samples from two independent experiments (n=4 for all groups). g, Graph of absolute number of proliferated OT-I per well after 72 h coculture with ex vivo migratory cDC2 or cDC1 harvested from tumour-draining lymph nodes of Xcr1+/+ MHCIIfl/fl, Xcr1Cre/+ MHCIIfl/fl mice six days after injection with 106 1956-mOVA. Cells were cultured at 10:1 ratio of naïve OT-I:cDC. Data are pooled independent samples from two independent experiments (n=4 for all groups).
Extended Data Figure 7.
Extended Data Figure 7.. CD40 deficiency does not affect cDC1 development.
a, SDLN flow cytometry gating for cDC1 expression of CD40. Migratory cDC1 (CD11cint MHCIIhi; Red) were overlaid for expression with resident cDC1 (CD11chi MHCIIint; Blue). (Top) Xcr1+/+ CD40fl/fl and (bottom) Xcr1Cre/+ CD40fl/fl SDLN and splenic APCs stained for CD40 expression. b, Gene expression data from Xcr1+/+ CD40fl/fl and Xcr1Cre/+ CD40fl/fl cDC1 from spleens and SDLN. Green lines indicate 2-fold changes. c, Graph of percent proliferation of OT-I after 72 h coculture with ex vivo migratory cDC2 or cDC1 harvested from tumour-draining lymph nodes of Xcr1+/+ CD40fl/fl or Xcr1Cre/+ CD40fl/fl mice injected 6 days earlier with 106 1956-mOVA cells. Cells were cultured at a ratio of 10:1 naïve OT-I: cDCs. Data are pooled independent samples from two independent experiments (n=3 for Xcr1+/+ CD40fl/fl cDC2s and n=4 for all other groups). d, Graph of percent proliferation of OT-I in tumour-draining lymph node of tumour-bearing mice 3 days after transfer. Xcr1+/+ CD40fl/fl and Xcr1Cre/+ CD40fl/fl mice were injected with 106 1956-EV or 106 1956-mOVA. Data are pooled independent samples from two independent experiments (n=5 for Xcr1Cre/+ CD40fl/fl1956-mOVA, n=3 for all other groups). e, Graph of percent proliferation of transferred OT-II in soluble OVA treated Xcr1+/+ CD40fl/fl and Xcr1Cre/+ CD40fl/fl mice. Data are pooled biologically independent samples from two independent experiments (n=2 for 0 mg Xcr1+/+ CD40fl/fl and Xcr1Cre/+ CD40fl/fl and n=4 for all other groups). f, Graph of percent proliferation of OT-II in tumour-draining lymph node of tumour-bearing mice 3 days after transfer. Xcr1+/+ CD40fl/fl and Xcr1Cre/+ CD40fl/fl mice were injected with 106 1956-EV or 106 1956-mOVA. Data are pooled biologically independent samples from three independent experiments (n=4 for 1956-EV, n=6 for 1956-mOVA Xcr1+/+ CD40fl/fl, and n=9 for 1956-mOVA Xcr1Cre/+ CD40fl/fl). g, Gating strategy to delineate day 6 1956-mOVA tumour immune cell APC populations. h, FACs histogram of CD40 expression on gated APC populations from e.
Extended Data Figure 8.
Extended Data Figure 8.. T cells are required at tumour site to induce memory.
a, Schematic of FTY720 injection during primary tumour response. b, Schematic of FTY720 injection during secondary tumour response. c, Peripheral blood CD4+ and CD8+ T cell percentage in control and FTY720 treated mice. Data represent mean ± S.D. pooled biologically independent samples from two independent experiments (n=2 control, n=5 FTY720). d, Tumour growth curves of mice injected with FTY720 during the primary or secondary 1956 tumour implantation. Data represent mean ± S.D. pooled biologically independent samples from two independent experiments (n=4 for FTY720 1º and n=5 for all other groups). e, Individual mouse tumour growth curves of control or FTY720 injected mice. f, (Left) Tumour growth curves of Xcr1+/+ MHCIIfl/fl and Xcr1Cre/+ MHCIIfl/fl mice during primary and secondary 1956 tumour implantation. Individual mouse tumour growth curves of (middle) Xcr1+/+ MHCIIfl/fl or (right) Xcr1Cre/+ MHCIIfl/fl mice during primary and secondary 1956 tumour implantation. Data represent mean ± S.D. pooled biologically independent samples from two independent experiments (n=7 for Xcr1+/+ MHCIIfl/fl and n=6 for Xcr1Cre/+ MHCIIfl/fl). g, (Left) Tumour growth curves of Xcr1+/+ CD40fl/fl and Xcr1Cre/+ CD40fl/fl mice during primary and secondary 1956 tumour implantation. Individual mouse tumour growth curves of (middle) Xcr1+/+ CD40fl/fl or (right) Xcr1Cre/+ CD40fl/fl mice during primary and secondary 1956 tumour implantation. Data represent mean ± S.D. pooled biologically independent samples from two independent experiments (n=4 for Xcr1+/+ CD40fl/fl and n=7 for Xcr1Cre/+ CD40fl/fl).
Extended Data Figure 9.
Extended Data Figure 9.. OT-II CD4 T cells fail to localize to the tumour in Xcr1Cre/+ MHCIIfl/fl mice.
a, Graph of percent accumulation of transferred OT-I in tumours of Xcr1+/+ β2mfl/fl, Xcr1Cre/+ β2mfl/fl injected with 106 1956-EV or 1956-mOVA on day 0. OT-I cells were transferred intravenously on day 2 and assessed as a percentage of total CD45+ cells on (left) day 5 and (right) day 7. Data represent pooled biologically independent samples from two independent experiments (n=1 for Xcr1+/+ β2mfl/fl tdLN and tumour 1956-EV day 5, n=4 for Xcr1+/+ β2mfl/fl 1956-mOVA tdLN and tumour Day 7 n=2 for all other groups). b, Graph of percent accumulation of transferred OT-I in tumours of Xcr1+/+ MHCIIfl/fl, Xcr1Cre/+ MHCIIfl/fl injected with 106 1956-EV or 1956-mOVA on day 0. OT-I cells were transferred intravenously on day 2 and assessed as a percentage of total CD45+ cells on (left) day 5 and (right) day 7. Data represent pooled biologically independent samples from two independent experiments (n=4 for Xcr1+/+ MHCIIfl/fl tdLN and tumour 1956-mOVA day 7, n=3 for Xcr1+/+ MHCIIfl/fl tdLN and tumour 1956-mOVA day 5 and for Xcr1+/+ MHCIIfl/fl tdLN and tumour 1956-EV Day 7, n=2 for all other samples ). c, Graph of percent accumulation of transferred OT-II in tumours of Xcr1+/+ MHCIIfl/fl, Xcr1Cre/+ MHCIIfl/fl injected with 106 1956-EV or 1956-mOVA on day 0. OT-II cells were transferred intravenously on day 2 and assessed as a percentage of total CD45+ cells on (left) day 5 and (right) day 7. Data represent pooled biologically independent samples from two independent experiments (n=6 for Xcr1+/+ MHCIIfl/fl tdLN and tumour 1956-mOVA day 7, n=4 for Xcr1+/+ MHCIIfl/fl tdLN and tumour 1956-EV Day 7, n=3 for Xcr1+/+ MHCIIfl/fl tdLN and tumour 1956-mOVA day 5, n=2 for all other samples).
Figure 1.
Figure 1.. CD4 T cells are required during primary and secondary tumour responses.
a, Schematic of T cell depletions during primary tumour response. b, Schematic of T cell depletions during secondary tumour response. c, Tumour growth curves of mice depleted of CD4 or CD8 T cells during the primary 1956 tumour implantation. Data represent mean ± S.D. pooled biologically independent samples from two independent experiments (n=8 istotype, n=9 αCD8, n=10 αCD4). d, Tumour growth curves of mice depleted of CD4 or CD8 T cells during the secondary 1956 tumour implantation. Data represent mean ± S.D. pooled biologically independent samples from two independent experiments (n=8 istotype, n=10 αCD8, n=9 αCD4). e, Individual mouse tumour growth curves of CD4 or CD8 T cells depleted in the (left) primary or (right) secondary 1956 tumour implantation. f, Peripheral blood T cell populations after CD4 or CD8 depletion.
Figure 2.
Figure 2.. cDC1 are superior at presenting cell-associated material.
a, Representative flow plots of percent proliferated OT-II transferred into WT B6 and Irf8 +32−/− mice injected with 106 1956-EV or 106 1956-mOVA. b, Graph of percent proliferated OT-II in a. Data are pooled biologically independent samples from three independent experiments (n=6 for WT 1956-EV, n=8 for all other groups). ** p=0.007 (unpaired, two-tailed Mann-Whitney test). c, (Top) Xcr1+/+ and (bottom) Xcr1Cre/+ splenic APCs stained for MHC-I and MHC-II expression from (left) β2mfl/fl, (middle) MHCIIfl/fl, and (right) MHCIILSL/- mice. d, Graph of percent proliferated OT-II transferred into Xcr1+/+ MHCIIfl/fl, Xcr1Cre/+ MHCIIfl/fl, and Xcr1Cre/+ MHCIILSL/- immunized with soluble OVA on day 0. Data are pooled biologically independent samples from two independent experiments (n=5 for all groups). e, Graph of percent proliferated OT-II transferred into Xcr1+/+ MHCIIfl/fl, Xcr1Cre/+ MHCIIfl/fl, and Xcr1Cre/+ MHCIILSL/- immunized with cell-associated OVA on day 0. Data are pooled biologically independent samples from four independent experiments (n=4 for Xcr1+/+ MHCIIfl/fl -OVA, n=6 for Xcr1Cre/+ MHCIIfl/fl -OVA, n= 5 for Xcr1Cre/+ MHCIILSL/- -OVA, n=12 for Xcr1+/+ MHCIIfl/fl +OVA, n=6 for Xcr1Cre/+ MHCIIfl/fl +OVA, n=9 for Xcr1Cre/+ MHCIILSL/- +OVA). ** p=0.002 (unpaired, two-tailed Mann-Whitney test).
Figure 3.
Figure 3.. cDC1 expression of MHC-II is required for tumour rejection.
a, Tumour growth curves of (left) Xcr1+/+ MHCIIfl/fl, (middle) Xcr1Cre/+ MHCIIfl/fl mice, and (right) MHCIILSL/- injected with 106 1956-mOVA. b, Xcr1+/+ MHCIIfl/fl and Xcr1Cre/+ MHCIIfl/fl mice injected with 106 1956-EV or 106 1956-mOVA. Spleens stained for presence of SIINFEKL-Kb-tetramer+ CD8 T cells. (Left) Representative flow plots of percentage of tetramer+ CD8 T cells. (Right) Graph of tetramer+ CD8 T cells as a percentage of all CD8 T cells. Data are pooled biologically independent samples from two independent experiments (n=4 for Xcr1+/+ MHCIIfl/fl 1956-EV, n=7 for Xcr1+/+ MHCIIfl/fl, n=8 for Xcr1Cre/+ MHCIIfl/fl). ** p=0.001 (unpaired, two-tailed Mann-Whitney test). c, Xcr1+/+ MHCIIfl/fl and Xcr1Cre/+ MHCIIfl/fl mice injected with 106 1956-EV or 106 1956-mOVA (Left) Representative flow plots of OT-II T cells 3 days after transfer. (Right) Graph of percent proliferated OT-II transferred. Data are pooled biologically independent samples from two independent experiments (n=8 for Xcr1Cre/+ MHCIIfl/fl, n=5 for all other groups). ** p=0.006 (unpaired, two-tailed Mann-Whitney test).
Figure 4.
Figure 4.. cDC1 expression of CD40 is required for tumour rejection.
a, Tumour growth curves of (left) Xcr1+/+ CD40fl/fl and (right) Xcr1Cre/+ CD40fl/fl mice injected with 106 1956-mOVA. b, Log2 expression of 148 genes with an increased expression of at least six-fold in skin draining LN (SDLN) cDC1 relative to splenic cDC1 (results averaged from biological triplicates). c, Xcr1+/+ CD40fl/fl and Xcr1Cre/+ CD40fl/fl mice injected with 106 1956-EV or 106 1956-mOVA cells. Spleens stained for the presence of SIINFEKL-Kb tetramer+ CD8+ T cells. Representative flow plots of percentage of tetramer+ CD8 T cells. (Left) Representative flow plots of percentage of tetramer+ CD8 T cells. (Right) Graph of tetramer+ CD8 T cells as a percentage of all CD8 T cells. Data represent pooled biologically independent samples from two independent experiments (n=2 for Xcr1+/+ CD40fl/fl 1956-EV, n=4 for Xcr1+/+ CD40fl/fl, and n=6 for Xcr1Cre/+ CD40fl/fl). ** p=0.01 (unpaired, two-tailed Mann-Whitney test). d, Graph of percent proliferated OT-I transferred into Xcr1+/+ CD40fl/fl, Xcr1Cre/+ CD40fl/fl immunized with cell-associated OVA on day 0. Data are pooled independent samples from two independent experiments (n=3 for Xcr1Cre/+ CD40fl/fl –OVA, n=4 for all other groups). *p=0.029 (unpaired, two-tailed Mann-Whitney test). e, Graph of absolute number of proliferated OT-I per well after 72 h culture with ex vivo migratory cDC2 or cDC1 harvested from tumour-draining lymph nodes 1956-mOVA bearing mice. Data are pooled biologically independent samples from two independent experiments (n=3 for Xcr1+/+ CD40fl/fl Migratory cDC2, and n=4 for all other groups). *p=0.029 (unpaired, two-tailed Mann-Whitney test). f, Graph of percent proliferated OT-II transferred into Xcr1+/+ CD40fl/fl, Xcr1Cre/+ CD40fl/fl immunized with cell-associated OVA on day 0. Data are pooled biologically independent samples from three independent experiments (n=4 for -OVA groups and n=7 for all other groups). ***p=0.006 (unpaired, two-tailed Mann-Whitney test).

Comment in

References

    1. Guilliams M et al. Dendritic cells, monocytes and macrophages: a unified nomenclature based on ontogeny. Nat. Rev. Immunol. 14, 571–578 (2014). - PMC - PubMed
    1. Hildner K et al. Batf3 deficiency reveals a critical role for CD8alpha+ dendritic cells in cytotoxic T cell immunity. Science 322, 1097–1100 (2008). - PMC - PubMed
    1. Cancel JC, Crozat K, Dalod M & Mattiuz R Are Conventional Type 1 Dendritic Cells Critical for Protective Antitumor Immunity and How? Front Immunol 10, 9 (2019). - PMC - PubMed
    1. Dudziak D et al. Differential antigen processing by dendritic cell subsets in vivo. Science 315, 107–111 (2007). - PubMed
    1. Binnewies M et al. Unleashing Type-2 Dendritic Cells to Drive Protective Antitumor CD4(+) T Cell Immunity. Cell 177, 556–571 (2019). - PMC - PubMed

Publication types

Substances