. 2020 Oct;586(7831):790-795.
doi: 10.1038/s41586-020-2609-x. Epub 2020 Aug 12.

Serine restriction alters sphingolipid diversity to constrain tumour growth

Affiliations

Serine restriction alters sphingolipid diversity to constrain tumour growth

Thangaselvam Muthusamy et al. Nature. 2020 Oct.

Abstract

Serine, glycine and other nonessential amino acids are critical for tumour progression, and strategies to limit their availability are emerging as potential therapies for cancer1-3. However, the molecular mechanisms driving this response remain unclear and the effects on lipid metabolism are relatively unexplored. Serine palmitoyltransferase (SPT) catalyses the de novo biosynthesis of sphingolipids but also produces noncanonical 1-deoxysphingolipids when using alanine as a substrate4,5. Deoxysphingolipids accumulate in the context of mutations in SPTLC1 or SPTLC26,7-or in conditions of low serine availability8,9-to drive neuropathy, and deoxysphinganine has previously been investigated as an anti-cancer agent10. Here we exploit amino acid metabolism and the promiscuity of SPT to modulate the endogenous synthesis of toxic deoxysphingolipids and slow tumour progression. Anchorage-independent growth reprogrammes a metabolic network involving serine, alanine and pyruvate that drives the endogenous synthesis and accumulation of deoxysphingolipids. Targeting the mitochondrial pyruvate carrier promotes alanine oxidation to mitigate deoxysphingolipid synthesis and improve spheroid growth, similar to phenotypes observed with the direct inhibition of SPT or ceramide synthesis. Restriction of dietary serine and glycine potently induces the accumulation of deoxysphingolipids while decreasing tumour growth in xenograft models in mice. Pharmacological inhibition of SPT rescues xenograft growth in mice fed diets restricted in serine and glycine, and the reduction of circulating serine by inhibition of phosphoglycerate dehydrogenase (PHGDH) leads to the accumulation of deoxysphingolipids and mitigates tumour growth. The promiscuity of SPT therefore links serine and mitochondrial alanine metabolism to membrane lipid diversity, which further sensitizes tumours to metabolic stress.


Conflict of interest statement

Competing interests

The authors declare no competing interests.

Figures
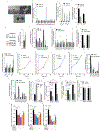
Extended Data Figure 1.
Extended Data Figure 1.. Mitochondrial pyruvate transport and amino acid metabolism influence spheroid growth
a. HCT116 spheroid growth from 3-, 5-, and 8-day cultures. Scale bars indicate 100 μm. b. Metabolite levels in HCT116 adherent and spheroid cultures (n=3 culture wells each). c.Alanine levels in adherent and spheroid cultures (n=3 culture wells each condition and cell line). d. Isotopic labeling (M2 citrate/M3 pyruvate) in HCT116 and MCF7 cells cultured with [U-13C6]glucose for 24 hours (n=3 culture wells each). e. Protein expression of phosphorylated PDH (pPDH), total PDH (tPDH), and β-actin in HCT116 cells. Each lane derived from a single culture well, processed in parallel, and used for quantitation. For gel source data, see Supporting files. f. Citrate labeling in HCT116 cells cultured with [U-13C5]glutamine in HCT116 (n=3 culture wells each condition). g. Metabolite levels upon UK5099 treatment in HCT116 spheroid cultures (n=6 culture wells each). h. Abundances of alanine and serine in A549 spheroid cultures upon treatment with UK5099 (n=3 culture wells each). i. Spheroid growth in cells upon UK5099 treatment (n=3 culture wells each). j, k. Adherent growth of (j) A549 and (k) HCT116 cells upon treatment with UK5099 (n=3 culture wells each). l, m. Adherent growth of (l) A549 and (m) HCT116 cells upon MPC1 or MPC2 knockdown compared to control (shNT) (n=3 culture wells each) n, o. Isotopologue distributions of (n) serine and (o) citrate in HCT116 spheroid cultures traced with [U-13C6]glucose for 24 hours (n=3 culture wells each) p. Alanine abundances in HCT116 spheroids in the presence of 1 mM alanine and UK5099 (n=3 culture wells each). q, r. Spheroid growth of (q) HCT116 and (r) MCF7 cells grown in the presence of UK5099 and alanine (n=3 culture wells each condition). s. Cell number of adherent HCT116 cells in the presence of UK5099 and alanine (n=3 culture wells each). t-v. Spheroid biomass in (t) HCT116, (u) MCF7, and (v) A549 cells grown in the presence or absence of 0.4 mM serine, 0.4 mM glycine, 1 mM alanine, and 1 mM formate (n=3 culture wells for each cell line and condition). Two-sided Student’s t-test (b-i, n, o), one-way ANOVA (t-v) or two-way ANOVA (j-m, p-s) was performed for each comparison with no adjustment for multiple comparison. Similar results obtained in 2 (d, e, h, p, r), 3 (c, f-g, i, n-o, q), or 4 (b) independent experiments. Data represented as mean ± s.e.m. *P<0.05, **P<0.01, ***P<0.0001.
Extended Data Figure 2.
Extended Data Figure 2.. 1-deoxysphingolipid synthesis and degradation influence spheroid growth in vitro
a. Total (hydrolyzed) SA and doxSA abundances in adherent and spheroid cultures of HCT116 cells (n=3 culture wells each). b. Free doxSA abundances in HCT116 cultures in normal medium or medium without serine/glycine but containing 1 mM alanine (–SG+A) (n=3 culture wells each). c. DoxSA/SA molar ratio in HCT116 cells in cultures from (b) (n=3 culture wells each). d. HCT116 spheroid growth in the presence or absence of 10 nM doxSA and treated with vehicle (DMSO) or UK5099 (n=3 culture wells each). e. Adherent (n=4 culture wells each) and spheroid (n=3 culture wells each) biomass of HCT116 cells treated with vehicle or 50 nM sphingoid bases. f. Free doxSA, summed doxDHCer and summed doxCer in spheroid cultures from (e) (n=3 culture wells each). g. SA and doxSA abundances in HCT116 spheroid cultures treated with vehicle or 10 nM myriocin (Myr; n=3 culture wells each). h. DoxSA/SA molar ratio in HCT116 adherent and spheroid cultures treated with vehicle or 10 nM Myr (n=3 culture wells each). i. Free DoxSA abundances in HCT116 spheroid cells in the presence or absence of 1 mM alanine and treated with vehicle or 10 nM Myr (n=3 culture wells each). j. Spheroid growth of cell lines cultured in the presence or absence of 1 mM alanine (red), 10 nM Myr (blue), or both (red outline with checkered blue fill) (n=3 culture wells each condition). k. A549 spheroid growth under 5 days of culture in Myr or 10 μM fumonisin B1 (FuB1) (n=3 culture wells each). l, m. HCT116 (l) spheroid growth and (m) free doxSA in the presence (+SG) or absence (–SG) of 0.4 mM serine/serine and treated with DMSO, FeF, 1 mM alanine, or both (n=3 culture wells for each condition). Two-sided Student’s t-test (a, g), two-way ANOVA (b, c, d, h, i, l, m) or one-way ANOVA (e, f, j, k) was performed for each comparison with no adjustment for multiple comparison. Similar results obtained in 2 (b-e) or 3 (a, g-i) independent experiments. Data represented as mean ± s.e.m. *P<0.05, **P<0.01, *** or # P<0.0001.
Extended Data Figure 3.
Extended Data Figure 3.. Dietary serine/glycine restriction alters tumor growth and ceramide metabolism
a. HCT116 xenograft size in mice fed control (n=16) or –SG (n=15 day 21) diet. b. Plasma amino acids from mice fed control (n=8) or –SG (n=7) diet. c, d. Abundances of (c) doxDHCer and (d) doxCer in HCT116 xenograft tumors (n=8 each diet). e. Abundances of total sphingolipid species in the livers from HCT116 tumor-bearing mice fed control or –SG diet (n=8 each diet). f-i. Abundances of (f) DHCer, (g) Ceramides, (h) sphingomyelins, and (i) S1P in HCT116 xenografts from mice fed control or –SG diet (n=8 each diet). j. HT29 xenograft size in mice fed control (n=16), –SG (n=16), or –SG+A (n=14) diets. k. Plasma amino acids in mice in (j) fed control (n=8), –SG (n=8), or –SG+A (n=7) diets. l. Tumor amino acids from mice in (j) fed control (n=7), –SG (n=8), or –SG+A (n=7). m. DoxSA and summed ceramide species in HT29 xenograft tumors from mice fed control (n=16), –SG (n=16), or –SG+A diets (n=14). n. Abundances of lactosylceramides in HT29 xenograft tumors from mice fed control (n=16), –SG (n=16), or –SG+A diets (n=14). o. Gpt1 and Gpt2 expression in liver tissue of mice fed control, –SG, or –SG+A diets (n=8 for each). p. Nucleotide phosphate abundances in HCT116 xenograft tumors from mice fed control, –SG, or –SG+A diets (n=8 for each). q. Reduced glutathione (GSH), oxidized glutathione (GSSG), and GSH/GSSG measurements of HCT116 xenograft tumors from mice fed control, –SG, or –SG+A diets (n=8 each). Two-sided Student’s t-test (b-i, p, q) or two-way ANOVA (a, j, k, l, m, n, o), was performed with no adjustment for multiple comparison. Data are represented as mean ± s.e.m. *P<0.05, **P<0.01, *** or # P<0.0001.
Extended Data Figure 4.
Extended Data Figure 4.. Influence of SPT and PHGDH inhibition on sphingolipid metabolism
a-d.Abundances of (a) DoxDHCer, (b) DoxCer, (c) DHCer, and (d) Ceramides in HCT116 xenograft tumors from mice fed –SG diet and administered vehicle, 0.03 mg/kg myriocin, or 0.3 mg/kg myriocin (n=16 for each treatment). e-h.Abundances of (e) DoxDHCer, (f) DoxCer, (g) DHCer, and (h) Ceramides in livers from HCT116 xenograft-bearing mice fed –SG diet and administered vehicle (n=8 for e, f, h and n=7 for g), 0.03 mg/kg myriocin (n=8), or 0.3 mg/kg myriocin (n=8). i. Weight loss in mice after tumor inoculation in mice administered vehicle (n=7), 0.03 mg/kg myriocin (n=8), or 0.3 mg/kg myriocin (n=8). j. Schematic describing in vivo sphingolipid physiology under high- and low-dose myriocin treatments generated using BioRender. k. Fractional labeling of serine (1-M0) from HCT116 spheroids cultured with [U-13C6]glucose for 24 hours and treated with vehicle or 5μM PH-755 (n=3 culture wells for each). l. HCT116 spheroid growth in media containing 0.4 mM or 1.0 mM serine and treated with vehicle or 5μM PH-755 (n=3 culture wells for each). m. Total DoxSA abundances in HCT116 spheroids grown for 5 days in media with 0.4 mM or 1 mM serine and treated with vehicle or 5μM PH-755 (n=3 culture wells for each). n. Total DoxSA abundances in A549, HCT116 and MCF7 spheroids treated with vehicle or 5μM PH-755 (n=3 culture wells each). o. Plasma serine, glycine and alanine in mice treated with vehicle or PH-755 (n=7 each). Two-way ANOVA (a-h, k-n), one-way ANOVA (i), or two-sided Student’s t-test (o) was performed with no adjustment for multiple comparison. Similar results were obtained in 2 independent experiments for k-n. Data represented as mean ± s.e.m. *P<0.05, **P<0.01, *** or # P<0.0001.
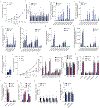
Figure 1.
Figure 1.. Alanine influences anchorage-independent cell growth
a. Alanine secretion by adherent (Adh) and spheroid (Sph) cultures (n=3 culture wells each). b. Alanine secretion by HCT116 cells administered 5 μM UK5099 or DMSO control (n=3 culture wells each). c. Spheroid growth of cells upon knockdown of MPC1 or MPC2 compared to shNT (n=3 culture wells each). d. Citrate enrichment in HCT116 cells cultured with [2,3-13C2]alanine for 2 hours (n=3 culture wells each). e. Schematic depicting alanine metabolism in response to MPC inhibition and tracing with [2,3-13C2]alanine. Cytosolic alanine bypasses MPC via GPT2. f. Spheroid growth of HCT116 cells upon knockdown of MPC1, MPC2 (n=3 culture wells each). Two-sided Student’s t-test (a, d), one-way ANOVA (c) or two-way ANOVA (b, f) with no adjustment for multiple comparisons. Similar results obtained in 2 (a, d) or 3 (b, c, f) independent experiments. Data represented as mean ± s.e.m. *P<0.05, **P<0.01, ***P<0.0001.
Figure 2.
Figure 2.. DoxSL synthesis mitigates anchorage-independent cell growth
a. KM values for serine-utilizing enzymes. Red bar indicates tumor serine concentrations in mice fed control or –SG diets. b. Schematic depicting synthesis of canonical sphingolipids from serine (blue) and doxSLs from alanine (red) via promiscuous SPT activity and ceramide synthase (CerS). c. Free doxSA (red) and spheroid growth (black) of HCT116 after 5 days of growth in media with altered serine (n=3 culture wells each). d. DoxSA levels in spheroid cultures of HCT116 cells upon MPC1 or MPC2 knockdown (n=3 culture wells each). e. Growth of HCT116 adherent cultures (n=12 culture wells) and spheroids (n=3 culture wells) in the presence of myriocin. f. [13C]sphinganine synthesis from [U-13C3]serine tracer in HCT116 cells treated with 10 nM myriocin (n=3 culture wells each). g. HCT116 spheroid growth in the presence of myriocin (Myr) and fumonisin B1 (FuB1) (n=3 culture wells each). h. Relative abundances of summed ceramide species in HCT116 spheroids cultured in –SG, UK5099, or 10 nM myriocin conditions (n=3 culture wells each). One-way ANOVA (d, g) or two-way ANOVA (c, e, f, h) was performed for each comparison with no adjustment for multiple comparisons. Similar results obtained in 2 (c-h) independent experiments. Data represented as mean ± s.e.m. *P<0.05, **P<0.01, *** or # P<0.0001.
Figure 3.
Figure 3.. Serine restriction drives 1-deoxysphingolipid synthesis in vivo.
a. Schematic depicting feeding strategies in mice bearing HCT116 xenografts. b. HCT116 xenograft size over time (n=16 tumors for each). c. Serine, glycine, and alanine abundance in HCT116 xenografts (n=6 tumors each diet). d. Volcano plot depicting lipid alterations in HCT116 xenografts (n=4 tumors each diet). e. f. Abundances of (e) summed ceramides and (f) lactosylceramides in HCT116 xenografts (n=8 tumors each diet). Two-way ANOVA (b) or two-sided Student’s t-test (c, e, f) was performed with no adjustment for multiple comparisons. Data represented as mean ± s.e.m. *P<0.05, **P<0.01, *** or # P<0.0001.
Figure 4.
Figure 4.. Pharmacological inhibition of SPT or PHGDH modulates tumor growth in vivo.
a. HCT116 xenograft size in mice fed -SG diet and administered vehicle, low-dose or high-dose myriocin (n=16 tumors each treatment). Relative abundances of summed ceramides in (b) xenograft tumors (n=16 each treatment) and (c) liver (n=8 each treatment) from mice in (a). d. Amino acid levels in HCT116 xenograft tumors from mice administered vehicle or PH-755 (n=7 tumors each treatment). e. HCT116 xenograft size in mice administered vehicle (n=16 tumors) or PH-755 (n=14 tumors). f. Relative abundances of summed ceramides from HCT116 xenografts from mice administered vehicle or PH-755 (n=16 tumors each treatment). Two-way ANOVA (a-c, e) or two-sided Student’s t-test (d, f) were performed with no adjustment for multiple comparisons. Data represented as mean ± s.e.m. **P<0.01, *** or # P<0.0001.

Comment in

References

    1. Knott SRV et al. Asparagine bioavailability governs metastasis in a model of breast cancer. Nature 554, 378–381, doi:10.1038/nature25465 (2018). - DOI - PMC - PubMed
    1. LeBoeuf SE et al. Activation of Oxidative Stress Response in Cancer Generates a Druggable Dependency on Exogenous Non-essential Amino Acids. Cell Metabolism, doi:10.1016/j.cmet.2019.11.012 (2019). - DOI - PMC - PubMed
    1. Maddocks ODK et al. Serine starvation induces stress and p53-dependent metabolic remodelling in cancer cells. Nature 493, 542–546, doi:10.1038/nature11743 (2013). - DOI - PMC - PubMed
    1. Duan J & Merrill AH 1-Deoxysphingolipids Encountered Exogenously and Made de Novo : Dangerous Mysteries inside an Enigma. Journal of Biological Chemistry 290, 15380–15389, doi:10.1074/jbc.R115.658823 (2015). - DOI - PMC - PubMed
    1. Lone MA, Santos T, Alecu I, Silva LC & Hornemann T 1-Deoxysphingolipids. Biochim Biophys Acta Mol Cell Biol Lipids 1864, 512–521, doi:10.1016/j.bbalip.2018.12.013 (2019). - DOI - PubMed

Publication types

MeSH terms