. 2020 Jan 27:9:47.
doi: 10.12688/f1000research.22139.2. eCollection 2020.

scRepertoire: An R-based toolkit for single-cell immune receptor analysis

Affiliations

scRepertoire: An R-based toolkit for single-cell immune receptor analysis

Nicholas Borcherding et al. F1000Res. .

Abstract

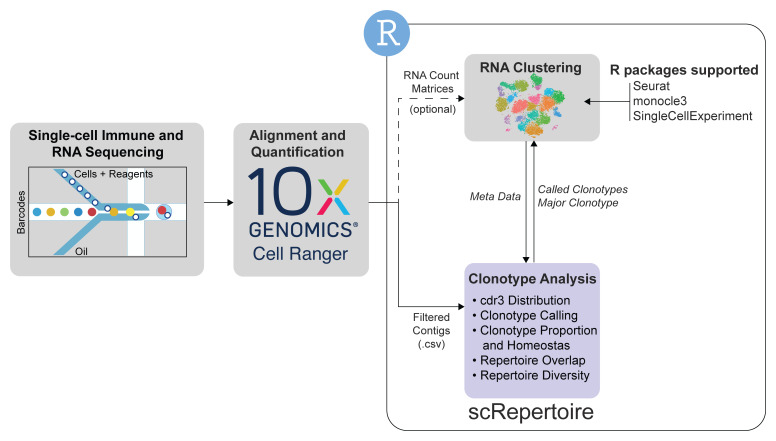
Single-cell sequencing is an emerging technology in the field of immunology and oncology that allows researchers to couple RNA quantification and other modalities, like immune cell receptor profiling at the level of an individual cell. A number of workflows and software packages have been created to process and analyze single-cell transcriptomic data. These packages allow users to take the vast dimensionality of the data generated in single-cell-based experiments and distill the data into novel insights. Unlike the transcriptomic field, there is a lack of options for software that allow for single-cell immune receptor profiling. Enabling users to easily combine mRNA and immune profiling, scRepertoire was built to process data derived from 10x Genomics Chromium Immune Profiling for both T-cell receptor (TCR) and immunoglobulin (Ig) enrichment workflows and subsequently interacts with a number of popular R packages for single-cell expression, such as Seurat. The scRepertoire R package and processed data are open source and available on GitHub and provides in-depth tutorials on the capability of the package.

Keywords: R; Single-cell RNA sequencing; clonotypic analysis; immune receptor profiling.


Conflict of interest statement

No competing interests were disclosed.

Figures

Figure 1.
Figure 1.. A general workflow for single-cell data analysis involving scRepertoire.
The analysis starts with the single-cell immune and mRNA sequencing and Cell Ranger-based alignment with the 10x Genomics pipeline. With the TCR or Ig sequencing, scRepertoire can import the filtered overlapping DNA segments, or contigs. The alignments are filtered by cell type of interest and combined using the individual cell barcodes. Clonotypes can be called using the gene sequence of the immune receptor loci, CDR3 nucleotide sequence or CDR3 amino acid sequence. After clonotype assignment, more extensive clonotypic analysis can be performed at the individual sample level or across all samples. General outputs from scRepertoire can be imported into a number of single-cell expression formats to visualize clonotype data overlaid onto the cell clustering. Likewise, metadata from the expression objects can be imported into scRepertoire to analyze clonotypes by assigned clusters.
Figure 2.
Figure 2.. Basic clonotypic analysis functions in scRepertoire.
( A) Scaled unique clonotypes by total number of TCRs sequenced by patient and type of sample (peripheral, P; tumor, T), using the quantContig function. ( B) Total abundance of clonotypes by sample and type using the abundanceContig function. ( C) Relative abundance of clonotypes using density comparing peripheral blood to tumor samples. ( D) CDR3 nucleotide length analysis by sample using the lengthContig function. The bimodal nature of the curve is a function of calling clonotypes for cells with both one and two immune receptors sequenced.
Figure 3.
Figure 3.. Advanced clonal measures between samples.
( A) Clonal homeostatic space representations across all six samples using the gene and CDR3 AA sequence for clonotype calling. ( B) Relative proportional space occupied by specific clonotypes across all six samples using the gene and CDR3 AA sequence for clonotype calling. ( C) Morisita overlap quantifications for clonotypes across all six samples. ( D) Diversity measures based on clonotypes by sample type using Shannon, Inverse Simpson, Chao, and abundance-based coverage estimator (ACE) indices.
Figure 4.
Figure 4.. Interaction of scRepertoire with the single-cell expression R packages.
( A) UMAP projection from Seurat of the ccRCC T cells (n=12,911) into 12 distinct clusters. ( B) UMAP projection with peripheral blood (red) and tumor (blued) populations highlighted and an accompanying relative proportion composition of each cluster, scaled by the total number of peripheral blood and tumor cells, respectively. ( C) Using the combineExpression function places individual cells into groups by the number of clonotypes, which then can be displayed overlaid with the UMAP projection. ( D) After combining the clonotype information with the Seurat object, highlightClonotypes can be used to specifically highlight the individual clonotypes of interest using the sequence information. ( E) Interaction of clonotypes between multiple categories can be examined using the alluvialClonotypes function.

References

    1. Papalexi E, Satija R: Single-cell RNA sequencing to explore immune cell heterogeneity. Nat Rev Immunol. 2018;18(1):35–45. 10.1038/nri.2017.76 - DOI - PubMed
    1. Chen G, Ning B, Shi T: Single-Cell RNA-Seq Technologies and Related Computational Data Analysis. Front Genet. 2019;10:317. 10.3389/fgene.2019.00317 - DOI - PMC - PubMed
    1. Borcherding N, Bormann NL: scRepertoire (Version 1.2.0). Zenodo. 2020. 10.5281/zenodo.3856827 - DOI - PMC - PubMed
    1. Stuart T, Butler A, Hoffman P, et al. : Comprehensive Integration of Single-Cell Data. Cell. 2019;177(7):1888–1902.e21. 10.1016/j.cell.2019.05.031 - DOI - PMC - PubMed
    1. Macosko EZ, Basu A, Satija R, et al. : Highly Parallel Genome-wide Expression Profiling of Individual Cells Using Nanoliter Droplets. Cell. 2015;161(5):1202–14. 10.1016/j.cell.2015.05.002 - DOI - PMC - PubMed

Publication types

LinkOut - more resources