. 2020 Jul 31;6(31):eabb8725.
doi: 10.1126/sciadv.abb8725. eCollection 2020 Jul.

Development of a pH-responsive polymersome inducing endoplasmic reticulum stress and autophagy blockade

Affiliations

Development of a pH-responsive polymersome inducing endoplasmic reticulum stress and autophagy blockade

Funeng Xu et al. Sci Adv. .

Abstract

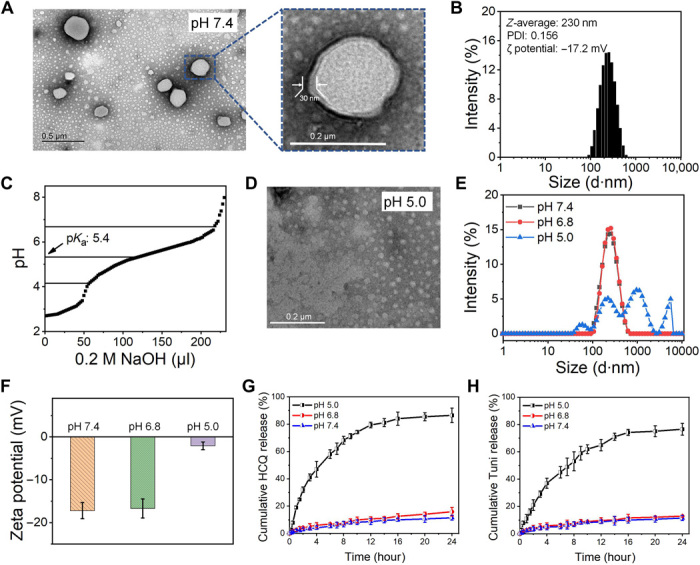
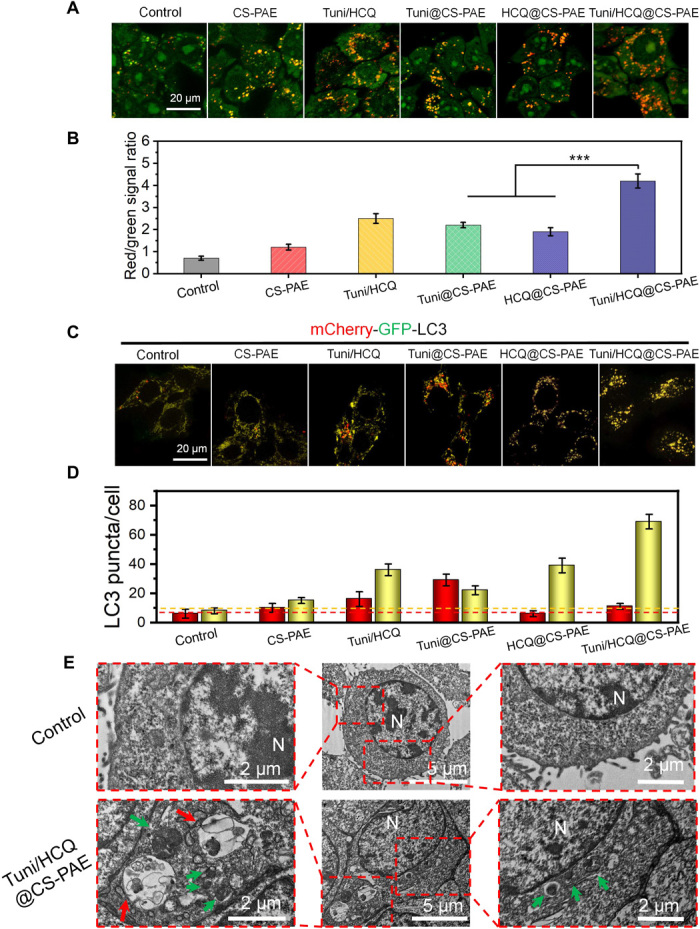
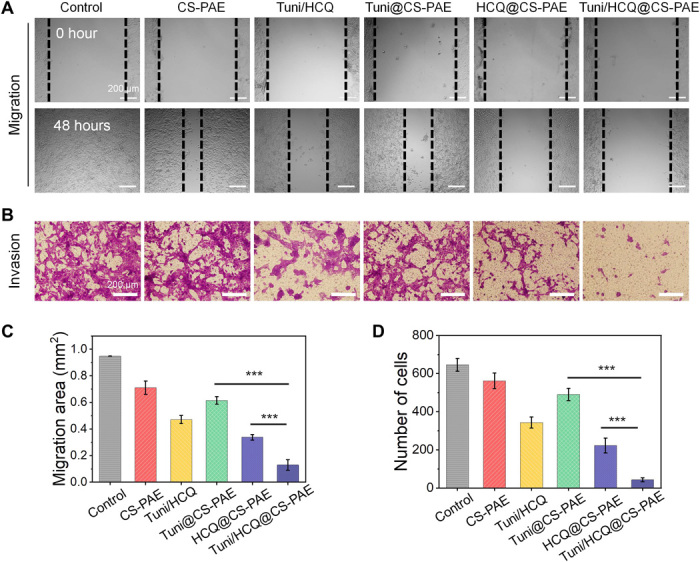
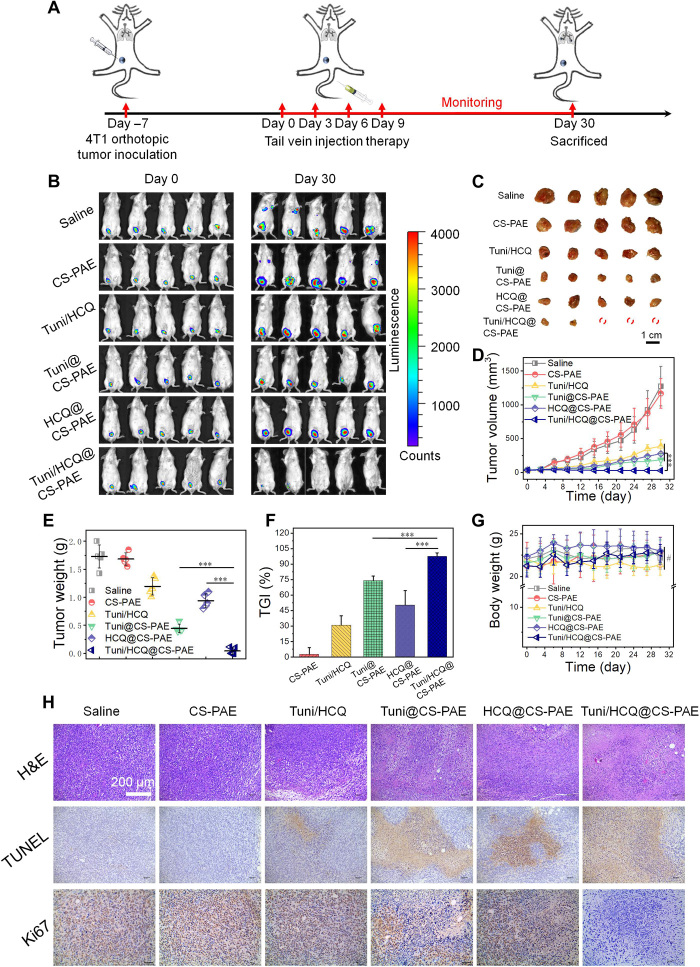
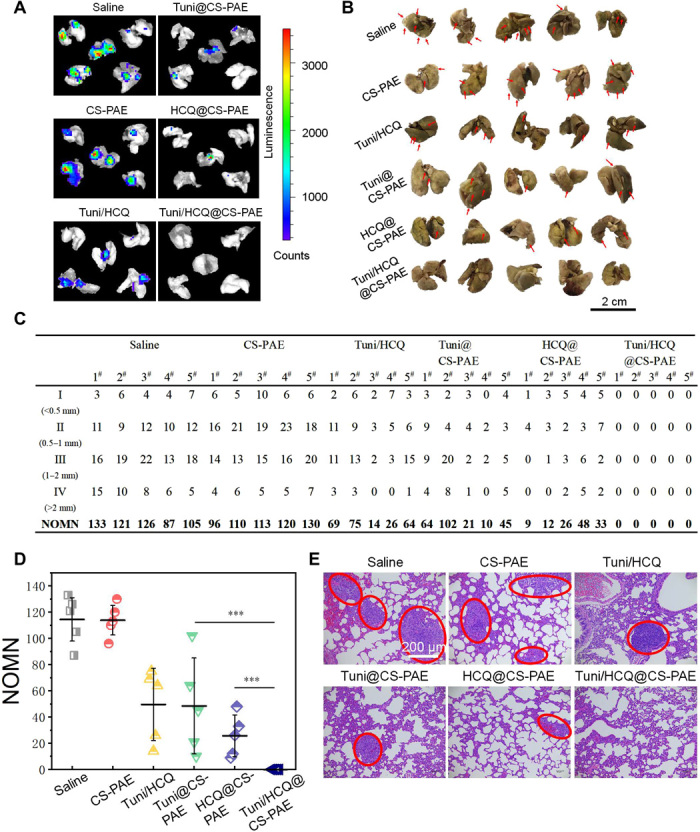
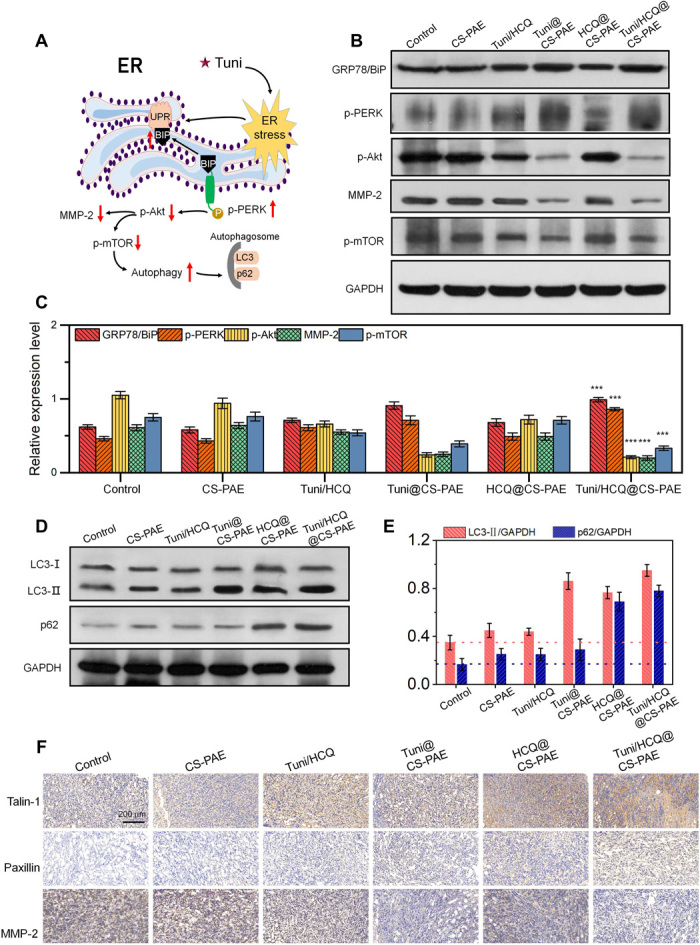
Autophagy is involved in the occurrence and development of tumors. Here, a pH-responsive polymersome codelivering hydroxychloroquine (HCQ) and tunicamycin (Tuni) drugs is developed to simultaneously induce endoplasmic reticulum (ER) stress and autophagic flux blockade for achieving an antitumor effect and inhibiting tumor metastasis. The pH response of poly(β-amino ester) and HCQ synergistically deacidifies the lysosomes, thereby blocking the fusion of autophagosomes and lysosomes and lastly blocking autophagic flux. The function mechanism of regulating autophagy was systematically investigated on orthotopic luciferase gene-transfected, 4T1 tumor-bearing BALB/c mice through Western blot and immunohistochemistry analyses. The Tuni triggers ER stress to regulate the PERK/Akt signaling pathway to increase the autophagic level. The "autophagic stress" generated by triggering ER stress-induced autophagy and blocking autophagic flux is effective against tumors. The reduced expression of matrix metalloproteinase-2 due to ER stress and reduced focal adhesions turnover due to the blockade of autophagic flux synergistically inhibit tumor metastasis.


Figures

Fig. 1
Fig. 1. Characterizations of Tuni/HCQ@CS-PAE polymersomes.
(A) TEM images of the Tuni/HCQ@CS-PAE polymersomes at pH 7.4. (B) Measurement results of the Tuni/HCQ@CS-PAE polymersomes by the Malvern laser particle size analyzer at pH 7.4. (C) Acid-base titration curve of CS-poly(β-amino ester). (D) TEM images of Tuni/HCQ@CS-PAE at pH 5.0. (E) Hydrodynamic particle size distribution of the Tuni/HCQ@CS-PAE polymersomes at pH 7.4, pH 6.8, and pH 5.0. (F) ζ potential of the Tuni/HCQ@CS-PAE polymersomes at pH 7.4, pH 6.8, and pH 5.0. (G) Release profiles of HCQ from the Tuni/HCQ@CS-PAE polymersomes. (H) Release profiles of Tuni from the Tuni/HCQ@CS-PAE polymersomes.
Fig. 2
Fig. 2. Intracellular autophagic levels and autophagic flux analysis.
(A) Fluorescence images and (B) FACS analysis of AO-stained 4T1 cells after incubation with different treatments for 24 hours; ***P < 0.001. (C) Fluorescence images of mCherry-GFP-LC3 4T1 cells after incubation with different treatments for 48 hours. (D) Quantification of the number of LC3 puncta per cell (autophagosomes, yellow puncta; autolysosomes, red puncta). (E) TEM images of cells treated with saline or Tuni/HCQ@CS-PAE polymersomes (N, nucleus; green arrow, autophagosomes; red arrow, autolysosomes).
Fig. 3
Fig. 3. In vitro antimetastasis evaluation.
(A) Typical images of wound-healing assay. (B) Cell invasion with the transwell assay (bottom). (C) Migration area of the wound-healing assay. (D) Number of invaded cells by the transwell assay. All data are represented as the means ± SD from three independent experiments; ***P < 0.001.
Fig. 4
Fig. 4. In vivo antitumor effect.
(A) Treatment schedule for 4T1 breast tumor in BALB/c mice. (B) Bioluminescence images of 4T1-Luc tumor–bearing BALB/c mice were taken on days 0 and 30 after various treatments. (C) Photographs of the tumors removed from the mice in the different treatment groups at the end of the experiment. (D) Tumor volume growth curves of the different treatment groups. (E) Weight of isolated tumors in the different treatment groups. (F) Tumor growth inhibition (TGI) after the different treatments. (G) Body weight changes of mice in the different treatment groups. (H) Hematoxylin and eosin (H&E) staining and immunohistochemical (IHC) analysis of tumor sections after the different treatments. All statistical data are presented as means ± SD. (n = 5; #P > 0.05; ***P < 0.001). [Photo credit for (B), (C), and (H): Funeng Xu, Southwest Jiaotong University].
Fig. 5
Fig. 5. In vivo antitumor metastasis.
(A) Bioluminescence images of tumor lung metastases in each treatment group in vitro. (B) Photographs of lung tissues; tumor metastasis was visualized by Bouin’s fixative, and metastatic nodules were white (represented by red arrows). (C and D) Counting the number of lung metastasis nodules, measurement of the diameter of metastatic tumors, and performing classification and counting. Number of metastasis nodes (NOMN) = I × 1 + II × 2 + III × 3 + IV × 4 (according to the diameter of the lung nodules for class 4: I < 0.5 mm, 0.5 mm ≤ II < 1 mm, 1 mm ≤ III ≤ 2 mm, and IV > 2 mm). (E) H&E staining of lung tissue after the various treatments. The red circle marks the metastatic tumor tissue. [Photo credit for (A), (B), and (E): Funeng Xu, Southwest Jiaotong University].
Fig. 6
Fig. 6. Intrinsic signal pathways analysis.
(A) Schematic diagram of Tuni causing ER stress, promoting autophagy, and reducing MMP-2 expression via signaling pathways in vivo. (B) WB analysis of key proteins of ER stress and downstream pathway protein of 4T1 tumor in BALB/c mice. (C) Relative expression level of key proteins in (B); ***P < 0.001 compared with control. (D) Expression of LC3 and p62 lanes of 4T1 tumor in BALB/c mice via WB. (E) Quantification of the ratio of LC3-II to glyceraldehyde-3-phosphate dehydrogenase (GAPDH) and p62 to GAPDH expression using ImageJ software. (F) IHC pictures of talin-1, paxillin, and MMP-2 in 4T1 tumor–bearing BALB/c mice.

References

    1. Xu R., Ji Z., Xu C., Zhu J., The clinical value of using chloroquine or hydroxychloroquine as autophagy inhibitors in the treatment of cancers: A systematic review and meta-analysis. Medicine 97, e12912 (2018). - PMC - PubMed
    1. Yu L., Chen Y., Tooze S. A., Autophagy pathway: Cellular and molecular mechanisms. Autophagy 14, 207–215 (2018). - PMC - PubMed
    1. Doherty J., Baehrecke E. H., Life, death and autophagy. Nat. Cell Biol. 20, 1110–1117 (2018). - PMC - PubMed
    1. Yang M., Chen P., Liu J., Zhou S., Kroemer G., Klionsky D. J., Lotze M. T., Zeh H. J., Kang R., Tang D., Clockophagy is a novel selective autophagy process favoring ferroptosis. Sci. Adv. 5, eaaw2238 (2019). - PMC - PubMed
    1. Onorati A. V., Dyczynski M., Ojha R., Amaravadi R. K., Targeting autophagy in cancer. Cancer 124, 3307–3318 (2018). - PMC - PubMed

Publication types

LinkOut - more resources