. 2021 May 20;22(3):bbaa163.
doi: 10.1093/bib/bbaa163.

An approach for normalization and quality control for NanoString RNA expression data

Affiliations

An approach for normalization and quality control for NanoString RNA expression data

Arjun Bhattacharya et al. Brief Bioinform. .

Abstract

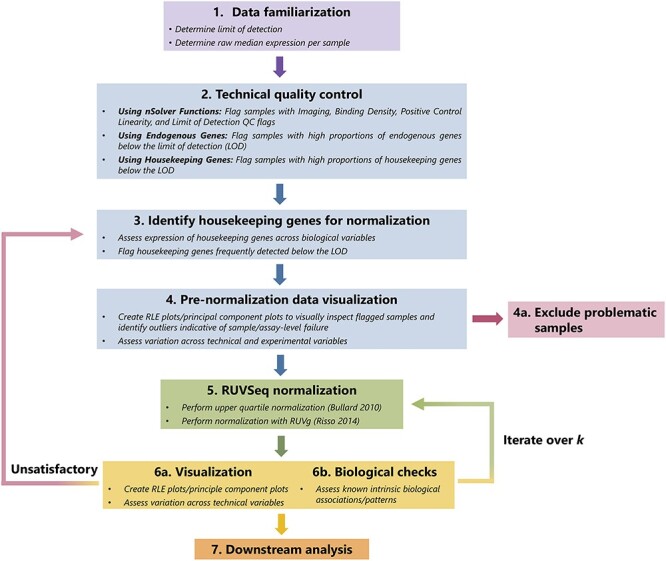
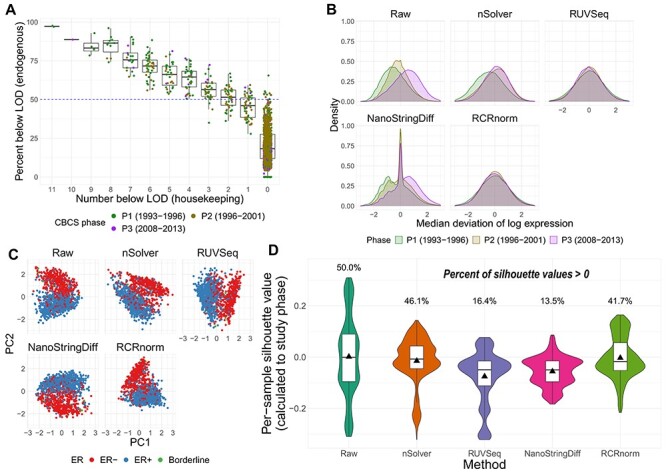
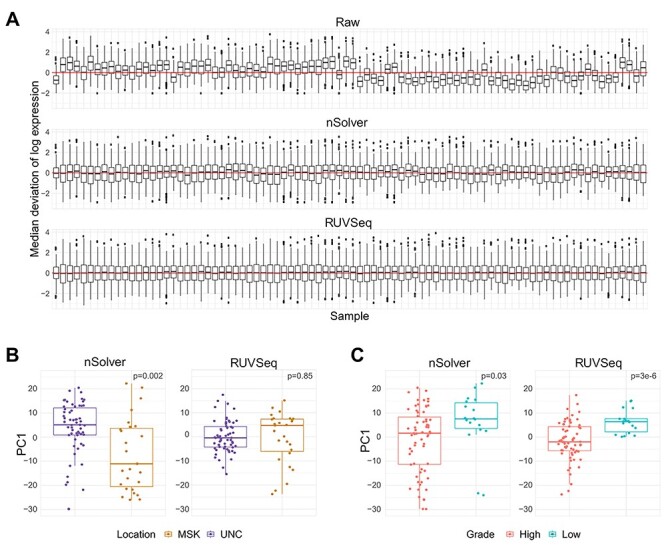
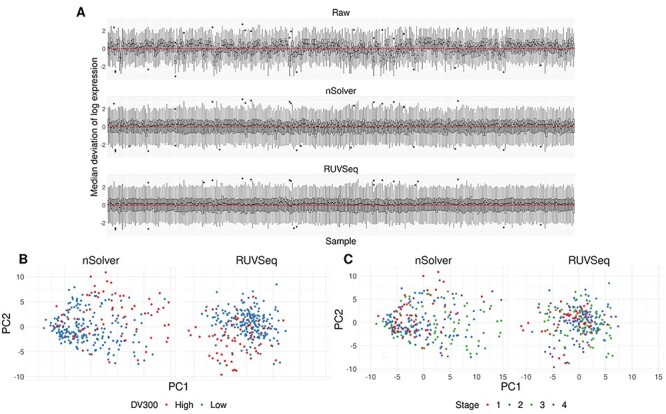
The NanoString RNA counting assay for formalin-fixed paraffin embedded samples is unique in its sensitivity, technical reproducibility and robustness for analysis of clinical and archival samples. While commercial normalization methods are provided by NanoString, they are not optimal for all settings, particularly when samples exhibit strong technical or biological variation or where housekeeping genes have variable performance across the cohort. Here, we develop and evaluate a more comprehensive normalization procedure for NanoString data with steps for quality control, selection of housekeeping targets, normalization and iterative data visualization and biological validation. The approach was evaluated using a large cohort ($N=\kern0.5em 1649$) from the Carolina Breast Cancer Study, two cohorts of moderate sample size ($N=359$ and$130$) and a small published dataset ($N=12$). The iterative process developed here eliminates technical variation (e.g. from different study phases or sites) more reliably than the three other methods, including NanoString's commercial package, without diminishing biological variation, especially in long-term longitudinal multiphase or multisite cohorts. We also find that probe sets validated for nCounter, such as the PAM50 gene signature, are impervious to batch issues. This work emphasizes that systematic quality control, normalization and visualization of NanoString nCounter data are an imperative component of study design that influences results in downstream analyses.

Keywords: NanoString nCounter expression; data visualization; gene expression normalization; quality control.


Figures

Figure 1
Figure 1
Graphical summary of RUVSeq normalization pipeline. The QC and normalization process starts with familiarization with the data (Step 1) and technical QC to flag samples with potentially poor quality (Step 2). After a set of housekeeping genes are selected (Step 3), important unwanted technical variables are also investigated through visualization techniques (Step 4). Problematic samples (e.g. those that are flagged multiple times in technical QC checks) are excluded. Next, the data are normalized using upper quartile normalization and RUVSeq (Step 5), and the normalized data are visualized to assess the removal of unwanted technical variation and retention of important biological variation (Step 6). Steps 3—6 are iterated until technical variation is satisfactorily removed, changing the set of housekeeping genes or the number of dimensions of unwanted technical variation (formula image) estimated using RUVSeq. These data can then be used for downstream analysis (Step 7).
Figure 2
Figure 2
QC and normalization validation in CBCS. (A) Boxplot of percent of endogenous genes below the LOD (formula image-axis) over varying numbers of the 11 housekeeping genes below LOD (formula image-axis), colored by CBCS study phase. Note that the formula image-axis scale is decreasing. (B) Kernel density plots of deviations from median per-sample log2-expression from the raw, nSolver-, RUVSeq-, NanoStringDiff- and RCRnorm-normalized expression matrices, colored by CBCS study phase. (C) Plots of the first principal component (formula image-axis) versus second principal component (formula image-axis) colored by ER subtype of the raw, nSolver-, RUVSeq-, NanoStringDiff- and RCRnorm-normalized expression data. (D) Violin plots of the distribution of per-sample silhouette values, as calculated to study phase, using raw, nSolver-, RUVSeq-, NanoStringDiff- and RCRnorm-normalized expression. The boxplot shows the 25% quartile, median and 75% quartile of the distribution, and the plotted triangle shows the mean of the distribution.
Figure 3
Figure 3
eQTL analysis in CBCS. (A) Cis-trans plots of eQTL results from nSolver-normalized (left) and RUVSeq-normalized data with chromosomal position of eSNP on the formula image-axis and the transcription start site of associated gene in the eQTL (eGene) on the formula image-axis. Points for eQTLs are colored by FDR-adjusted formula image-value of the association. The dotted line provides a 45° reference line for cis-eQTLs. (B) Number of cis- (left) and trans-eQTLs (right) across various FDR-adjusted significance levels. The number of eQTLs identified in nSolver-normalized data is shown in red and the number of eQTLs identified in RUVSeq-normalized data is shown in blue.
Figure 4
Figure 4
Differential expression analysis from Sabry et al. [20]. (A) Venn diagram of the number of differentially expressed genes using nSolver-normalized (blue) and RUVSeq-normalized data (red) across comparisons for IL-2-primed (top) and CTV-1-primed NK cells (bottom). (B) Raw formula image-value histograms for differential expression analysis using nSolver-normalized (blue) and RUVSeq-normalized (red) data across the two comparisons. (C) Scatterplots of log2-fold changes from differential expression analysis using RUVSeq-normalized data (formula image-axis) and nSolver-normalized data (formula image-axis) for any gene identified as differentially expressed in either one of the two datasets. Points are colored by the datasets in which that given gene was classified as differentially expressed. The size of point reflects the standard error of the effect size as estimated in the RUVSeq-normalized data. formula image and the 45° lines are provided for reference.
Figure 5
Figure 5
Normalization differences in bladder cancer dataset. (A) RLE plot from bladder cancer dataset, ordered temporally from oldest to newest sample. (B) Boxplot of first principal component of expression by tumor collection site (location) across nSolver- (left) and RUVSeq-normalized (right) data. (C) Boxplot of first principal component of expression by tumor grade across nSolver- (left) and RUVSeq-normalized (right) data.
Figure 6
Figure 6
Equal performance of normalization procedures in kidney cancer dataset. (A) RLE plot of per-sample deviations from the median for raw, nSolver- and RUVSeq-normalized data. (B) Scatter plot of the first and second principal component of nSolver- (left) and RUVSeq-normalized (right) expression, colored by high and low DV300. (C) Scatter plot of the first and second principal component of nSolver- (left) and RUVSeq-normalized (right) expression, colored by tumor stage.

References

    1. Geiss GK, Bumgarner RE, Birditt B, et al. . Direct multiplexed measurement of gene expression with color-coded probe pairs. Nat Biotechnol 2008;26:317–25. - PubMed
    1. Veldman-Jones MH, Brant R, Rooney C, et al. . Evaluating robustness and sensitivity of the NanoString technologies nCounter platform to enable multiplexed gene expression analysis of clinical samples. Cancer Res 2015;75:2587–93. - PubMed
    1. Troester MA, Sun X, Allott EH, et al. . Racial differences in PAM50 subtypes in the Carolina Breast Cancer Study. J Natl Cancer Inst 2018;110:176–82. - PMC - PubMed
    1. Wallden B, Storhoff J, Nielsen T, et al. . Development and verification of the PAM50-based Prosigna breast cancer gene signature assay. BMC Med Genomics 2015;8:54. - PMC - PubMed
    1. Vieira AF, Schmitt F. An update on breast cancer multigene prognostic tests-emergent clinical biomarkers. Front Med 2018;5:248. - PMC - PubMed

Publication types