Stromal cell diversity associated with immune evasion in human triple-negative breast cancer
- PMID: 32790115
- PMCID: PMC7527929
- DOI: 10.15252/embj.2019104063
Stromal cell diversity associated with immune evasion in human triple-negative breast cancer
Abstract
The tumour stroma regulates nearly all stages of carcinogenesis. Stromal heterogeneity in human triple-negative breast cancers (TNBCs) remains poorly understood, limiting the development of stromal-targeted therapies. Single-cell RNA sequencing of five TNBCs revealed two cancer-associated fibroblast (CAF) and two perivascular-like (PVL) subpopulations. CAFs clustered into two states: the first with features of myofibroblasts and the second characterised by high expression of growth factors and immunomodulatory molecules. PVL cells clustered into two states consistent with a differentiated and immature phenotype. We showed that these stromal states have distinct morphologies, spatial relationships and functional properties in regulating the extracellular matrix. Using cell signalling predictions, we provide evidence that stromal-immune crosstalk acts via a diverse array of immunoregulatory molecules. Importantly, the investigation of gene signatures from inflammatory-CAFs and differentiated-PVL cells in independent TNBC patient cohorts revealed strong associations with cytotoxic T-cell dysfunction and exclusion, respectively. Such insights present promising candidates to further investigate for new therapeutic strategies in the treatment of TNBCs.
Keywords: cancer-associated fibroblasts; single-cell RNA sequencing; stromal heterogeneity; triple-negative breast cancer; tumour microenvironment.
© 2020 The Authors.
Conflict of interest statement
The authors declare that they have no conflict of interest.
Figures

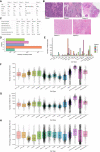
- A
Clinical and pathological features of patient age, breast cancer subtype, tumour grade, Ki67 status, treatment history and TIL count of the 5 primary breast carcinoma samples analysed in the study.
- B
Representative haematoxylin–eosin (H&E)‐stained sections for each patient analysed by single‐cell RNA sequencing in this study.
- C
Quality control metrics as generated by the Cellranger software (10X Genomics).
- D
Number of cells that passed quality control and filtering using EmptyDroplets per patient.
- E
Number of cells that passed quality control and filtering using EmptyDroplets per cell type and patient.
- F–H
Boxplots showing the number of detected genes (F), UMIs (G) and proportion of mitochondrial counts (H) per cell type across all five tumour samples, respectively. Data points represent individual cells. The central band and boxes correspond with the median and lower/upper quartiles, respectively. Whiskers extend to the lowest or largest value no further than 1.5 × the interquartile range, with points outside this range considered outliers.

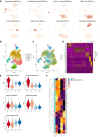
Schematic highlighting the application of our single‐cell RNA sequencing experimental and analytical workflow for primary patient tissue.
UMAP visualisation of 4,986 epithelial cells aligned using canonical correlation analysis in Seurat. Cells are coloured by their cell type annotation (left) and patient of origin (right).
Log‐normalised expression of markers for epithelial (EPCAM), mature luminal epithelial (ESR1), myoepithelial (KRT5, KRT14 and ACTA2) and proliferating cancer cells (MKI67).
UMAP visualisation of 19,285 stromal and immune cells aligned and visualised as represented in (B).
Log‐normalised expression of markers for fibroblasts (PDGFRB, THY1, COL1A1, ITGB1 and S100A4), endothelial cells (PECAM1), T cells (CD3D), CD8 T cells (CD8A), T‐regulatory cells (FOXP3), B cells (MS4A1), myeloid cells (CD68) and plasma cells (JCHAIN).
Proportion of cell types across each patient.

- A
Featureplots highlighting the area under the curve (AUC) value for selected cell type signatures derived from various studies collated in the XCELL study. AUC values are calculated on a per cell basis using the AUCell package with default parameters. Selected signatures for fibroblasts (Fantom_1), endothelial cells (Fantom_2), B cells (Fantom_1), Plasma cells (IRIS_2), CD4+ T cells (Fantom_3), CD8+ T cells (HPCA_3), T‐regulatory cells (Fantom_3) and monocytes (Fantom_3).
- B–D
Re‐clustering of 7,990 T cells identifies 175 T‐follicular helper cells (2.2%; CXCL13 and CD200), 994 T‐regulatory cells (12.4%; FOXP3 and BATF), 2,003 other CD4+ T cells (25.1% of all T cells; CD4, IL7R and CD40LG), 3,691 CD8+ T cells (46.2%; CD8A and GZMH), 605 proliferating T cells (7.6%; MKI67), 358 NK Cells (4.5%; GNLY, KLRD1, NCR1, XCL1 and NCAM1) and 164 NKT cells (2.1%; GNLY, KLRD1, NCR1 and CD3D −). Shown are t‐SNE representations of re‐clustered T cells coloured by the annotated subsets (B) and patient ID (C). (D) Heatmap of the top 10 DEGs per T‐cell subset.
- E
AUC values for all stromal cells scored against published human and mouse pancreatic CAF signatures for the myofibroblast‐like CAF, inflammatory‐like CAF and antigen‐presenting CAF subsets (Ohlund et al, 2017; Biffi et al, 2018; Elyada et al, 2019).
- F
Heatmap of the stromal cluster averaged expression of genes from human pancreatic CAF signatures, as in (E).

t‐SNE representation of the four subclasses of cancer‐associated fibroblasts (CAFs) and perivascular‐like cells (PVL), named myofibroblast‐like CAFs (myCAFs; 280 cells), inflammatory‐like CAFs (iCAFs; 1,129 cells), differentiated‐PVL cells (dPVL cells; 122 cells) and immature‐PVL cells (imPVL cells; 198 cells).
Plot showing the proportion of the four stromal subsets across all five patients.
Log expression of parenchymal gene markers commonly associated with CAFs and perivascular cells.
Cluster averaged log‐normalised expression of the top 300 differentially expressed genes between the four stromal subsets with stromal‐related genes of interest annotated. Expression values are scaled per cluster.
Circle histogram plot of the top gene ontologies enriched in each of the four stromal subsets, with pathways broadly grouped for ECM, development and signalling, muscle contractile features and angiogenesis and adhesion. Scale bar represents the −log10 q‐value for the enrichment of individual GO terms, as determined using ClusterProfiler.

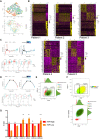
- A
t‐SNE representation of the four subclasses of cancer‐associated fibroblasts (CAFs) and perivascular‐like (PVL) cells by patient ID.
- B
Differential gene expression heatmaps showing the composition of the four stromal subsets in Patient‐1 to Patient‐5.
- C, D
Pseudotime trajectory of CAFs from Patient‐2 (C) and PVL cells from Patient‐1 (D) using the Monocle method annotated by the subsets derived from Seurat based re‐clustering. (C) Increased expression of marker genes such as ACTA2, COL1A1, FAP, TAGLN and THY1 as cells move throughout pseudotime indicate that iCAFs transition towards myCAFs. In contrast, iCAF marker CXCL12 decreases as cells move throughout pseudotime. (D) Increased expression of marker genes such as ACTA2 and MYH11 as cells move throughout pseudotime indicate that imPVL cells transition towards dPVL cells. In contrast, imPVL cell markers CD36 and RGS5 decreases as cells move throughout pseudotime.
- E
Four technical replicates of CAF sorting of myCAF and iCAF fractions using FAPHIGH and FAPnegative/LOW, respectively.
- F
FACS analysis showing the co‐expression of CD90 (THY1) with FAPHIGH CAFs. This is represented through overlaying CD90 signal over a replicate sample used for FACS as in (E) (top) and through a contour plot of FAP vs. CD90 signal (bottom; n = 4 biological replicates).
- G
Quantitative PCR validation of FAP, ACTA2, CXCL12, EGFR, PDGFRA and PDGFRB in FAPHIGH and FAPnegative/LOW CAF sorted fractions (n = 4 biological replicates). Error bars represent standard error of the mean (SEM). The ACTB housekeeping gene was used for normalisation. P‐values were determined using pairwise comparison with Student's t‐test with P‐values denoted by asterisks: *P < 0.05. FAP and ACTA2 are enriched in FAPHIGH sorted myCAF‐like fractions, while CXCL12 and EGFR are enriched in FAPLOW sorted iCAF‐like fractions.

Polarised gene regulatory states underlying stromal subclasses. Heatmap shows the averaged regulon activity (area under the curve; AUC) for the top 50 highest TFs regulons as estimated using SCENIC. All regulons are statistically enriched across the four subsets (P < 1 × 10⁻⁵ One‐way ANOVA). Heatmap is clustered using Euclidean distance and complete linkage.
Candidate transcriptional drivers of each CAF and PVL subset. Violin plots showing the log‐normalised gene expression (left) of the TF and its respective AUC regulon activity (right). TFs ZEB1 and FOXP1 enriched in myofibroblast‐like CAFs, EGR2 and TCF7L2 enriched in inflammatory‐like CAFs, MEF2C enriched in PVL cells and NR2F2 enriched in immature‐PVL cells.

- A
Summary of the markers distinguishing each of the four stromal subpopulations identified in this study.
- B
FACS validation in matched patient tissue. Stromal cells are negatively gated for EPCAM (epithelial), CD45 (immune) and CD31 (endothelium) and positively selected for PDGFRβ. Subsequent markers PDGFRα and CD146 (MCAM) are used to distinguish CAFs and PVL cells, respectively. Expression of FAPHIGH, FAPLOW, CD36+ and CD36− is further used to define myofibroblast‐like CAFs, inflammatory‐like CAFs, immature‐PVL cells and differentiated‐PVL cells, respectively.
- C, D
Immunofluorescence of cultured human CAFs (C) and PVL cells (D) from passage 8, staining for CD34 (CAFs), ⍺‐SMA (myCAFs and PVL cells), CD146 (PVL cells) and CD36 (imPVL cells).
- E, F
Quantitative analysis of collagen abundance (E) and orientation (F) using second harmonic generation (SHG) from cellular derived matrices from stromal subsets and representative images multiphoton SHG images (n = 3 biological replicates). All SHG intensity values within each replicate were normalised to the SHG intensity of the myCAFs. Error bars represent standard deviation. Statistical significance for collagen abundance (E) was determined using unpaired two‐tailed Student's t‐test with equal standard deviation with P‐values denoted by asterisks: *P < 0.05, **P < 0.01 and ***P < 0.001. After normalisation of the orientation peak distributions (F), statistical significance was determined using a Kruskal–Wallis test with Dunn's post hoc multiple comparisons test (P‐value < 0.0001).
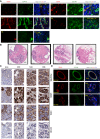
- G, H
Immunohistochemical staining of PDGFRβ, ⍺‐SMA, CD34 and CD146 in serial sections cut 4 μm apart from matched cases; Patient‐2 (G) and Patient‐4 (H). Images were aligned using FIJI. Tumour (T) regions are annotated by the solid yellow line. Co‐localisation of CD34 and CD146 was used to distinguish blood vessels (BV), where their differential staining was used to identify CAFs and PVL cells. (G) MyCAFs were found to be localised at the invasive stromal interface (insert A), while iCAFs were located at distal regions (insert B) with a high abundance of tumour‐infiltrating lymphocytes (TILs). (H) Case with a high abundance of perivascular‐like (PVL) cells in regions surrounded by blood vessels.
- I
Validation of disseminated PVL cells from blood vessels using co‐immunofluorescence of CD31 (red), CD146 (green) and DAPI (blue). Representative images from Patient‐4 is shown.

- A
Validation of PVL cells detached from blood vessels using co‐immunofluorescence of CD31 (red), CD146 (green) and DAPI (blue) for sections from all five patients analysed in this study.
- B, C
H&E images (B) and immunohistochemical staining of PDGFRβ, ⍺‐SMA, CD34 and CD146 in serial sections (C) cut 4 μm apart from normal breast tissues collected from four women (N3B, N3D, N3E and N3G). Images were aligned using FIJI.
- D
Co‐immunofluorescence of CD31 (red), CD146 (green) and DAPI (blue) from normal breast tissue samples. CD146 is completely colocalised with CD31 at blood vessel (BV) regions, indicating that no detached PVL cells are present in normal breast tissues.

- A
Circos plot summary of the stromal ligand–receptor interactions. Outer sectors are weighted according to the number of annotated ligand–receptor interactions per cell type. Links between sectors are weighted according to the “Interaction Strength”, calculated as a product of ligand and receptor expression. Links are coloured by the respective stromal subsets; myCAFs (red), iCAFs (orange), dPVL cells (blue) and imPVL cells (light blue).
- B
Summary of the total ligands and receptors annotated per cell type.
- C–E
Imputed gene expression of selected candidate signalling molecules identified between the four stromal subsets and malignant (C) epithelial, (D) myeloid and (E) T cells. Expression of ligands in stromal clusters is represented on the left, with cognate receptors on target cells on the right.

- A
iCAF T‐cell dysfunction gene signature highlighting genes significantly associated with CTL dysfunction in two out of three independent patient cohorts (METABRIC, GSE21653 and GSE58812).
- B
Representative cohort (METABRIC) showing the prognostic value of iCAF T‐cell dysfunction signature in the context of CTLs for a total of 233 patients. Kaplan–Meier present two groups of patients, “low CTL” (blue line) and “high CTL” (red line), as estimated according to the average expression of CTL‐specific genes and stratified as compared to the mean. Tumours with low iCAF T‐cell dysfunction signatures (top) show patients with high CTL levels have a better survival outcome. In contrast, this survival benefit is lost in tumours with a high iCAF T‐cell dysfunction signature (bottom). P‐values were defined from the Cox proportional hazard (Cox‐PH) model.
- C
Dysfunctional CTLs detected in all five TNBC patients determined through scoring a T‐cell exhaustion signature. UMAP featureplot of the exhaustion signature across all stromal and immune cells as in Fig 1D.
- D
Bulk stromal signature associates with CTL exclusion. Pearson correlation was computed between all inferred CTL levels (y axis) and the respective correlation between the bulk sample and the single‐cell cluster (x axis). Signature of all stromal cells divided over all cells correlated negatively with CTL levels, while control CD4+ and CD8+ gene signatures show a positive correlation. P‐values were computed using a two‐sided t‐test for correlation and were adjusted using the Benjamini–Hochberg procedure.
- E
dPVL cells associated with CTL exclusion. Repeated analysis in the same manner as in (D), instead with myCAF, iCAF, dPVL and imPVL clusters divided over all stromal cells independently, highlighting that CTL exclusion is mainly driven by dPVL cells. Representative cohort GSE58812 is shown.
- F–H
dPVL profiles and CTL exclusion consistent in our study. (F) Patients with the highest dPVL profiles by scRNA‐Seq (P4 and P5) show the lowest tumour‐infiltrating lymphocyte (TIL) pathology counts. (G, H) Accurate quantification of CTLs (G) and representative immunohistochemistry staining for CD8 on matched patient tumour sections (H). n = 5 stromal 1 mm2 regions were counted per tumour. The central band, boxes and whiskers represent the median, lower/upper quartile and min/max CTL counts per 1 mm2, respectively. P3 is shown as an example of a low dPVL profile with high CTLs. In contrast, P4 has a high dPVL profile with low CTLs. Statistical significance was determined using pairwise comparison with Student's t‐test with P‐values denoted by asterisks: *P < 0.05, **P < 0.01, ***P < 0.001 and ****P < 0.0001.

Prognostic value of iCAF T‐cell dysfunction signature in three independent cohorts. Kaplan–Meier present two groups of patients, “low CTL” and “high CTL,” as estimated according to the average expression of CD8A, CD8B, GZMA, GZMB and PRF1, and stratified as compared to the mean. The top and bottom panels show tumours with low and high iCAF T‐cell dysfunction signature, respectively. Sample divided according to iCAF T‐cell dysfunction signature shows significant association with CTL levels and survival outcome. P‐values were defined from the Cox proportional hazard (Cox‐PH) model.
Bulk stromal signature associates with CTL exclusion in TNBC cohorts from the METABRIC, GSE21653, GSE58812 and The Cancer Genome Atlas (TCGA) studies. Pearson correlation was computed between all inferred CTL levels (y axis) and the respective correlation between the bulk sample and the single‐cell cluster of interest (x axis). Signature of all stromal cells divided over all cells correlated negatively with CTL levels, while control CD4+ and CD8+ gene signatures show a positive correlation. P‐values were computed using a two‐sided t‐test for correlation and were further adjusted using the Benjamini–Hochberg procedure.
dPVL cells associated with CTL exclusion. Repeated analysis in the same manner as in (B), instead with the averaged expression signature of each stromal subset over all stromal cells, highlighting that CTL exclusion is mainly driven by dPVL cells in three out of four cohorts.
Comment in
-
A map of human breast cancer: new players in stromal-immune crosstalk.EMBO J. 2020 Oct 1;39(19):e106368. doi: 10.15252/embj.2020106368. Epub 2020 Sep 10. EMBO J. 2020. PMID: 32909627 Free PMC article.
References
-
- Alarmo EL, Kuukasjarvi T, Karhu R, Kallioniemi A (2007) A comprehensive expression survey of bone morphogenetic proteins in breast cancer highlights the importance of BMP4 and BMP7. Breast Cancer Res Treat 103: 239–246 - PubMed
-
- Banerjee S, Sengupta K, Dhar K, Mehta S, D'Amore PA, Dhar G, Banerjee SK (2006) Breast cancer cells secreted platelet‐derived growth factor‐induced motility of vascular smooth muscle cells is mediated through neuropilin‐1. Mol Carcinog 45: 871–880 - PubMed
Publication types
MeSH terms
Grants and funding
LinkOut - more resources
Full Text Sources
Other Literature Sources

