. 2020 Aug 27;124(34):7336-7347.
doi: 10.1021/acs.jpcb.0c04511. Epub 2020 Aug 17.

Does SARS-CoV-2 Bind to Human ACE2 More Strongly Than Does SARS-CoV?

Affiliations

Does SARS-CoV-2 Bind to Human ACE2 More Strongly Than Does SARS-CoV?

Hoang Linh Nguyen et al. J Phys Chem B. .

Abstract

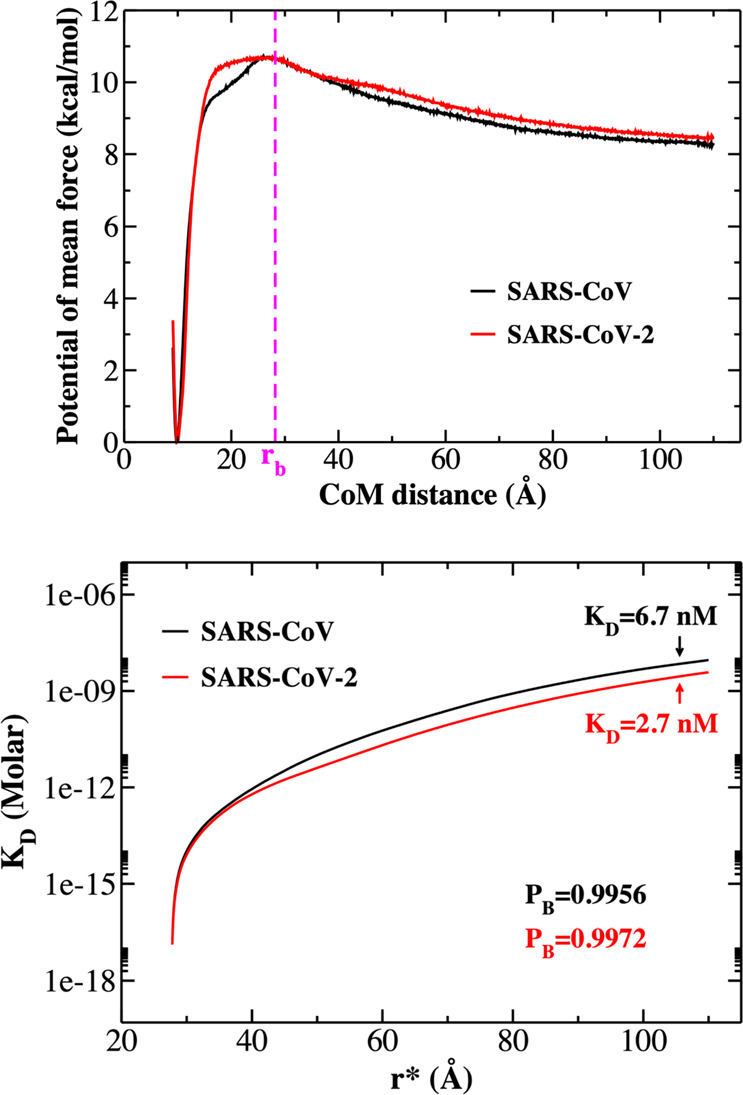
The 2019 novel coronavirus (SARS-CoV-2) epidemic, which was first reported in December 2019 in Wuhan, China, was declared a pandemic by the World Health Organization in March 2020. Genetically, SARS-CoV-2 is closely related to SARS-CoV, which caused a global epidemic with 8096 confirmed cases in more than 25 countries from 2002 to 2003. Given the significant morbidity and mortality rate, the current pandemic poses a danger to all of humanity, prompting us to understand the activity of SARS-CoV-2 at the atomic level. Experimental studies have revealed that spike proteins of both SARS-CoV-2 and SARS-CoV bind to angiotensin-converting enzyme 2 (ACE2) before entering the cell for replication. However, the binding affinities reported by different groups seem to contradict each other. Wrapp et al. (Science 2020, 367, 1260-1263) showed that the spike protein of SARS-CoV-2 binds to the ACE2 peptidase domain (ACE2-PD) more strongly than does SARS-CoV, and this fact may be associated with a greater severity of the new virus. However, Walls et al. (Cell 2020, 181, 281-292) reported that SARS-CoV-2 exhibits a higher binding affinity, but the difference between the two variants is relatively small. To understand the binding mechnism and experimental results, we investigated how the receptor binding domain (RBD) of SARS-CoV (SARS-CoV-RBD) and SARS-CoV-2 (SARS-CoV-2-RBD) interacts with a human ACE2-PD using molecular modeling. We applied a coarse-grained model to calculate the dissociation constant and found that SARS-CoV-2 displays a 2-fold higher binding affinity. Using steered all-atom molecular dynamics simulations, we demonstrate that, like a coarse-grained simulation, SARS-CoV-2-RBD was associated with ACE2-PD more strongly than was SARS-CoV-RBD, as evidenced by a higher rupture force and larger pulling work. We show that the binding affinity of both viruses to ACE2 is driven by electrostatic interactions.


Conflict of interest statement

The authors declare no competing financial interest.

Figures

Figure 1
Figure 1
(Top panel) Spike protein sequence and relative locations of different regions: RBD, receptor binding domain; SD1, subdomain 1; SD2, subdomain 2; FP, fusion peptide; HR1, heptad repeat 1; HR2, heptad repeat 2; TM, transmembrane regions; IC, intracellular domain. (Middle panel) Structures of the complex of ACE2-PD with SARS-CoV-RBD (left, PDB ID 2AJF) and SARS-CoV-2-RBD (right, PDB ID 6VW1). The arrow indicates the direction along which external force is applied in the SMD simulation. (Bottom panel) The vectors of individual hydrogen bonds in the interface are highlighted in red, and the total vector (as in the middle panel) is black.
Figure 2
Figure 2
Networks of interchain HBs (green) and NBCs (red) of the initial structures used in SMD simulation. Residue indexes of the viral protein are highlighted in pink and blue, and those for ACE2, in black and green. The numbering of residues is the same as in PDB structures with the chain names shown in parentheses.
Figure 3
Figure 3
Representative force–time profiles, obtained for v = 5, 1.5, and 0.5 nm/ns.
Figure 4
Figure 4
(Left) Time dependence of the total nonbonded interaction energy (electrostatic and vdW) of SARS-CoV and SARS-CoV-2 in complex with ACE2 and a pulling speed of 0.5 nm/ns. (Right) Time dependence of the electrostatic and vdW interaction energies of two complexes. The results were obtained by averaging over five trajectories and a time window of 0–7000 ps.
Figure 5
Figure 5
RMSF of the residues of viral RBD S proteins, obtained in the SMD simulation with v = 0.5 nm/ns. The regions with high RMSFs are shown with colored bands. Blue refers to the area where the RBD residues are in contact with ACE2-PD. The results were obtained by averaging over five trajectories and a time window of 0–7000 ps.
Figure 6
Figure 6
Energy of the nonbonded interaction between the residues of RBD of S proteins and ACE2-PD. Residues that have an energy below −100 kcal/mol are shown in blue, while red indicates residues with an energy above 100 kca/mol. Other residues are in black. In the case of SARS-CoV-2, charged residues R1, K403, R408, R439, and K452 have a total nonbonded interaction below −200 kcal/mol. Results were obtained by averaging over five trajectories and a time window of 0–7000 ps. Pulling speed v = 0.5 nm/ns.
Figure 7
Figure 7
(Upper panel) List of the residues that are different for SARS-Cov and SARS-Cov-2 in three regions denoted by boxes at the interface. (Middle panel, left) Interface with three regions enclosed in boxes. For the SARS-CoV system, the viral protein is shown in cyan, and magenta highlights ACE2-PD. For the SARS-CoV-2 system, the viral protein and ACE2-PD are highlighted in orange and green, respectively. The bottom and middle panels (right) refer to regions 1, 2, and 3. The residues of the viral protein in SARS-CoV and SARS-CoV-2 are highlighted in teal and orange, respectively. The numbers in parentheses denote the mean nonbonded interaction energies between these residues and ACE2-PD (kcal/mol). Results were obtained by averaging over five trajectories and a time window of 0–7000 ps. Pulling speed v = 0.5 nm/ns.
Figure 8
Figure 8
(Top) One-dimensional potential of mean force (1D-PMF) of SARS-CoV (black curve) and SARS-CoV-2 (red curve). Results were obtained by applying the WHAM analysis method for 750 ns REX-US simulations. (Bottom) KD curves as a function of r* corresponding to the change in the total free monomer concentration from eq 6. Pb and KD were determined at r* = 105 Å.

References

    1. Organization, W. H. WHO Director-General’s opening remarks at the media briefing on COVID-19–11 March 2020. Geneva, Switzerland, 2020.
    1. Huang C.; Wang Y.; Li X.; Ren L.; Zhao J.; Hu Y.; Zhang L.; Fan G.; Xu J.; Gu X.; et al. Clinical features of patients infected with 2019 novel coronavirus in Wuhan. Lancet 2020, 395, 497–506. 10.1016/S0140-6736(20)30183-5. - DOI - PMC - PubMed
    1. Chan J. F.-W.; Kok K.-H.; Zhu Z.; Chu H.; To K. K.-W.; Yuan S.; Yuen K.-Y. Genomic characterization of the 2019 novel human-pathogenic coronavirus isolated from a patient with atypical pneumonia after visiting Wuhan. Emerging Microbes Infect. 2020, 9, 221–236. 10.1080/22221751.2020.1719902. - DOI - PMC - PubMed
    1. Wan Y.; Shang J.; Graham R.; Baric R. S.; Li F.. Receptor recognition by novel coronavirus from Wuhan: An analysis based on decade-long structural studies of SARS J. Virology 2020,10.1128/JVI.00127-20. - DOI - PMC - PubMed
    1. Gorbalenya A. E.; Baker S. C.; Baric R. S.; de Groot R. J.; Drosten C.; Gulyaeva A. A.; Haagmans B. L.; Lauber C.; Leontovich A. M.; Neuman B. W.; et al. Coronaviridae Study Group of the International Committee on Taxonomy of, V. The species Severe acute respiratory syndrome-related coronavirus: classifying 2019-nCoV and naming it SARS-CoV-2. Nat. Microbiol. 2020, 5, 536–544. 10.1038/s41564-020-0695-z. - DOI - PMC - PubMed

Publication types

MeSH terms