. 2020 Dec 1;130(12):6379-6394.
doi: 10.1172/JCI94171.

Mutation affecting the conserved acidic WNK1 motif causes inherited hyperkalemic hyperchloremic acidosis

Affiliations

Mutation affecting the conserved acidic WNK1 motif causes inherited hyperkalemic hyperchloremic acidosis

Hélène Louis-Dit-Picard et al. J Clin Invest. .

Abstract

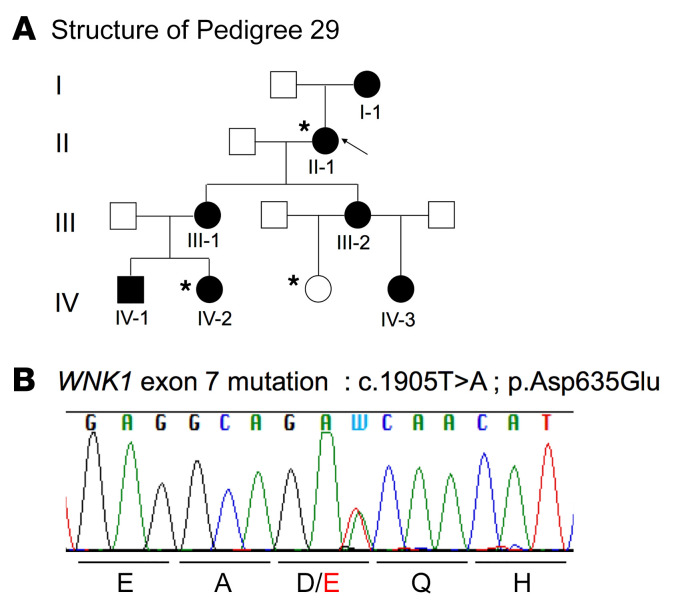
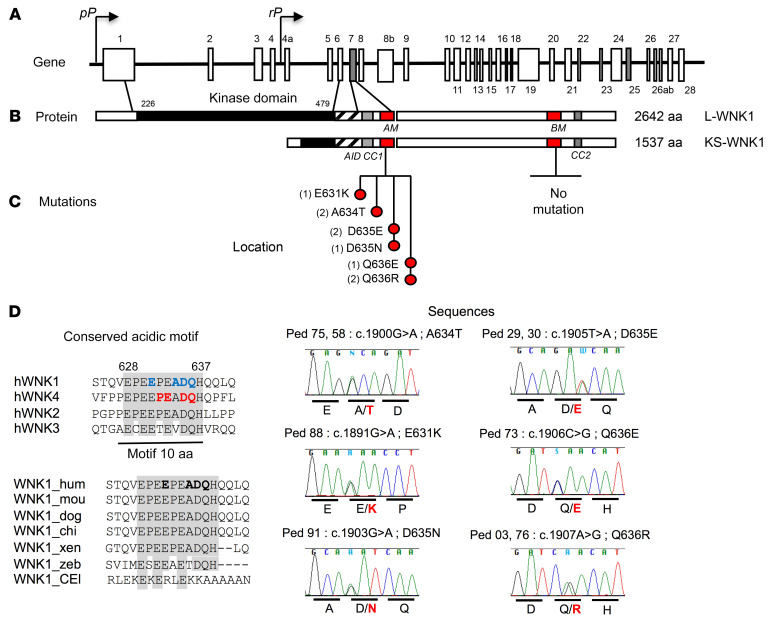
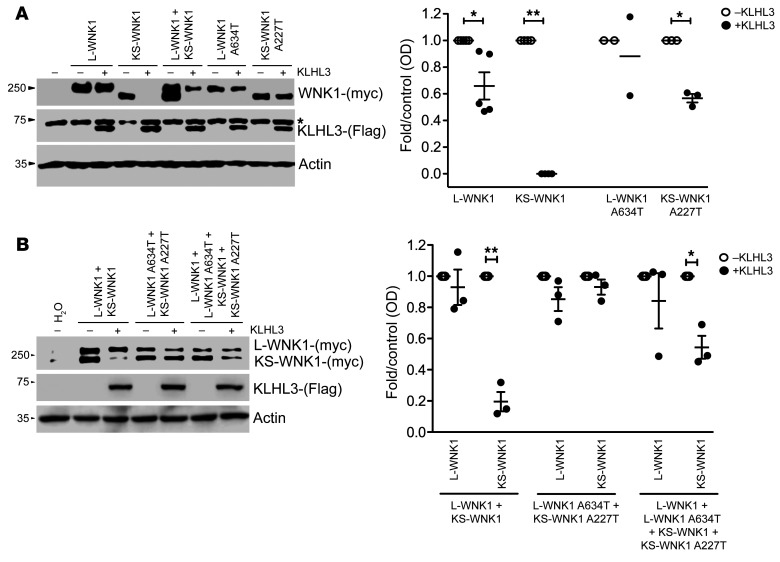
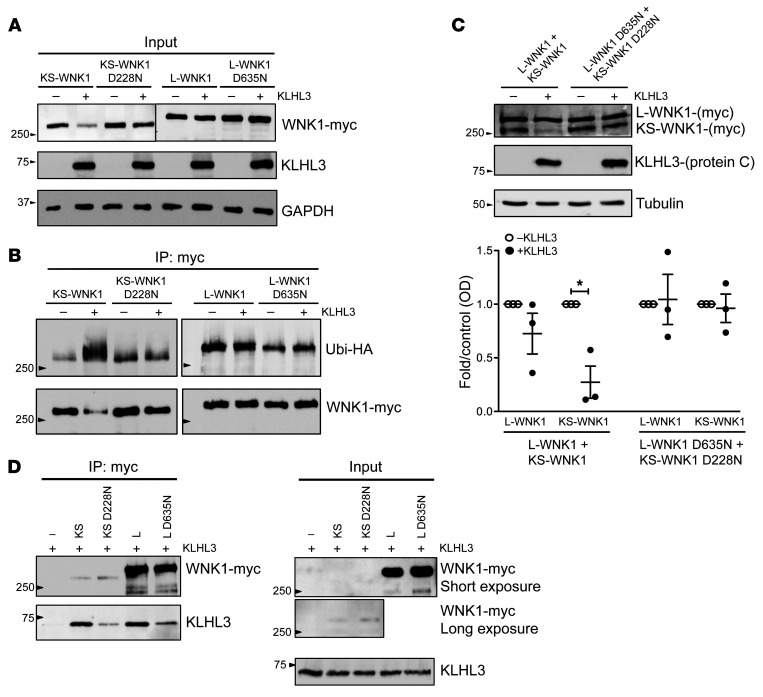
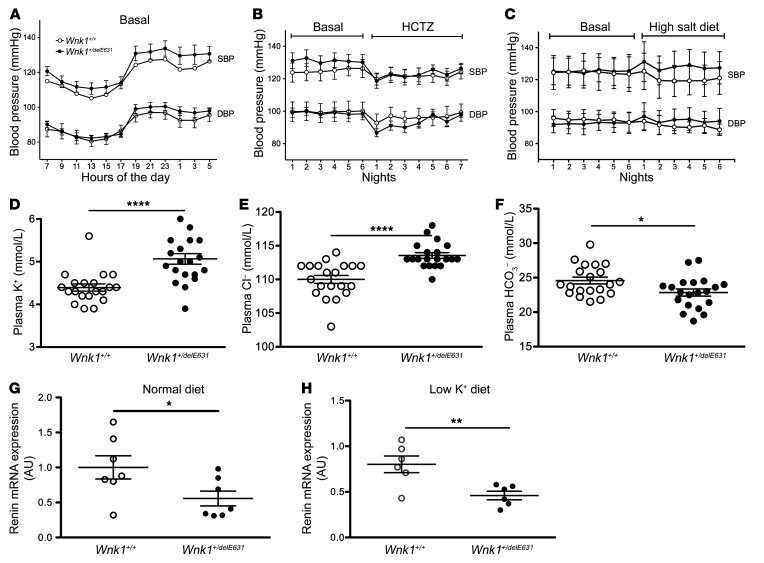
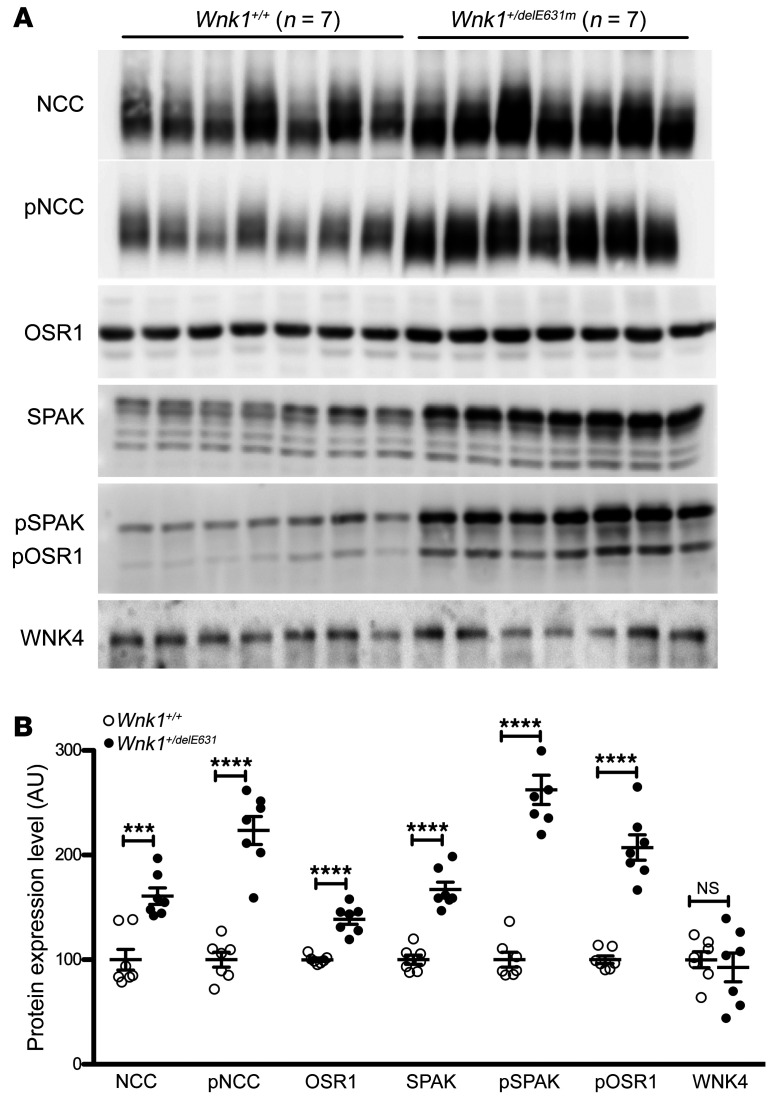
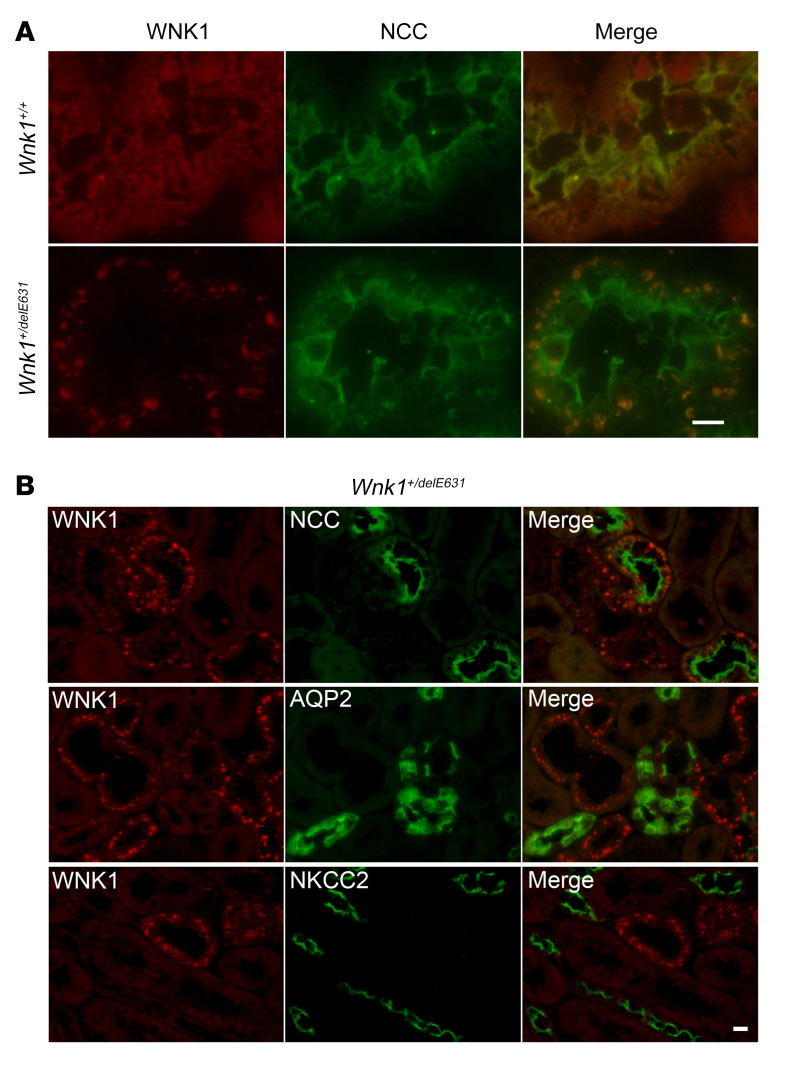
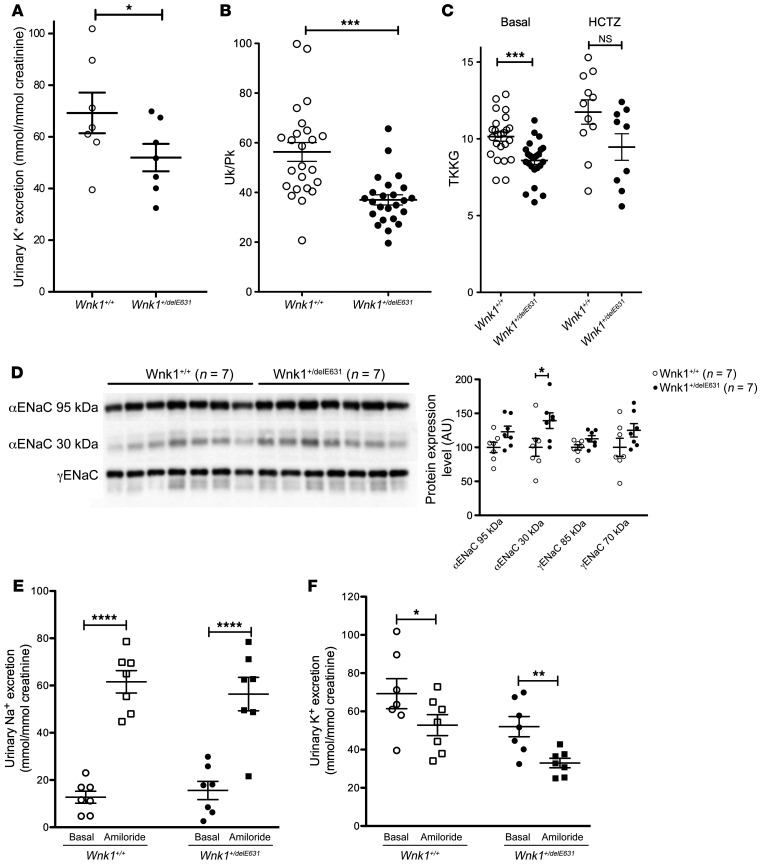
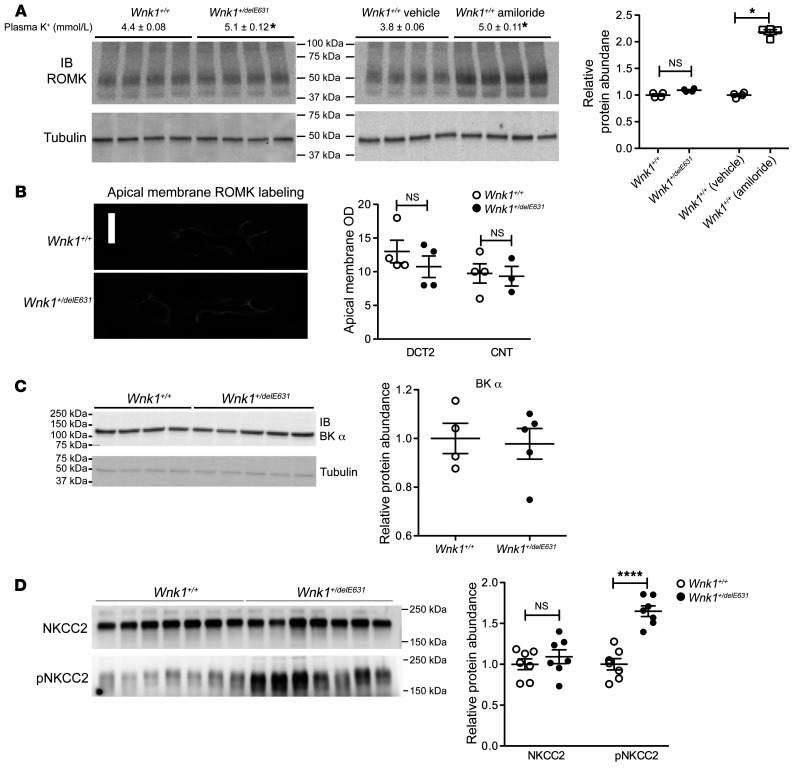
Gain-of-function mutations in with no lysine (K) 1 (WNK1) and WNK4 genes are responsible for familial hyperkalemic hypertension (FHHt), a rare, inherited disorder characterized by arterial hypertension and hyperkalemia with metabolic acidosis. More recently, FHHt-causing mutations in the Kelch-like 3-Cullin 3 (KLHL3-CUL3) E3 ubiquitin ligase complex have shed light on the importance of WNK's cellular degradation on renal ion transport. Using full exome sequencing for a 4-generation family and then targeted sequencing in other suspected cases, we have identified new missense variants in the WNK1 gene clustering in the short conserved acidic motif known to interact with the KLHL3-CUL3 ubiquitin complex. Affected subjects had an early onset of a hyperkalemic hyperchloremic phenotype, but normal blood pressure values"Functional experiments in Xenopus laevis oocytes and HEK293T cells demonstrated that these mutations strongly decrease the ubiquitination of the kidney-specific isoform KS-WNK1 by the KLHL3-CUL3 complex rather than the long ubiquitous catalytically active L-WNK1 isoform. A corresponding CRISPR/Cas9 engineered mouse model recapitulated both the clinical and biological phenotypes. Renal investigations showed increased activation of the Ste20 proline alanine-rich kinase-Na+-Cl- cotransporter (SPAK-NCC) phosphorylation cascade, associated with impaired ROMK apical expression in the distal part of the renal tubule. Together, these new WNK1 genetic variants highlight the importance of the KS-WNK1 isoform abundance on potassium homeostasis.

Keywords: Epithelial transport of ions and water; Genetic diseases; Genetics; Nephrology; Protein kinases.


Conflict of interest statement

Conflict of interest: RU is currently working in early clinical development and early cardiovascular, renal, and metabolism studies at R&D BioPharmaceuticals and AstraZeneca.

Figures

Figure 1
Figure 1. Missense variant in the WNK1 acidic motif in the FHHt pedigree 29.
(A) Kindred 29: family affected by FHHt composed of 7 affected (black) and 6 unaffected (white) members. Arrow indicates the index case. Asterisks indicate exome-sequenced individuals. (B) Electrophoregram obtained by Sanger sequencing showing the double-peak A/T corresponding to the WNK1 heterozygous mutation (c.1905T>A; P.Asp635Glu).
Figure 2
Figure 2. Acidic motif WNK1 mutations.
(A) Schematic representation of the WNK1 gene. The coordinates of the different exons are indicated above or below the structure with ex7 and ex25 (gray), which code for the conserved acidic and basic motifs. The proximal promoter (pP) drives the expression of the long ubiquitous kinase active isoform (L-WNK1), whereas the renal promoter (rP) drives the expression of the kinase defective kidney-specific isoform (KS-WNK1). (B) Schematic linear structure of LWNK1 and KS-WNK1. The kinase domain is represented in full black, the autoinhibitory domain (AID) is striped, coiled-coil domain 1 (CC1) and CC2 are represented in gray, and the conserved acidic motif (AM) and basic motif (BM) are represented in red. (C) Location and sequences of the mutated residues clustering in the acidic motif. The brackets indicate the number of unrelated affected subjects for each mutation. On the lower right are shown the Sanger sequencing electrophoregrams showing the various missense WNK1 mutations. (D) Conservation of the acidic motif showing residues mutated in FHHt among human WNK family members. The previously described WNK4 mutations are indicated in red; those at WNK1 and identified in this study in blue. All are located at completely conserved residues. The bottom part shows the conservation of the WNK1 acidic motif across species. The mutated residues are indicated in bold.
Figure 3
Figure 3. Differential effect of the WNK1 Ex7 G1900A (A634T-L-WNK1; A227T-KS-WNK1) variant on the interaction between KLHL3 and L-WNK1 or KS-WNK1 isoforms.
(A) Representative immunoblot of proteins extracted from X. laevis oocytes (left panel) that were injected with WT or mutant L-WNK1 or KS-WNK1 in the absence or presence of KLHL3 cRNA, as stated. The upper blot shows c-myc–positive bands corresponding to L-WNK1 and KS-WNK1. The middle blot shows unspecific upper band present in all lanes (*), including water-injected oocytes, and a lower band corresponding to KLHL3 only present in KLHL3-injected oocytes. The lower blot shows actin. Densitometry of several (n = 3) blots in which the effect of KLHL3 was tested in L-WNK1 or KS-WNK1 WT or mutants separately (right panel). In the absence of KLHL3, mean values were arbitrarily set to 1.0, and in the presence of KLHL3, values were normalized accordingly. *P < 0.05; **P < 0.01, unpaired Student’s t test. (B) Representative immunoblot of proteins extracted from X. laevis oocytes (left panel) that were injected with mixture of WT or mutant L-WNK1 and KS-WNK1 in the absence or presence of KLHL3 cRNA in order to analyze the consequences of L-WNK1 and KS-WNK1 coexpression. Immunoblot (left panel) and densitometry analysis of several blots (right panel) are as in Figure 3A.
Figure 4
Figure 4. KLHL3 interaction with WNK1 isoforms in HEK293T cells: KLHL3 ubiquitinates KS-WNK1 and significantly reduces its protein levels.
(A) Flp-In T-Rex 293 cells stably and inducibly expressing (His)6-protein C-Flag-hKLHL3 were transfected with myc-tagged L-WNK1 (WT or D635N mutant) or KS-WNK1 (WT or D228N mutant), as indicated. At 34 hours after transfection, cells were induced with tetracycline. Fourteen hours later (48 hours after transfection), cells were harvested and lysed in denaturing conditions. Cell lysates were subjected to immunoblot analysis with the indicated antibodies. Data shown are representative of 3 independent experiments. (B) Flp-In T-Rex 293 cells stably and inducibly expressing (His)6-protein C-Flag-hKLHL3 were transfected with ubiquitin-HA and myc-tagged L-WNK1, L-WNK1 D635N, KS-WNK1 or KS-WNK1 D228N, as indicated. At 34 hours after transfection, cells were induced with tetracycline. Fourteen hours later (48 hours after transfection), cells were harvested and lysed in denaturing conditions. Upper panel: Myc-tagged WNK1 isoforms were immunoprecipitated with anti-myc antibody (9B11, Cell Signaling Technology); immunoprecipitates were analyzed by immunoblotting with anti-HA antibody (3724S; Cell Signaling Technology). Nitrocellulose membranes were stripped and reblotted with anti-myc antibody. Immunoblot of cell lysates is represented in D (input). Data shown are representative of 3 independent experiments. (C) Cells were transfected with myc-tagged L-WNK1 (WT or D635N mutant) and KS-WNK1 (WT or D228N mutant), as indicated and in conditions similar to those in A. Cell lysates were subjected to immunoblot analysis with the indicated antibodies. Densitometric analysis was performed using FUJI FILM Multi-Gauge software. Results are shown as mean ± SEM. *P < 0.05 compared with control, unpaired Student’s t test. n = 3. (D) Flp-In T-Rex 293 cells stably and inducibly expressing (His)6-protein C-Flag-hKLHL3 were transfected with myc-tagged L-WNK1, L-WNK1 D635N, KS-WNK1, or KS-WNK1 D228N, as indicated. At 43 hours after transfection, cells were induced with tetracycline and simultaneously treated with MG132 for 5 hours. At 48 hours after transfection, cells were harvested and lysed in native conditions. Left panel: cell lysates were immunoprecipitated with anti-myc antibody, and immunoprecipitates were analyzed by immunoblotting with anti-protein C and anti-myc antibodies. Right panel: cell lysates (input) were subjected to immunoblot analysis with anti-myc and anti–protein C antibodies (HPC4, Roche) to check for even expression of KLHL3. Data shown are representative of 3 independent experiments.
Figure 5
Figure 5. Normal BP on both normal and high-salt diet in Wnk1+/delE631 mice.
(AC) SBP and DBP profiles over 24 hours of SBP and DBP under a12-hour day/12-hour night schedule in Wnk1+/+ (n = 6) and Wnk1+/delE631 (n = 7) mice examined with a telemetric system under basal conditions (A). Night SBP and DBP of the same mice before (6 nights = basal) or during (7 nights) oral administration of HCTZ (240 mg/kg/d) (B). Night SBP and DBP of another group of mice (n = 4 Wnk1+/+, n = 4 Wnk1+/delE631) before (6 nights = basal) or during (6 nights) the administration of high (3%) Na+ diet (C). (DF) Biological characteristics. In the mutant mice, significant hyperkalemia (5.1 ± 0.5 vs. 4.3 ± 0.2 mmol/L, P < 0.0001; n = 20) (D); hyperchloremia (114 ± 2 vs. 110 ± 3 mmol/L, P < 0.0001; n = 20) (E); and metabolic acidosis (HCO3, 22.8 ± 2.1 vs. 24.6 ± 2.5 mmol/L, P < 0.05; n = 20) (F) were observed together with normal creatinine values (not shown). Data are represented as mean ± SEM. Statistical comparisons were made using unpaired Student’s t test. (G and H) Renin expression. Levels of renin mRNA were measured by RT-qPCR in the kidney cortex of Wnk1+/+ (n = 7) and Wnk1+/delE631 (n = 7) mice in baseline conditions (G) or of Wnk1+/+ (n = 6) and Wnk1+/delE631 (n = 6) mice fed a low (0%) K+ diet (H). Results (mean ± SEM) are expressed in arbitrary units relative to the expression of ubc. The expression level in Wnk1+/+ mice under basal conditions was arbitrarily set to 1. *P< 0.05; **P < 0.01; ****P < 0.0001, unpaired Student’s t test.
Figure 6
Figure 6. Activation of the SPAK-NCC phosphorylation cascade in Wnk1+/delE631 mice.
(A) Representative immunoblots with the indicated antibodies performed on the membrane-enriched fractions (NCC and pNCC) or total homogenates of the renal cortex of mice of each genotype. (B) Densitometric analysis. NCC, SPAK, and OSR1 abundance and phosphorylation are increased in Wnk1+/delE631 mice compared with Wnk1+/+ mice. WNK4 expression is similar between the 2 groups of mice. The expression level in Wnk1+/+ mice was arbitrarily set to 100. Data are represented as mean ± SEM. ***P < 0.001 ; **** P < 0.0001, unpaired Student’s t test.
Figure 7
Figure 7. The DCTs of Wnk1+/delE631 mice contain large WNK bodies.
(A) Immunofluorescence experiments using WNK1 and NCC antibodies. While only small puncta are observed in Wnk1+/+ DCT, large WNK1-positive structures are found in Wnk1+/delE631 DCT, resembling the previously described WNK bodies. Scale bar: 10 μm. (B) Costaining with NCC, AQP2, and NKCC2 revealed that these bodies are localized in the DCT and CNT/CCD, but not in Henle’s loop. Scale bar: 20 μm.
Figure 8
Figure 8. Abnormal K+ handling in Wnk1+/delE631 mice.
(AC) Decreased UK+ excretion, Uk/Pk ratio, and TTKG. (A) Urinary K+ excretion was lower in Wnk1+/delE631 (n = 7, 52 ± 5.3 mmol/mmol creatinine) than in Wnk1+/+ mice (n = 7, 69.3 ± 7.9 mmol/mmol creatinine). *P < 0.05, unpaired Student’s t test. (B) Basal urinary/plasma ratio of K+ concentration was lower in Wnk1+/delE631 (n = 24, 37.2 ± 2.1) than in Wnk1+/+ mice (n = 24, 56.3 ± 3.8). ***P < 0.0001, unpaired Student’s t test. (C) TTKG was significantly lower in Wnk1+/delE631 (n = 24, 8.6 ± 0.3) than in Wnk1+/+ mice (n = 24, 10.1 ± 0.3). ***P = 0.0003. Following 4-day HCTZ oral (240 mg/kg/d) administration, the difference in TTKG between Wnk1+/+ and Wnk1+/delE631 remained the same (9.5 ±0.9 versus 11.8 ±0.8, respectively) although no more significant (P = 0.068), likely because of the smaller number of animals studied (n = 9 and n = 11, respectively). Statistical comparisons were made using unpaired t tests. (D) ENaC expression. Representative immunoblots with the indicated antibodies performed on the membrane-enriched fractions of the renal cortex of mice of each genotype. Densitometric analysis. The abundance of the cleaved form of the α-subunit of ENaC was significantly increased in Wnk1+/delE631 mice compared with Wnk1+/+ mice. The expression level in Wnk1+/+ mice was arbitrarily set to 100. Data are represented as mean ± SEM.*P < 0.05, unpaired Student’s t test. (E and F) Natriuretic and kaliuretic response to amiloride. Urinary Na+ (E) and K+ (F) excretion in response to amiloride injection. Wnk1+/+ and Wnk1+/delE631 males (n = 7 in each group) were housed in metabolic cages and received 1 injection of vehicle or amiloride on 2 consecutive days. Urine was collected 6 hours after injection. Data are represented as mean ± SEM. *P < 0.05; **P< 0.01; ****P < 0.0001 versus vehicle, unpaired Student’s t test.
Figure 9
Figure 9. Expression of ROMK, BK channel, and NKCC2.
(A) ROMK protein abundance. No change in cortical ROMK expression was observed in Wnk1+/delE631 (n = 4) vs. littermate Wnk1+/+ (n = 4) mice, despite the latter group having significantly higher plasma K+ levels (4.4 ± 0.08 mM, n = 20 vs. 5.1 ± 0.12 mM, n = 20). Conversely, a more than 2-fold increase was observed in Wnk1+/+ mice treated by amiloride (25 mg/kg/d for 4 days) achieving a similar rise in plasma potassium (Wnk1+/+ vehicle: 3.8 ± 0.06 mM, n = 4 vs. Wnk1+/+ amiloride: 5.0 ± 0.11 mM). Quantification of cortical ROMK expression (n = 4 per group). *P < 0.05, t test. (B) ROMK immunofluorescence in the distal tubule. Left panel: immunolocalization of ROMK in the DCT2 of Wnk1+/+ and Wnk1+/delE631 mice. Right panel: analysis of membrane labeling intensity showed no change in ROMK apical expression in the DCT2 and CNT of Wnk1+/delE631 mice (n = 4 animals per genotype). Scale bar: 10 microns. (C) Basal BK α channel protein abundance in Wnk1+/delE631 mice and Wnk1+/+ littermates. BK α immunoblots (left panel) and quantification (right panel) demonstrate that cortical BK α expression is unchanged between Wnk1+/+ (n = 4) and Wnk1+/delE631 mice (n = 5). (D) Basal NKCC2 and P-NKCC2 protein abundance in Wnk1+/delE631 mice and Wnk1+/+ littermates. (n = 7 per group). NKCC2 and pNKCC2 immunoblots (left panel) and quantification (right panel) demonstrate that NKCC expression is unchanged between Wnk1+/+ (n = 7) and Wnk1+/delE631 mice (n = 7), but pNKCC2 is significantly increased in Wnk1+/delE631 mice compared with Wnk1+/+. ****P < 0.0001, unpaired Student’s t test.

References

    1. Gordon RD, et al. In: Brenner JHLaBM ed. Hypertension: Pathology, Diagnosis and Management. Raven Press Ltd; 1995:2111–2113.
    1. Wilson FH, et al. Human hypertension caused by mutations in WNK kinases. Science. 2001;293(5532):1107–1112. doi: 10.1126/science.1062844. - DOI - PubMed
    1. Boyden LM, et al. Mutations in kelch-like 3 and cullin 3 cause hypertension and electrolyte abnormalities. Nature. 2012;482(7383):98–102. doi: 10.1038/nature10814. - DOI - PMC - PubMed
    1. Louis-Dit-Picard H, Hadchouel J, Jeunemaitre X. [KLHL3 and CULLIN-3: new genes involved in familial hypertension] Med Sci (Paris) 2012;28(8–9):703–706. - PubMed
    1. Ohta A, et al. The CUL3-KLHL3 E3 ligase complex mutated in Gordon’s hypertension syndrome interacts with and ubiquitylates WNK isoforms: disease-causing mutations in KLHL3 and WNK4 disrupt interaction. Biochem J. 2013;451(1):111–122. doi: 10.1042/BJ20121903. - DOI - PMC - PubMed

Publication types

MeSH terms