. 2020 Aug 13;15(8):e0236581.
doi: 10.1371/journal.pone.0236581. eCollection 2020.

Ecological factors associated with persistent circulation of multiple highly pathogenic avian influenza viruses among poultry farms in Taiwan during 2015-17

Affiliations

Ecological factors associated with persistent circulation of multiple highly pathogenic avian influenza viruses among poultry farms in Taiwan during 2015-17

Wei-Shan Liang et al. PLoS One. .

Abstract

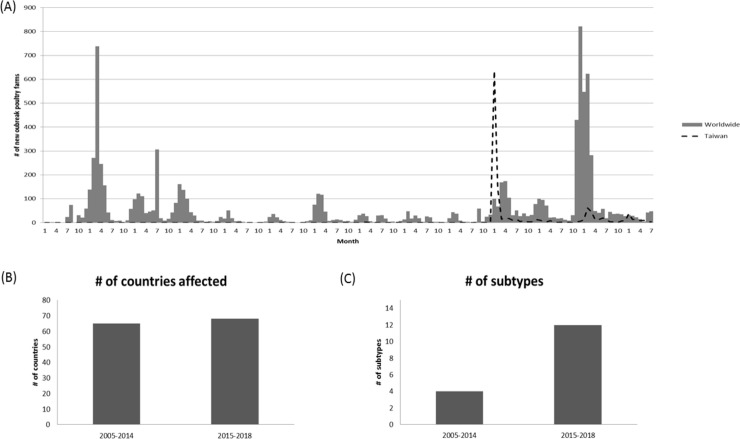
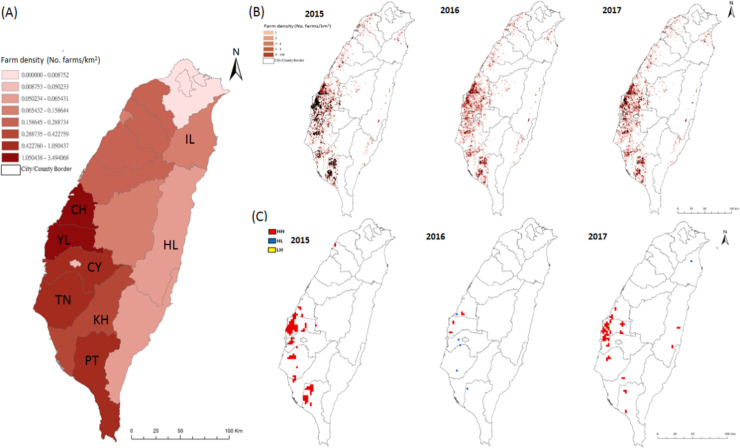
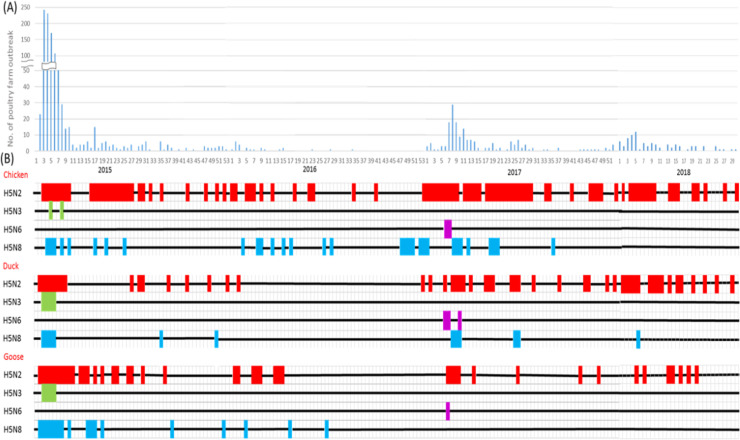
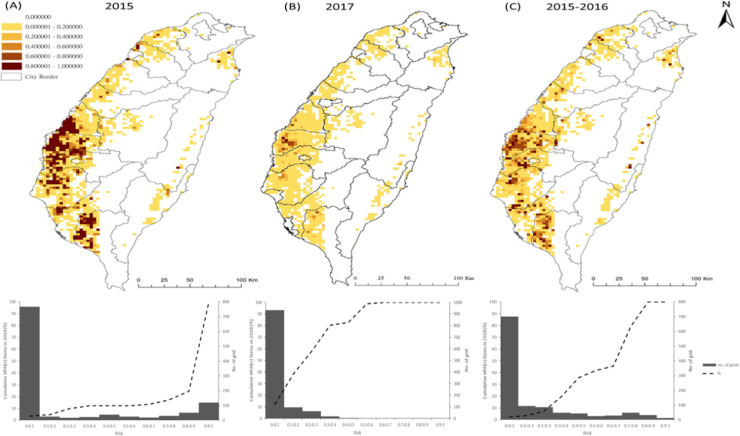
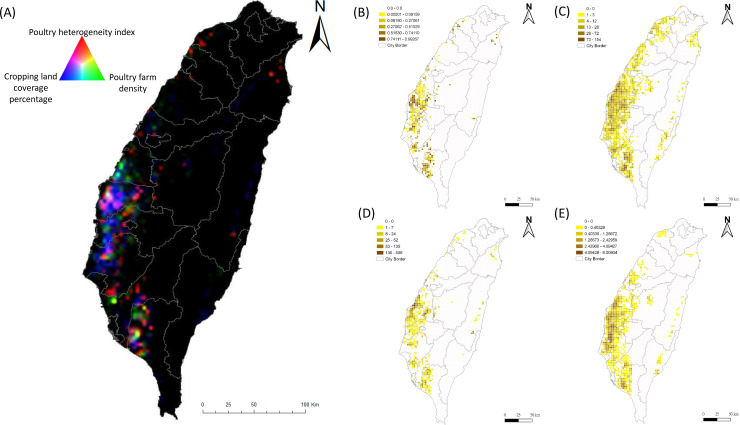
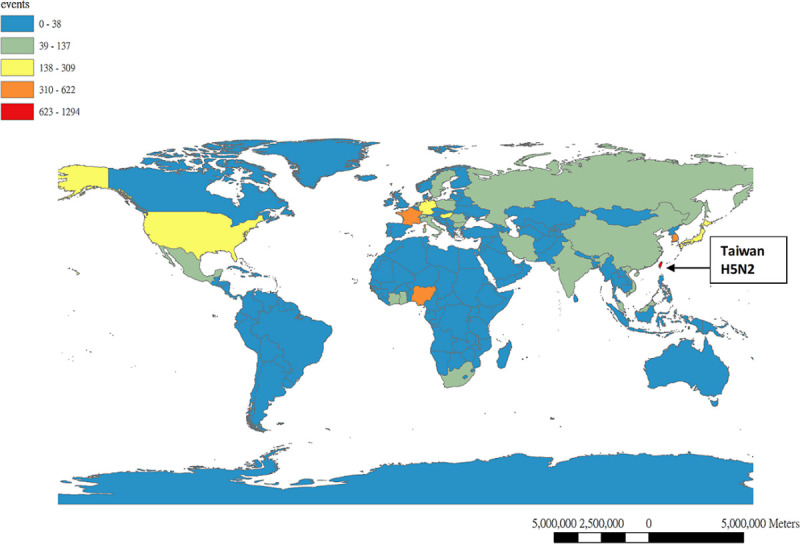
Emergence and intercontinental spread of highly pathogenic avian influenza A (HPAI) H5Nx virus clade 2.3.4.4 has resulted in substantial economic losses to the poultry industry in Asia, Europe, and North America. The long-distance migratory birds have been suggested to play a major role in the global spread of avian influenza viruses during this wave of panzootic outbreaks since 2013. Poultry farm epidemics caused by multiple introduction of different HPAI novel subtypes of clade 2.3.4.4 viruses also occurred in Taiwan between 2015 and 2017. The mandatory and active surveillance detected H5N3 and H5N6 circulation in 2015 and 2017, respectively, while H5N2 and H5N8 were persistently identified in poultry farms since their first arrival in 2015. This study intended to assess the importance of various ecological factors contributed to the persistence of HPAI during three consecutive years. We used satellite technology to identify the location of waterfowl flocks. Four risk factors consistently showed strong association with the spatial clustering of H5N2 and H5N8 circulations during 2015 and 2017, including high poultry farm density (aOR:17.46, 95%CI: 5.91-74.86 and 8.23, 95% CI: 2.12-54.86 in 2015 and 2017, respectively), poultry heterogeneity index (aOR of 12.28, 95%CI: 5.02-31.14 and 2.79, 95%CI: 1.00-7.69, in 2015 and 2017, respectively), non-registered waterfowl flock density (aOR: 6.8, 95%CI: 3.41-14.46 and 9.17, 95%CI: 3.73-26.20, in 2015 and 2017, respectively) and higher percentage of cropping land coverage (aOR of 1.36, 95%CI: 1.10-1.69 and 1.04, 95%CI: 1.02-1.07, in 2015 and 2017, respectively). Our study highlights the application of remote sensing and clustering analysis for the identification and characterization of environmental factors in facilitating and contributing to the persistent circulation of certain subtypes of H5Nx in poultry farms in Taiwan.


Conflict of interest statement

The authors have declared that no competing interests exist.

Figures

Fig 1
Fig 1. Global domestic bird outbreaks due to Highly Pathogenic Influenza Virus (HPAIV) from Jan., 2005 to Jul., 2018.
(A) Numbers of new outbreak in domestic poultry farms affected by HPAIV worldwide and Taiwan from 2005 to 2018 by month. (B) Comparison of the number of countries affected by HPAIV in domestic birds between 2005–2014 and 2015–2018. (C) Comparison of the number of subtypes reported in domestic birds between 2005–2014 and 2015–2018. Data was extracted from World Animal Health Information System (WAHIS), World Organization for Animal Health (OIE).
Fig 2
Fig 2. Spatial distribution of poultry farm density and the presence of Highly Pathogenic Avian Influenza (HPAI) H5Nx in poultry farms and identified hotspot area in Taiwan from 2015 to 2017.
(A) Poultry farm density calculated by numbers of farms per square kilometer for each city/county. The drawn border of the polygons indicated 19 administrative areas, including 10 counties and 9 cities. Alphabetic letter indicated the name of county: CH-Chang-Hwa, YL-Yun-Lin, CY-Chia-Yi, TN-Tai-Nan, KH-Kao-Hsiung, PT-Ping-Tung and HL-Hua-Lien. (B) Distribution of poultry farm plotted by numbers of farms in 3x3 grid with 3 kilometer for each side of the grid. Each solid black dot indicated one outbreak poultry farm. (C) Spatial clustering of HPAI outbreak farms under 3x3 km2 size of grid identified by Local Moran’s I spatial autocorrelation analyses from 2015 to 2017. HH, indicated high-high hotspot area; HL indicated high-low hotspot area; LH indicated low-high hotspot area.
Fig 3
Fig 3. Temporal distribution of Highly Pathogenic Avian Influenza (HPAI) H5Nx in poultry farms by subtypes in Taiwan from Jan., 2015 to Jul., 2018.
(A) Epidemic curve of HPAI outbreak farms by week during 2015–2018. (B) Timeline of the appearance of HPAI by poultry type and H5Nx virus subtype. The color code for each subtype is H5N2 (red), H5N3 (green), H5N6 (purple), and H5N8 (cyane). The timeline plotted by week corresponded to the time axis plotted in (A).
Fig 4
Fig 4
Risk maps and prediction validation based on different regression modeling on 2015 (A), 2017 (B) and 2015–2016 hot-spot areas. (Top panel) The distribution of probability of becoming HPAI-affected hot spots. (Bottom panel) Cumulative percentage of HPAI-affected outbreak poultry farms confirmed during Jan-Jul, 2018 over ranges of risk.
Fig 5
Fig 5. Spatial distribution of predictor variables responsible for the persistence of H5N2 and H5N8 HPAI H5-subtypes among poultry farms in Taiwan.
(A) RGB composite plot of the distribution of three predictor variables: poultry heterogeneity index (domestic anseriformes to galliformes density (red), poultry farm density (green), and cropping land coverage percentage (blue). Dark areas correspond to low values and light areas to high values in all 3 predictors. Black indicated no poultry farm. Density map of poultry heterogeneity index (B), all registered poultry farms (C), non-registered waterfowl flocks (D), and non-rice cropping area coverage (E) in Taiwan. Density is expressed as numbers of flocks per 3x3km grid.
Fig 6
Fig 6. Global distribution of HPAI poultry farm outbreaks reported to OIE from Jan. 1, 2009-Jun. 30, 2019.

Similar articles

Cited by

References

    1. Yoon S, Webby R, Webster R (2014) Evolution and ecology of influenza A viruses. Curr Top Microbiol Immunol 385: 359–375. 10.1007/82_2014_396 - DOI - PubMed
    1. Zhang Z, Chen D, Chen Y, Liu W, Wang L, et al. (2010) Spatio-temporal data comparisons for global highly pathogenic avian influenza (HPAI) H5N1 outbreaks. PLoS One 5: e15314 10.1371/journal.pone.0015314 - DOI - PMC - PubMed
    1. Lee D, Bertran K, Kwon J, Swayne D (2017) Evolution, global spread, and pathogenicity of highly pathogenic avian influenza H5Nx clade 2.3.4.4. J Vet Sci 18: 269–280. 10.4142/jvs.2017.18.S1.269 - DOI - PMC - PubMed
    1. Neumann G, Chen H, Gao G, Shu Y, Kawaoka Y (2010) H5N1 influenza viruses: outbreaks and biological properties. Cell Res 20: 51–61. 10.1038/cr.2009.124 - DOI - PMC - PubMed
    1. Smith G, Donis R, World Health Organization/World Organisation for Animal Health/Food and Agriculture Organization (WHO/OIE/FAO) H5 Evolution Working Group (2015) Nomenclature updates resulting from the evolution of avian influenza A(H5) virus clades 2.1.3.2a, 2.2.1, and 2.3.4 during 2013–2014. Influenza Other Respir Viruses 9: 271–276. 10.1111/irv.12324 - DOI - PMC - PubMed

Publication types