. 2020 Aug 13;16(8):e1008082.
doi: 10.1371/journal.pcbi.1008082. eCollection 2020 Aug.

Genotype networks of 80 quantitative Arabidopsis thaliana phenotypes reveal phenotypic evolvability despite pervasive epistasis

Affiliations

Genotype networks of 80 quantitative Arabidopsis thaliana phenotypes reveal phenotypic evolvability despite pervasive epistasis

Gabriel Schweizer et al. PLoS Comput Biol. .

Abstract

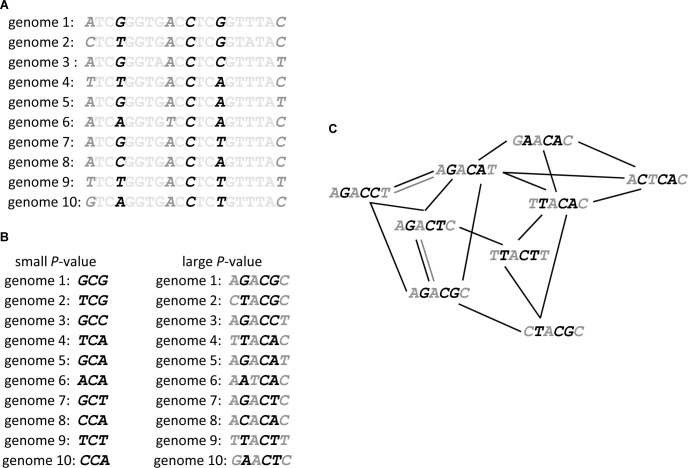
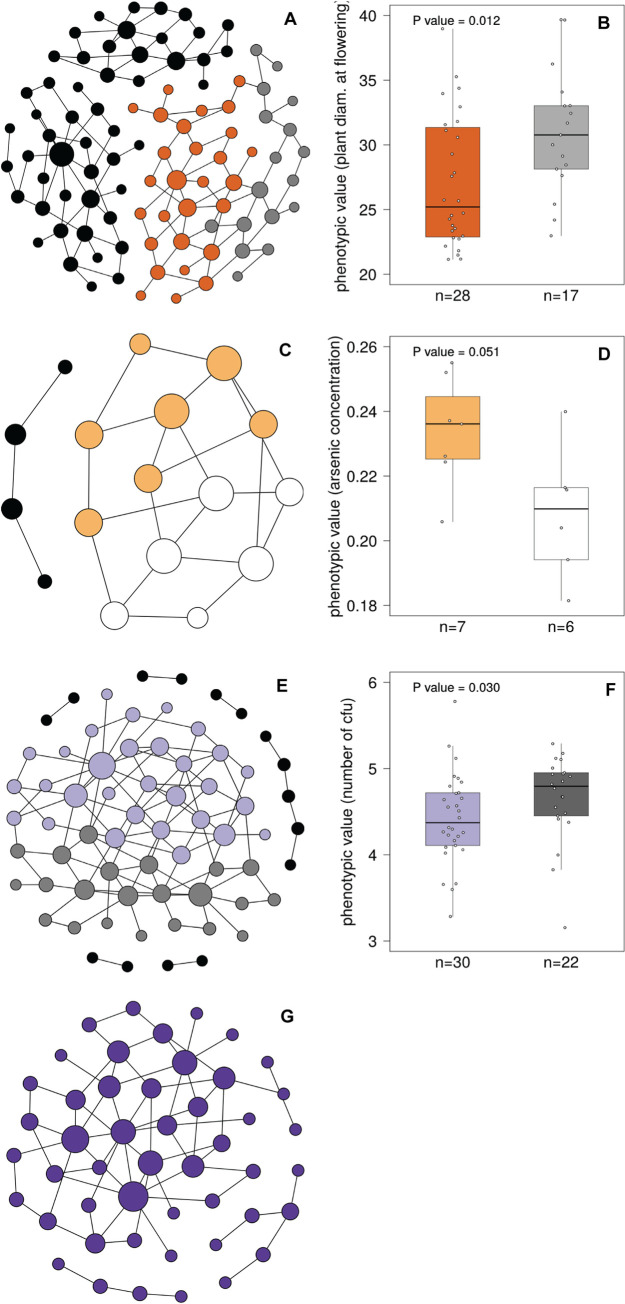
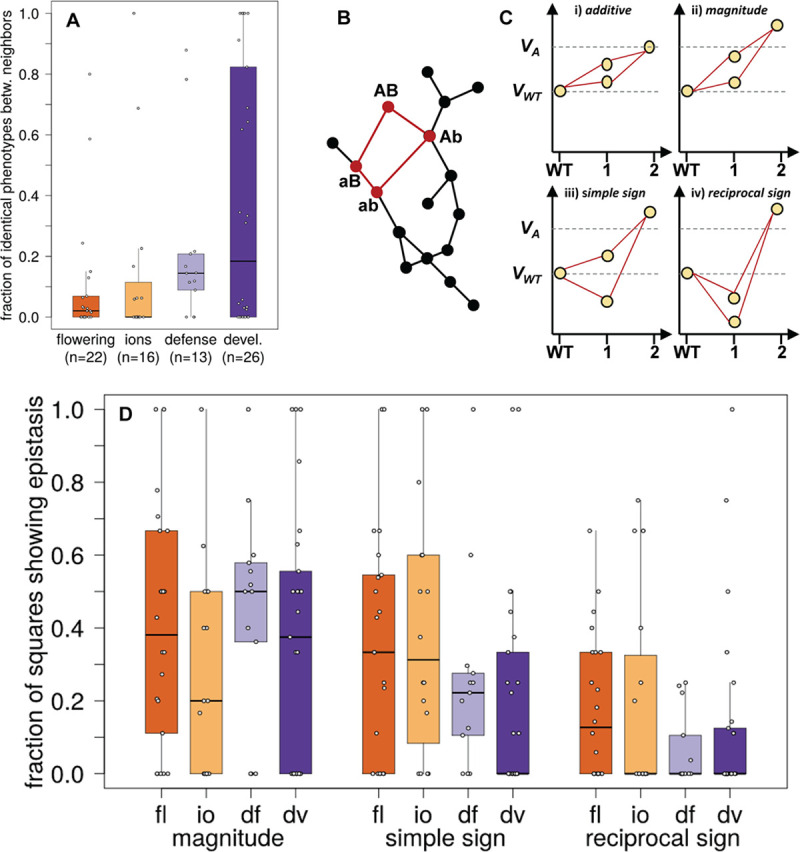
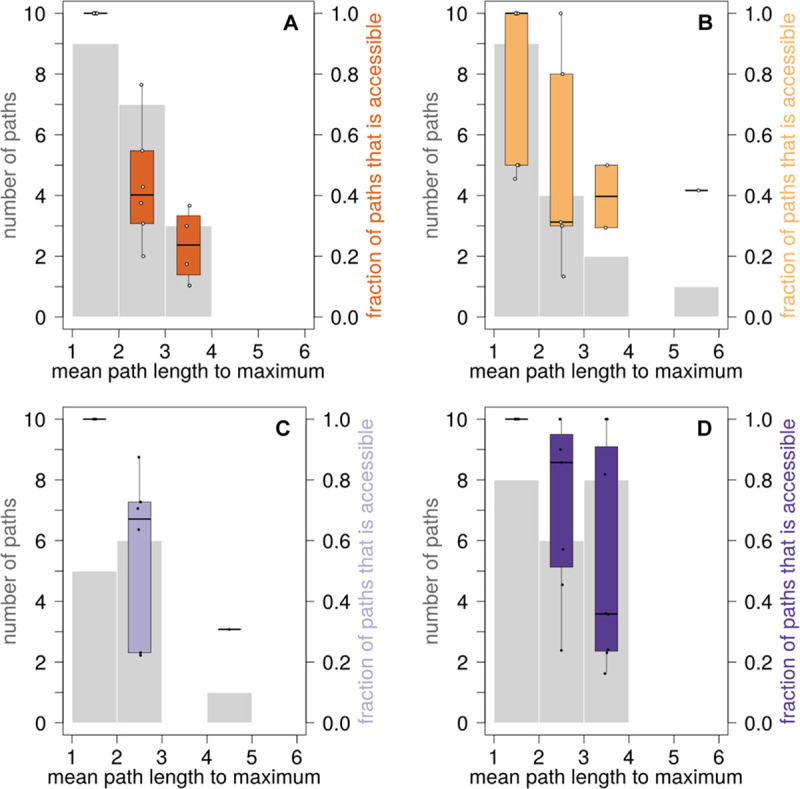
We study the genotype-phenotype maps of 80 quantitative phenotypes in the model plant Arabidopsis thaliana, by representing the genotypes affecting each phenotype as a genotype network. In such a network, each vertex or node corresponds to an individual's genotype at all those genomic loci that affect a given phenotype. Two vertices are connected by an edge if the associated genotypes differ in exactly one nucleotide. The 80 genotype networks we analyze are based on data from genome-wide association studies of 199 A. thaliana accessions. They form connected graphs whose topography differs substantially among phenotypes. We focus our analysis on the incidence of epistasis (non-additive interactions among mutations) because a high incidence of epistasis can reduce the accessibility of evolutionary paths towards high or low phenotypic values. We find epistatic interactions in 67 phenotypes, and in 51 phenotypes every pairwise mutant interaction is epistatic. Moreover, we find phenotype-specific differences in the fraction of accessible mutational paths to maximum phenotypic values. However, even though epistasis affects the accessibility of maximum phenotypic values, the relationships between genotypic and phenotypic change of our analyzed phenotypes are sufficiently smooth that some evolutionary paths remain accessible for most phenotypes, even where epistasis is pervasive. The genotype network representation we use can complement existing approaches to understand the genetic architecture of polygenic traits in many different organisms.


Conflict of interest statement

The authors have declared that no competing interests exist.

Figures

Fig 1
Fig 1. How to build a genotype network, illustrated with a hypothetical example.
(A) Genome-wide association studies identify genomic positions affecting a phenotype. This statistical association is expressed with P-values, which are small (≤ 10-9; black type face in this hypothetical example) for genomic positions strongly associated with a phenotype. They are larger (≤ 10-4; dark grey type face) for genomic positions more weakly associated with the genotype. Light grey type face indicates nucleotides with no significant association to the phenotype. (B) Nucleotides at positions significantly associated with a phenotype are concatenated into one nucleotide string. The resulting string will be shorter if only strongly associated positions (smaller P-values) are considered (black letters, left hand side) and longer if also more weakly associated positions are considered (larger P-values, right hand side, black and dark grey letters). (C) Each nucleotide string of significantly associated positions becomes one vertex in a graph that we refer to as a genotype (haplotype) network. Two such vertices are connected by an edge if they differ in exactly one nucleotide. Black edges connect shorter nucleotide strings resulting from smaller P-values, and dark grey edges connect longer nucleotide strings resulting from larger (but still significant) P-values. We note that fewer pairs of nucleotide strings can be connected through edges as the length of nucleotide strings (and the P-value) increases. We note further that in biological data, multiple individuals may have the same genotype at all positions associated with the phenotype. For didactic reasons, our hypothetical example uses multiallelic genome positions, whereas the data we analyze comprises only biallelic positions.
Fig 2
Fig 2. Genotype networks for four example phenotypes from each of the four phenotype categories.
The four depicted networks correspond to the phenotypes plant diameter at flowering (panel A), arsenic concentration (panel C), bacterial growth (panel E), and plant width (panel G). In each network, a vertex (circle) represents a genotype (nucleotide string) and two vertices are connected by an edge if the underlying genotypes differ in one nucleotide. The size of each vertex is proportional to its vertex betweenness, which is the fraction of shortest paths through all vertex pairs that visit this vertex. Each network was laid out by the force-directed Fruchterman-Reingold graph embedding algorithm implemented in Gephi [59]. Networks shown in (A), (C) and (E) can be subdivided into two modules and each vertex in these networks is colored according to its module membership. Vertices of components that are not connected to the largest network component are colored black. Isolated vertices (that is, genotypes without a one-mutant neighbor) are not depicted. No modular structure could be detected in the genotype network of plant width (G). Box plots of panels (B), (D) and (F) show the phenotypic values in each module, where the box color is the same as that of the vertices in panels (A), (C), and (E), respectively. In each box plot, the central horizontal line indicates the median value, the lower and upper box limits correspond to first and third quartiles, whiskers indicate values within the 1.5-fold interquartile range, and each open circle shows one data point (vertex phenotype), illustrating the distribution of the phenotypic values. The number of vertices in each module is indicated as the sample size (n) on the horizontal axis. Phenotypic values differ significantly (Wilcoxon Rank-Sum Test) between genotypes in different modules of the two phenotypes plant diameter at flowering (panel B) and bacterial growth (panel F).
Fig 3
Fig 3. Pervasive epistasis in whole-organism phenotypes.
(A) Fraction of genotype network neighbors with identical phenotypic values. We consider the absolute difference between the phenotypic values of two neighbors as identical if it does not exceed the coefficient of phenotypic variation for accessions with the same genotype at all phenotype-associated loci (Methods). We plot the fraction of neighbors with identical phenotypic values (vertical axis) in the form of a box plot for each of the four phenotype categories (“devel.”: development). The number of phenotypes in each category is shown on the horizontal axis as sample size (n). (B) Detection of epistasis. The presence of squares in a genotype network (highlighted in red) permits the analysis of epistatic interactions. Epistasis is detected by comparing the phenotypic values associated with the four vertices in a square, as shown in panel C. (C) We distinguish different types of epistasis. Vertical axes show phenotypic values in arbitrary units. VWT and VA denote the phenotypic value of the wild type and the expected phenotypic value in an additive (non-epistatic) scenario. The circles in each plot indicate a ‘wild type’ sequence, two of its one-mutant neighbors and the double mutant neighbor as indicated by the horizontal axes (WT, wild type). Panel i: the phenotypic values of the single mutant neighbors are higher than the wild type value, and their sum equals the phenotypic value of the double mutant (additive scenario). Panel ii: the phenotypic values of the single mutant neighbors is again higher than the wild type value, but the value of the double mutant is greater than the sum of the values of the single mutant neighbors (magnitude epistasis). Panel iii: the phenotypic value of one single-mutant neighbor is lower than the value associated with the wild type (simple sign epistasis). Panel iv: The phenotypic values of both single-mutant neighbors are lower than the wild type value (reciprocal sign epistasis). (D) Frequency of different types of epistasis. The vertical axis shows the fraction of squares with magnitude, simple sign, and reciprocal sign epistasis as a box plot, where data are grouped according to the type of epistasis and phenotype category (horizontal axis; “fl”: flowering; “io”: ions; “df”: defense; “dv”: development). In each box plot, the central horizontal line indicates the median value, lower and upper box limits show the values of the first and third quartile, whiskers indicate values within the 1.5-fold interquartile range, and each open circle shows one data point.
Fig 4
Fig 4. Distribution of mutational path lengths to maximum phenotypic values and fraction of accessible paths.
For each phenotype, we calculated the mean length of the mutational path from each vertex in the network to the vertex with the maximum phenotypic value. We show the number of paths (left vertical axes) binned according to path length (horizontal axes, path length between 1 and 2 mutational steps, between 2 and 3 mutational steps, etc.) as indicated by the grey histograms. The colored box plot in each bin shows the fraction of paths to the maximum phenotypic value that is accessible (right vertical axes). Each panel shows the result for one phenotype category, namely flowering (A), ions (B), defense (C), and development (D).

References

    1. Alberch P. From genes to phenotype: dynamical systems and evolvability. Genetica. 1991;84: 5–11. 10.1007/BF00123979 - DOI - PubMed
    1. Schuster P, Fontana W, Stadler PF, Hofacker IL. From sequences to shapes and back: A case study in RNA secondary structures. Proc R Soc B Biol Sci. 1994;255: 279–284. 10.1098/rspb.1994.0040 - DOI - PubMed
    1. Aguirre J, Buldú JM, Stich M, Manrubia SC. Topological structure of the space of phenotypes: The case of RNA neutral networks. PLoS ONE. 2011;6: e26324 10.1371/journal.pone.0026324 - DOI - PMC - PubMed
    1. Lipman DJ, Wilbur WJ. Modelling neutral and selective evolution of protein folding. Proc R Soc B Biol Sci. 1991;245: 7–11. 10.1098/rspb.1991.0081 - DOI - PubMed
    1. Bornberg-Bauer E, Chan HS. Modeling evolutionary landscapes: Mutational stability, topology, and superfunnels in sequence space. Proc Natl Acad Sci. 1999;96: 10689–10694. 10.1073/pnas.96.19.10689 - DOI - PMC - PubMed

Publication types