. 2020 Oct 5;219(10):e201908036.
doi: 10.1083/jcb.201908036.

Nesprins are mechanotransducers that discriminate epithelial-mesenchymal transition programs

Affiliations

Nesprins are mechanotransducers that discriminate epithelial-mesenchymal transition programs

Théophile Déjardin et al. J Cell Biol. .

Abstract

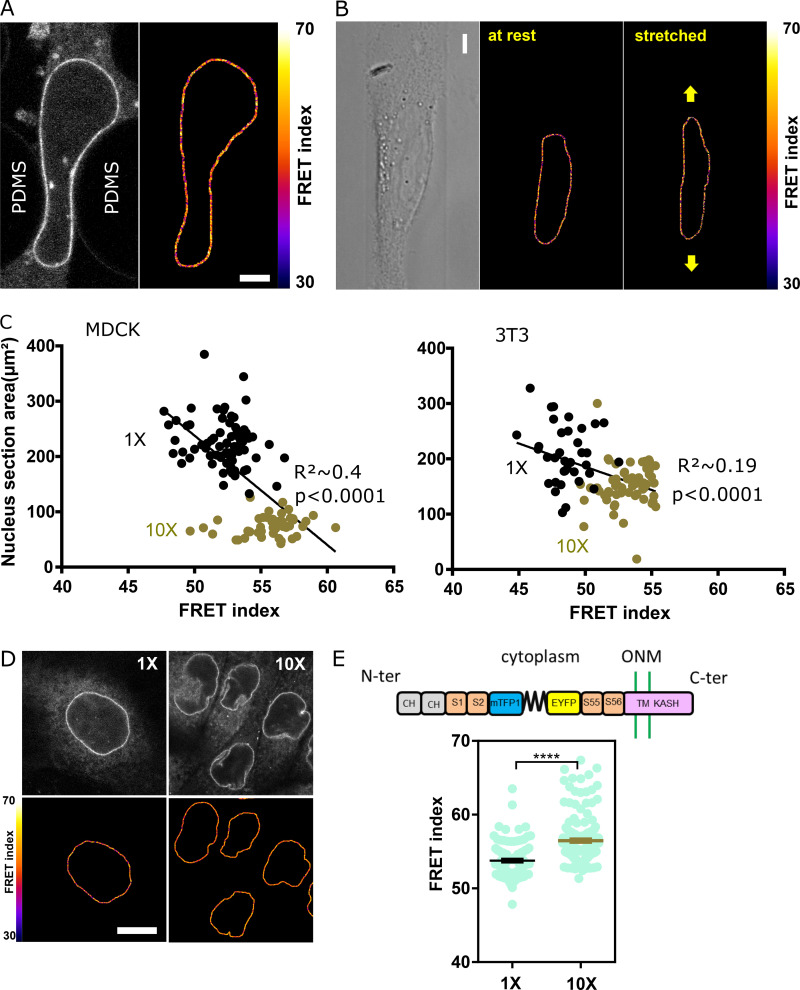
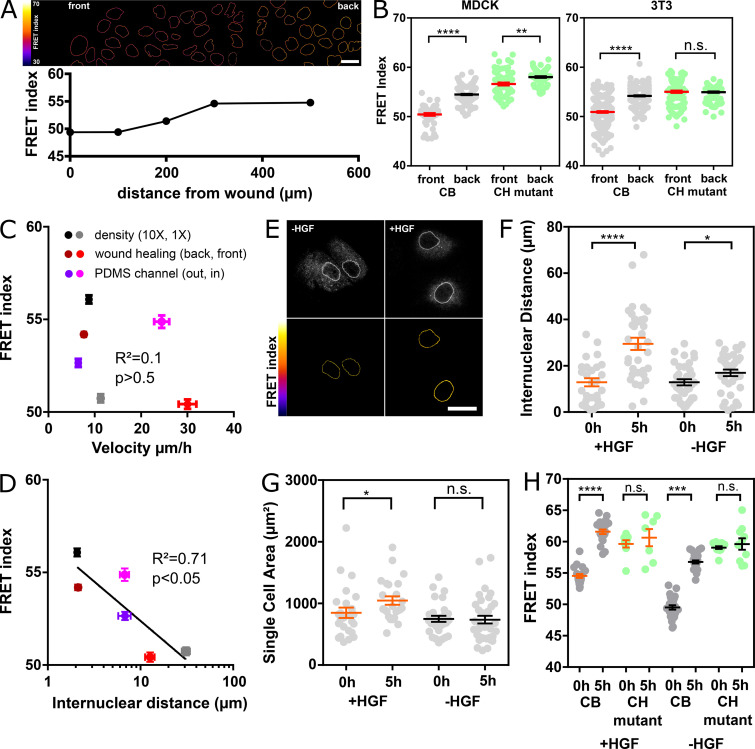
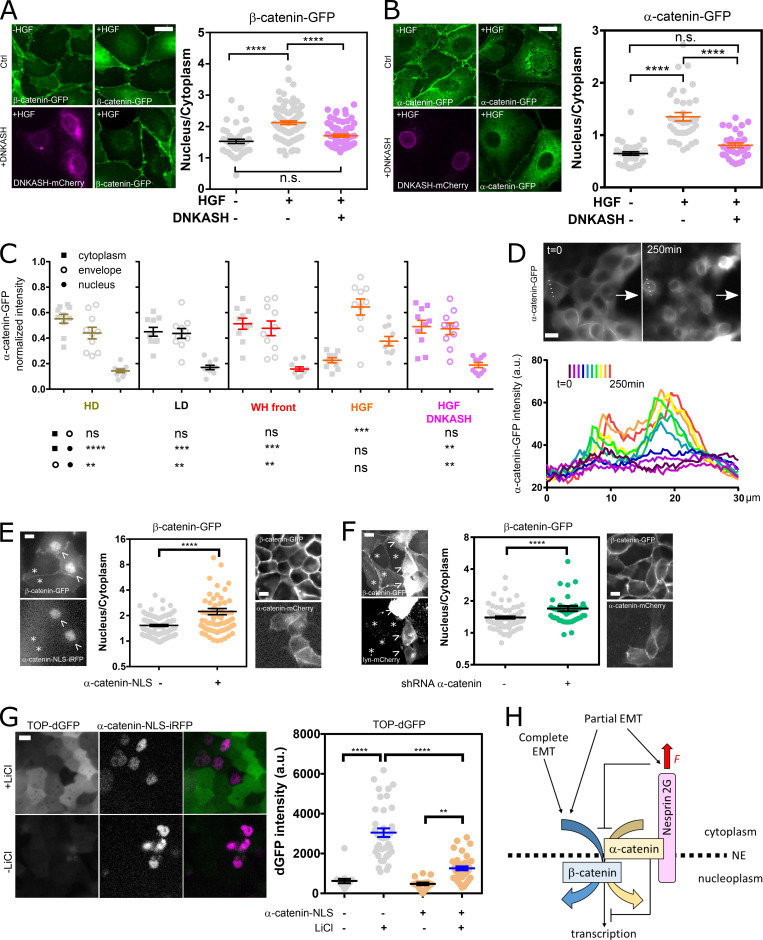
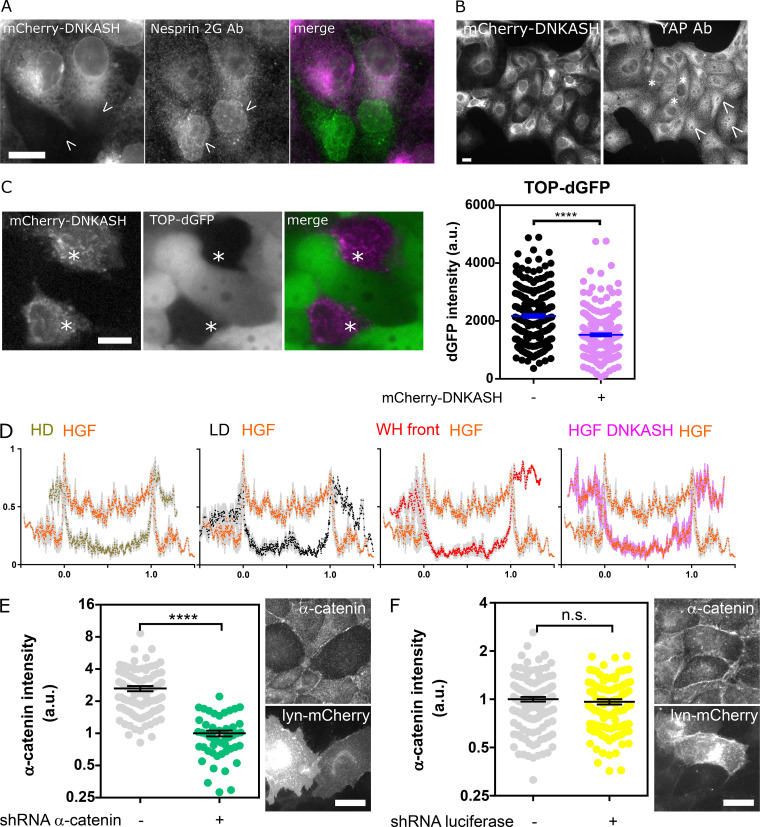
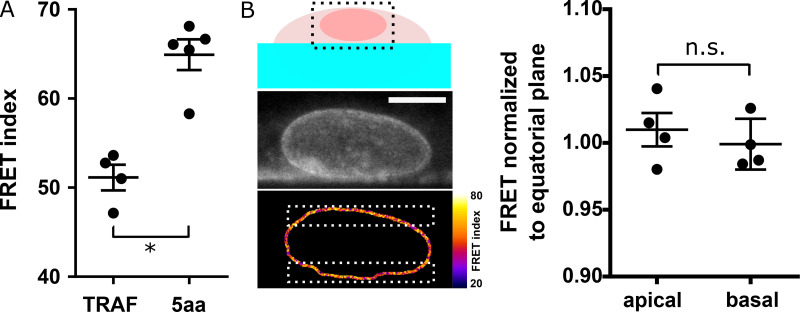
LINC complexes are transmembrane protein assemblies that physically connect the nucleoskeleton and cytoskeleton through the nuclear envelope. Dysfunctions of LINC complexes are associated with pathologies such as cancer and muscular disorders. The mechanical roles of LINC complexes are poorly understood. To address this, we used genetically encoded FRET biosensors of molecular tension in a nesprin protein of the LINC complex of fibroblastic and epithelial cells in culture. We exposed cells to mechanical, genetic, and pharmacological perturbations, mimicking a range of physiological and pathological situations. We show that nesprin experiences tension generated by the cytoskeleton and acts as a mechanical sensor of cell packing. Moreover, nesprin discriminates between inductions of partial and complete epithelial-mesenchymal transitions. We identify the implicated mechanisms, which involve α-catenin capture at the nuclear envelope by nesprin upon its relaxation, thereby regulating β-catenin transcription. Our data thus implicate LINC complex proteins as mechanotransducers that fine-tune β-catenin signaling in a manner dependent on the epithelial-mesenchymal transition program.


Figures

None
Graphical abstract
Figure 1.
Figure 1.
Nesprin is under cytoskeleton-dependent tension. (A) Schematics of the nesprin constructs. CB and CH2 domains. ONM, outer nuclear membrane; S1…S56, spectrin repeat number; TM, transmembrane. (B) Typical nuclei expressing the nesprin constructs above. Top: Direct fluorescence. Bottom: FRET index map. (C) FRET index of the nesprin constructs above in MDCK (left; n = 97 CB, 45 CH mutant, 34 DNKASH, 35 Beyond) and NIH 3T3 (right; n = 88 CB, 89 CH mutant, 60 DNKASH, 62 Beyond) cells; three replicates. (D) FRET index map of the CB construct in MDCK cells before and after 20 min of pharmacological perturbation. Cyto D, cytochalasin D. (E) FRET index of the CB construct and the CH mutant in MDCK cells before and after pharmacological perturbation (n Cyto D = 108 CB, 71 CH mutant; n Y27632 = 74 CB, 30 CH mutant; n colchicine = 112 CB, 88 CH mutant; n EDTA = 48 CB, 52 CH mutant); two replicates. Scale bars = 5 µm. Mean ± SEM. Two-tailed Kruskal-Wallis (C) and Mann-Whitney (E) tests. ***, P < 0.001; ****, P < 0.0001.
Figure S1.
Figure S1.
Validation of CB and CH mutant constructs, with drug treatments. (A) FRET index of the CB construct as a function of its transient expression level in MDCK cells (n = 64; total intensity is the emission intensity sum between 476 and 557 nm encompassing both donor and acceptor emissions); one replicate. Solid line is a linear fit (least-squares linear regression); P value was derived from an extra sum-of-squares F test with slope = 0 as null hypothesis. (B) Nuclear envelope localization of nesprin-1G by immunofluorescence in cells expressing either the CB or the CH mutant construct. Scale bar = 10 µm. (C) Effects of pharmacological treatments on the cytoskeleton. E-cadherin-tandem dimer RFP (two first rows) or α-catenin-GFP cells (other rows, to visualize intercellular contacts) treated as in Fig. 1 D. Control cells exhibit F-actin at contacts and at the ventral surface. Cytochalasin D resulted in dense actin aggregates, Y27632 in an altered cytoplasmic organization with some nuclear envelope recruitment at the expense of ventral stress fibers, and EDTA in a loss of intercellular contacts and subsequent recruitment. Scale bar = 10 µm. (D) FRET index map of the CH construct in MDCK cells before and after pharmacological perturbations. Cyto D, cytochalasin D. Compare with Fig. 1 D. Scale bar = 5 µm.
Figure 2.
Figure 2.
Nesprin tension is sensitive to extracellular compression, stretch, and cell packing. (A) Top: Schematics of an event of cell migration through a narrow constriction. Bottom: Direct fluorescence image and FRET index map from the dotted box above with boundaries between the region within the constriction and that outside it. (B) FRET index of the CB construct and the CH mutant inside and outside constrictions, in MDCK (left; n = 24 CB, 40 CH mutant) and NIH 3T3 (right; n = 48 CB out, 38 CH mutant) cells; three replicates. (C) Top: Schematics of the cell-stretching experiment. Cells are plated on collagen stripes printed on a transparent, elastomeric sheet stretched in the direction of the adhesive stripes. Bottom: Direct fluorescence image and FRET index map from the dotted box above. (D) FRET index change upon stretching of the CB construct and the CH mutant as a function cell and nucleus strains (n = 6 CB, 5 CH mutant). Solid lines are linear fits; three replicates. (E) MDCK cells expressing the CB construct plated at 5 × 10² cells/mm2 (1×) and 5 × 10³ cells/mm2 (10×). Top: Fluorescence; bottom: FRET index map. (F) FRET index of the CB construct and the CH mutant at 1× and 10× densities in MDCK (left; n = 97 CB 1×, 82 CB 10×, 45 CH mutant 1×, 61 CH mutant 10×) and NIH 3T3 (right; n = 88 CB 1×, 120 CB 1×, 89 CH mutant 1×, 152 CH mutant 10×) cells; three replicates. Scale bar = 5 µm. Mean ± SEM. Two-tailed Mann-Whitney tests. *, P < 0.05; **, P < 0.01; ****, P < 0.0001. The color code follows that of Fig. 1.
Figure S2.
Figure S2.
Effects of mechanical perturbations on the CH mutant and nesprin with sensor between SR2 and 55 constructs. (A) Direct fluorescence image and FRET index map of an MDCK cell expressing the CH construct within a constriction. Compare with Fig. 2 A. Scale bar = 5 µm. (B) Direct fluorescence image and FRET index map of an MDCK cell expressing the CH construct plated on a collagen stripe on the stretchable substrate. Compare with Fig. 2 C. Scale bar = 5 µm. (C) Nucleus section area as a function of FRET index for low (1×) and high (10×) cell densities for MDCK (top; n = 73 1×, 45 10×) and NIH 3T3 (right; n = 36 1×, 59 10×) cells; two replicates. Solid lines are linear fits (R2 was derived from a least-squares linear regression; P value was derived from an extra sum-of-squares F test with slope = 0 as null hypothesis). (D) MDCK cells expressing the CH construct plated at 5 × 10² cells/mm2 (1×) and 5 × 10³ cells/mm2 (10×). Top: Fluorescence, bottom: FRET index map. Compare with Fig. 2 E. Scale bar = 10 µm. (E) Top: Schematic illustration of the nesprin construct with the tension sensor inserted between spectrin repeats 2 and 55. ONM, outer nuclear membrane; S1…S56, spectrin repeat number; TM, trans-membrane domain. Bottom: FRET index of the construct illustrated above at 1× and 10× densities in MDCK cells (n = 93 1×, 184 10×). Compare with Fig. 2 F. Mean ± SEM. Two-tailed Mann-Whitney test. ****, P < 0.0001.
Figure 3.
Figure 3.
Nesprin tension is differentially sensitive to induction of partial and complete EMT. (A) Top: FRET index map of a wounded MDCK monolayer expressing the CB construct. Bottom: FRET index as a function of the distance from the front. (B) FRET index of the CB construct and the CH mutant at the front and back (500 µm) of the monolayer in MDCK (left; n = 70 CB front, 130 CB back, 73 CH mutant front, 91 CH mutant back) and NIH 3T3 (right; n = 363 CB front, 311 CB back, 125 CH mutant front, 143 CH mutant back) cells; three replicates. Solid line to guide the eye. (C) FRET index of the CB construct in MDCK cells as a function of cell migration velocity from experiments at low and high cell densities, upon epithelial wounding, and collectively migrating from outside (out) to inside (in) 40-µm-wide channels. R2 was derived from a least-squares linear regression; P value was derived from an extra sum-of-squares F test with slope = 0 as the null hypothesis (n = 240 1×, 255 10×, 111 front, 110 back, 64 in, 78 out, 1 replicate). (D) FRET index of the CB construct in MDCK cells as a function of internuclear distance from experiments at low and high cell densities, upon epithelial wounding, and upon entering 40-µm-wide channels. Solid line is the linear fit. R2 was derived from a least-squares linear regression; P value was derived from an extra sum-of-squares F test with slope = 0 as null hypothesis (n = 22 1×, 22 10×, 22 front, 22 back, 33 in, 18 out, 1 replicate). (E) Direct fluorescence and FRET index maps of the CB construct in MDCK cells after 5 h with or without HGF. (F) Internuclear distance of CB construct–expressing MDCK cells through time with or without HGF addition at time 0 h (n +HGF = 26 0 h, 27 5 h; n –HGF = 30 0 h, 32 5 h); two replicates. (G) Single-cell area of CB construct–expressing MDCK cells through time with or without HGF addition (n +HGF= 25 0 h, 24 5 h; n –HGF = 29 0 h, 35 5 h); two replicates. (H) FRET index of the CB construct and CH mutant in MDCK cells through time with or without HGF addition (n +HGF = 20 CB 0 h, 22 CB 5 h, 9 CH mutant 0 h, 7 CH mutant 5 h; n -HGF = 26 CB 0 h, 26 CB 5 h, 13 CH mutant 0 h, 10 CH mutant 5 h); two replicates. Scale bars = 20 µm. Mean ± SEM. Two-tailed Mann-Whitney tests. *, P < 0.05; **, P < 0.01; ***, P < 0.001; ****, P < 0.0001.
Figure S3.
Figure S3.
Effects of nuclear localization of the CB construct on its tension and of wounding and HGF on the CH mutant construct. (A) FRET index difference between the front and back of a nucleus within leader cells (n = 22); one replicate. Mean ± SEM. Two-tailed Kruskal-Wallis test. (B) FRET index map of a wounded MDCK monolayer expressing the CH construct. Compare with Fig. 3 A. Scale bar = 10 µm. (C) Direct fluorescence and FRET index maps of the CH construct in MDCK cells after 5 h with or without HGF. Compare with Fig. 3 E. Scale bar = 10 µm.
Figure 4.
Figure 4.
Nesprin tension regulates catenin nuclear translocation. (A) Left: MDCK cells stably expressing β-catenin-GFP with and without mCherry-DNKASH, with and without HGF addition. Right: β-Catenin nucleus/cytoplasmic balance (GFP intensity ratio) as a function of HGF and DNKASH (n = 43–, 89+-, 65++); one replicate. (B) Left: MDCK cells stably expressing α-catenin-GFP with and without mCherry-DNKASH, with and without HGF addition. Right: α-Catenin nucleus/cytoplasmic balance (GFP intensity ratio) as a function of HGF and DNKASH (n = 35–, 36+-, 31++); two replicates. (C) Relative cytoplasmic, nuclear envelope, and nuclear levels of α-catenin in cells plated at high density (HD; 10×), low density (LD; 1×), at the wound front (WH, wound healing), upon HGF exposure, and upon HGF exposure and mCherry-DNKASH expression. n = 10 cells for each condition and compartment; two replicates. (D) Top: Front of collectively migrating α-catenin-GFP MDCK cells (arrows indicate direction of migration) before (t = 0) and after cytochalasin D (t = 250 min) treatment. Bottom: α-catenin-GFP intensity along dotted line above through time; one replicate. (E) Left: MDCK cells stably expressing β-catenin-GFP with transient expression of NLS-iRFP-α-catenin (arrowheads) and without (asterisks). Right: β-catenin nucleus/cytoplasmic balance (GFP intensity ratio) as a function of NLS-iRFP-α-catenin expression (n = 112-, 66+); two replicates. (F) Left: MDCK cells stably expressing β-catenin-GFP with transient expression of shRNA against α-catenin and lyn-mCherry (arrow) and without (asterisk). Right: β-catenin nucleus/cytoplasmic balance (GFP intensity ratio) as a function of shRNA/lyn-mCherry cotransfection (n = 102-, 44+); two replicates. (G) Left: MDCK cells stably expressing TOP-dGFP and transiently expressing NLS-iRFP-α-catenin after 10 h with and without LiCl. Right: dGFP intensity as a function of NLS-α-catenin-iRFP expression and LiCl (n = 17—, 39-+, 17+-, 39++); two replicates. (H) Working model. See text for details. Scale bars = 10 µm. Mean ± SEM. Two-tailed Kruskal-Wallis (A–C and H) and Mann-Whitney (E and F) tests. **, P < 0.01; ***, P < 0.001; ****, P < 0.0001.
Figure S4.
Figure S4.
Validation and specificity of the DNKASH construct and α-catenin depletion. (A) MDCK cells transiently expressing mCherry-DNKASH and stained for nesprin 2G. Only nontransfected cells (arrowheads) show nesprin 2G localization at the nuclear envelope. (B) MDCK cells stably expressing mCherry-DNKASH and stained for YAP. Some cells display nuclear YAP (arrowheads), and some do not (asterisks). (C) MDCK cells stably expressing TOP-dGFP and transiently expressing mCherry-DNKASH after 10 h with LiCl. Cells expressing mCherry-DNKASH (asterisks) show lower dGFP levels (n = 216 +mCherry-DNKASH, 216 -mCherry-DNKASH); two replicates. (D) Normalized α-catenin-GFP intensity along a line scan across the nucleus of cells exposed to HGF compared with that of cells plated at high (HD; 10×) and low (LD; 1×) densities, at the front of an epithelial wound, and expressing mCherry-DNKASH with HGF; two replicates. Line scans are averages of three cells, 5 pixels window moving average. 0 and 1 are nuclear envelope positions. (E) Immunofluorescence intensity of α-catenin in MDCK cells cotransfected with a lyn-mCherry construct (as a marker of transfection) and a shRNA against α-catenin (n = 50 sh-, 89 sh+); one replicate. (F) Immunofluorescence intensity of α-catenin in MDCK cells cotransfected with a lyn-mCherry construct and a shRNA against luciferase (n = 97 sh-, 131 sh+); one replicate. Scale bars = 10 µm. Mean ± SEM. Two-tailed Mann-Whitney test (F); Kruskal-Wallis test otherwise. ****, P < 0.0001.
Figure S5.
Figure S5.
FRET calibration and tension dependence on z. (A) FRET index of 5aa and TRAF standards expressed in MDCK cells (n = 4); one replicate. (B) Left: Sketch of a cell growing on the side of a PDMS channel for FRET analysis along z. Direct fluorescence and FRET index of an MDCK cell stably expressing the CB construct from the region in the dotted box above. Right: Normalized FRET index from the white dotted boxes on the left (n = 4); one replicate. Scale bar = 5 µm. Mean ± SEM. Two-tailed Kruskal-Wallis test. *, P < 0.05.

Comment in

References

    1. Aiello N.M., Maddipati R., Norgard R.J., Balli D., Li J., Yuan S., Yamazoe T., Black T., Sahmoud A., Furth E.E., et al. . 2018. EMT subtype influences epithelial plasticity and mode of cell migration. Dev. Cell. 45:681–695.e4. 10.1016/j.devcel.2018.05.027 - DOI - PMC - PubMed
    1. Alam S.G., Zhang Q., Prasad N., Li Y., Chamala S., Kuchibhotla R., KC B., Aggarwal V., Shrestha S., Jones A.L., et al. . 2016. The mammalian LINC complex regulates genome transcriptional responses to substrate rigidity. Sci. Rep. 6:38063 10.1038/srep38063 - DOI - PMC - PubMed
    1. Aoki K., Kumagai Y., Sakurai A., Komatsu N., Fujita Y., Shionyu C., and Matsuda M.. 2013. Stochastic ERK activation induced by noise and cell-to-cell propagation regulates cell density-dependent proliferation. Mol. Cell. 52:529–540. 10.1016/j.molcel.2013.09.015 - DOI - PubMed
    1. Aragona M., Panciera T., Manfrin A., Giulitti S., Michielin F., Elvassore N., Dupont S., and Piccolo S.. 2013. A mechanical checkpoint controls multicellular growth through YAP/TAZ regulation by actin-processing factors. Cell. 154:1047–1059. 10.1016/j.cell.2013.07.042 - DOI - PubMed
    1. Arsenovic P.T., Ramachandran I., Bathula K., Zhu R., Narang J.D., Noll N.A., Lemmon C.A., Gundersen G.G., and Conway D.E.. 2016. Nesprin-2G, a component of the nuclear LINC complex, is subject to myosin-dependent tension. Biophys. J. 110:34–43. 10.1016/j.bpj.2015.11.014 - DOI - PMC - PubMed

Publication types