

"Stay at Home, Protect the National Health Service, Save Lives": A cost benefit analysis of the lockdown in the United Kingdom
- PMID: 32790942
- PMCID: PMC7435525
- DOI: 10.1111/ijcp.13674
"Stay at Home, Protect the National Health Service, Save Lives": A cost benefit analysis of the lockdown in the United Kingdom
Abstract
Introduction: The COVID-19 pandemic has transformed lives across the world. In the UK, a public health driven policy of population "lockdown" has had enormous personal and economic impact.
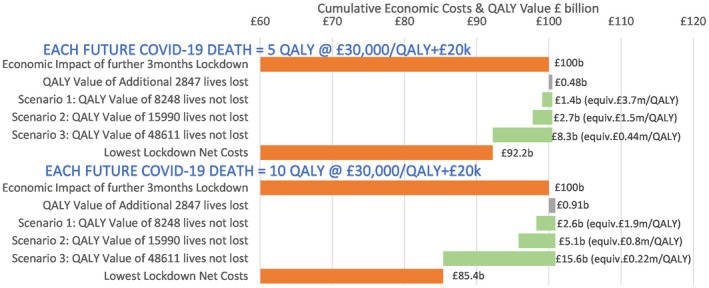
Methods: We compare UK response and outcomes with European countries of similar income and healthcare resources. We calibrate estimates of the economic costs as different % loss in Gross Domestic Product (GDP) against possible benefits of avoiding life years lost, for different scenarios where current COVID-19 mortality and comorbidity rates were used to calculate the loss in life expectancy and adjusted for their levels of poor health and quality of life. We then apply a quality-adjusted life years (QALY) value of £30,000 (maximum under national guidelines).
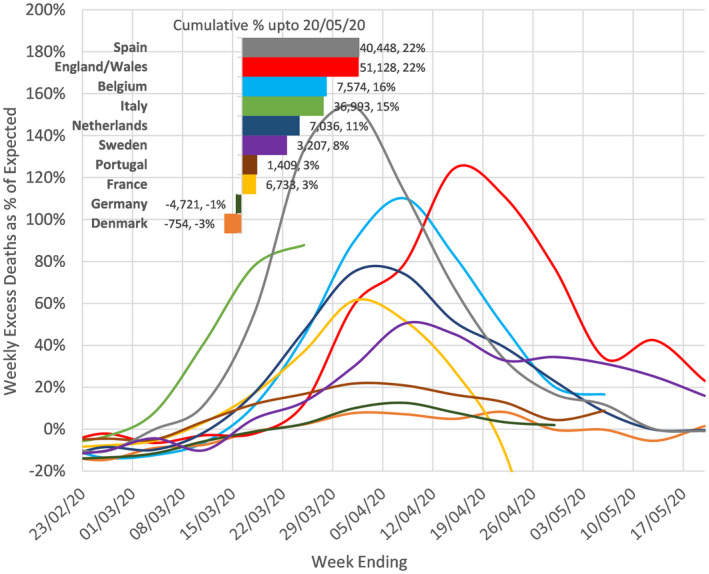
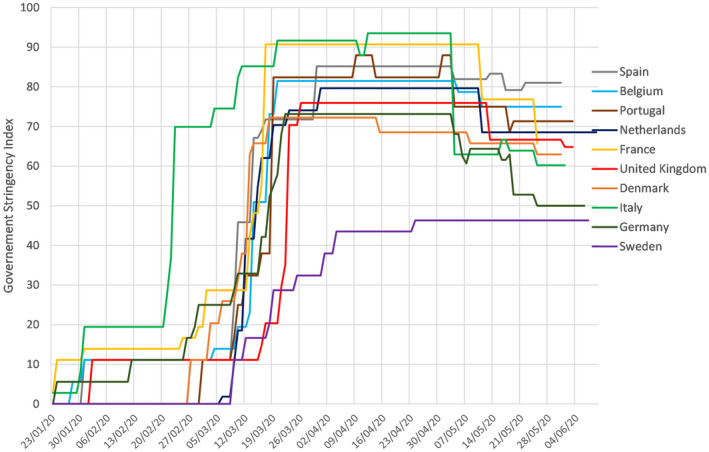
Results: There was a rapid spread of cases and significant variation both in severity and timing of both implementation and subsequent reductions in social restrictions. There was less variation in the trajectory of mortality rates and excess deaths, which have fallen across all countries during May/June 2020. The average age at death and life expectancy loss for non-COVID-19 was 79.1 and 11.4 years, respectively, while COVID-19 were 80.4 and 10.1 years; including adjustments for life-shortening comorbidities and quality of life plausibly reduces this to around 5 QALY lost for each COVID-19 death. The lowest estimate for lockdown costs incurred was 40% higher than highest benefits from avoiding the worst mortality case scenario at full life expectancy tariff and in more realistic estimations they were over 5 times higher. Future scenarios showed in the best case a QALY value of £220k (7xNICE guideline) and in the worst-case £3.7m (125xNICE guideline) was needed to justify the continuation of lockdown.
Conclusion: This suggests that the costs of continuing severe restrictions are so great relative to likely benefits in lives saved that a rapid easing in restrictions is now warranted.
Keywords: COVID-19; economics; strategy; unlock.
© 2020 The Authors. International Journal of Clinical Practice published by John Wiley & Sons Ltd.
Conflict of interest statement
No author has any conflict of interest.
Figures
References
-
- Ferguson NM, Laydon D, Nedjati‐Gilani G, et al. Impact of non‐pharmaceutical interventions (NPIs) to reduce COVID‐ 19 mortality and healthcare demand. Imperial College COVID 19 Response team report. 16 March 2020.
-
- Prime Minister's statement on coronavirus (COVID‐19): 23 March 2020. https://www.gov.uk/government/speeches/pm‐address‐to‐the‐nation‐on‐coron.... Accessed June 11, 2020.
-
- HSJ‐NHS block books almost all private hospital sector capacity to fight covid‐19. By James Illman 21 March 2020.
-
- Bongaerts D, Mazzola F, Wagner X. Closed for business. London: Centre for Economic Policy Research; 2020. https://cepr.org/active/publications/discussion_papers/dp.php?dpno=14814.
MeSH terms
LinkOut - more resources
Full Text Sources
Medical