. 2020 Oct 13;53(4):864-877.e5.
doi: 10.1016/j.immuni.2020.07.026. Epub 2020 Aug 4.

Acute SARS-CoV-2 Infection Impairs Dendritic Cell and T Cell Responses

Affiliations

Acute SARS-CoV-2 Infection Impairs Dendritic Cell and T Cell Responses

Runhong Zhou et al. Immunity. .

Abstract

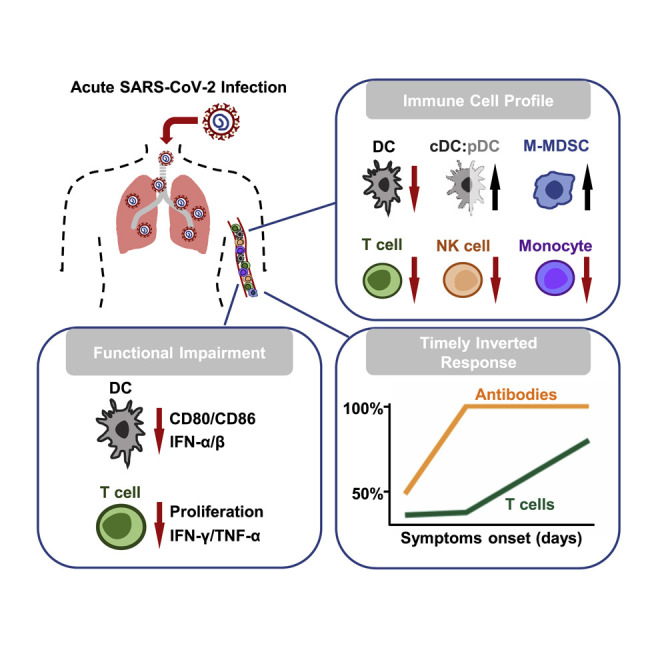
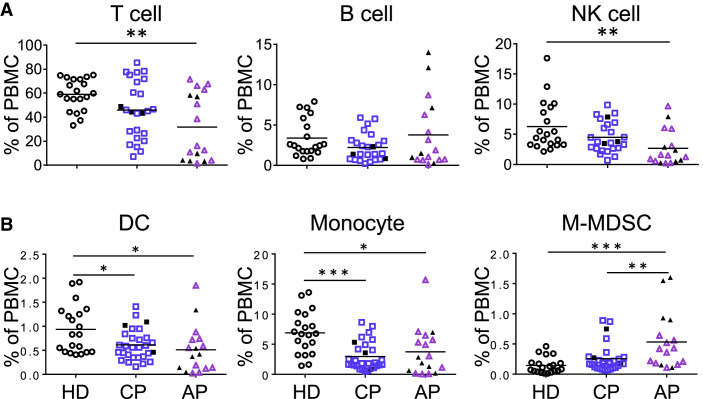
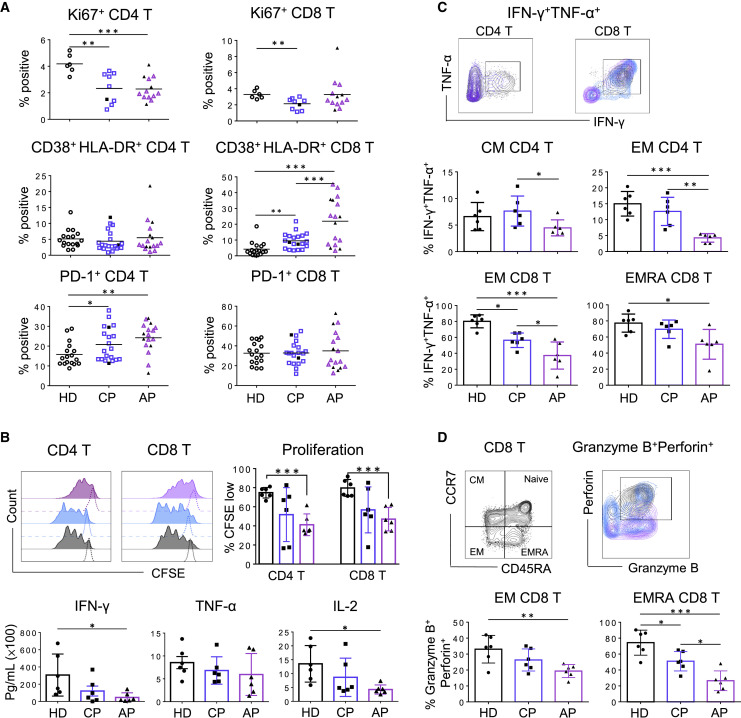
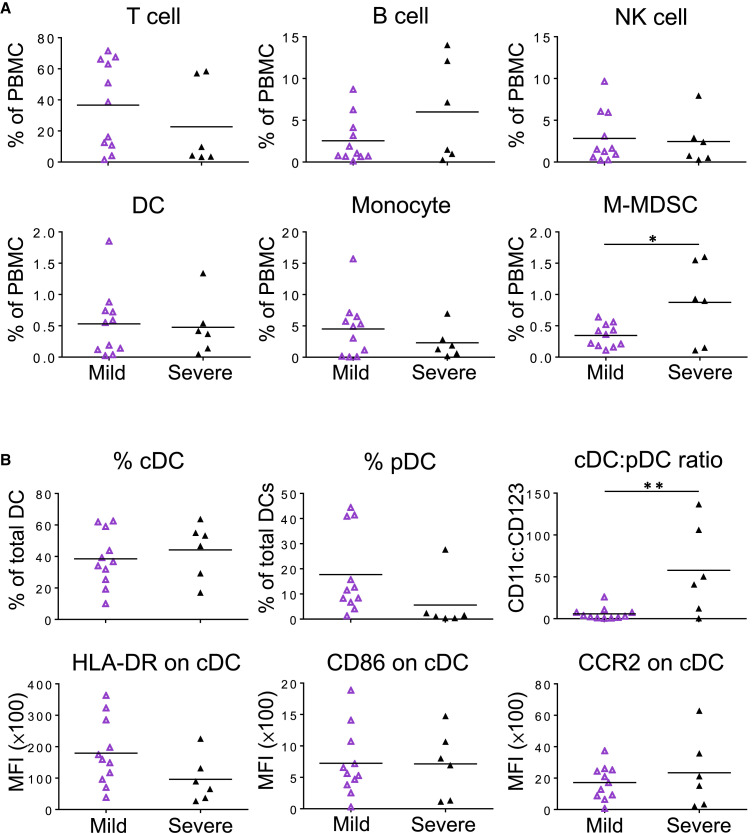
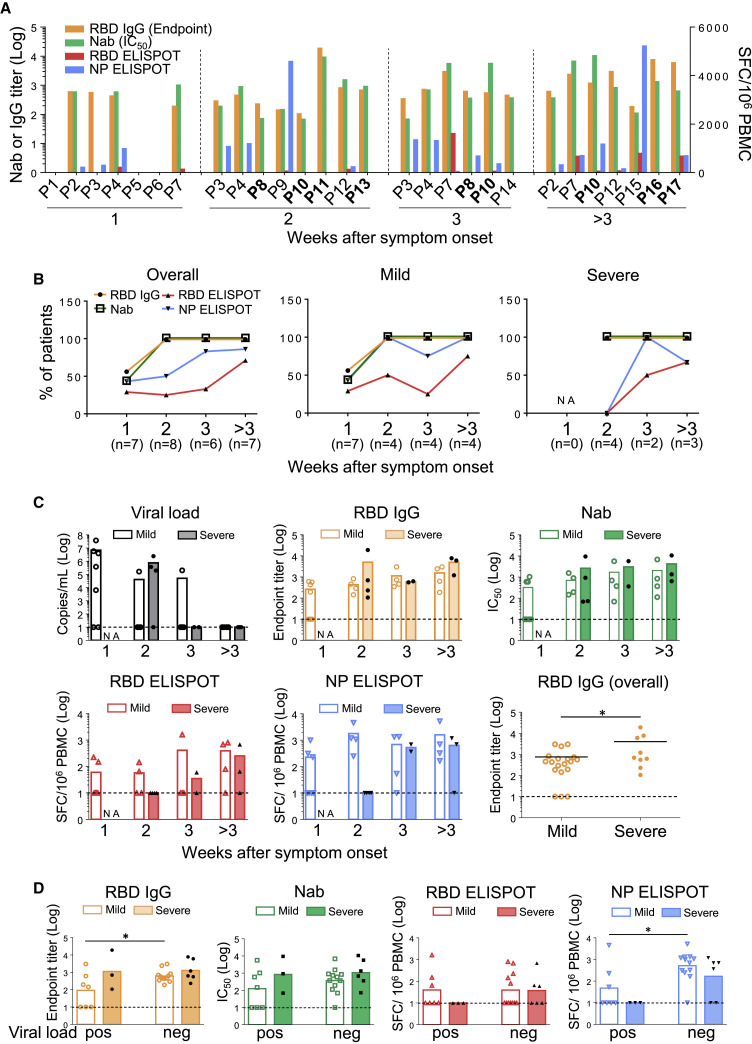
The SARS-CoV-2 pandemic has resulted in millions of infections, yet the role of host immune responses in early COVID-19 pathogenesis remains unclear. By investigating 17 acute and 24 convalescent patients, we found that acute SARS-CoV-2 infection resulted in broad immune cell reduction including T, natural killer, monocyte, and dendritic cells (DCs). DCs were significantly reduced with functional impairment, and ratios of conventional DCs to plasmacytoid DCs were increased among acute severe patients. Besides lymphocytopenia, although neutralizing antibodies were rapidly and abundantly generated in patients, there were delayed receptor binding domain (RBD)- and nucleocapsid protein (NP)-specific T cell responses during the first 3 weeks after symptoms onset. Moreover, acute RBD- and NP-specific T cell responses included relatively more CD4 T cells than CD8 T cells. Our findings provided evidence that impaired DCs, together with timely inverted strong antibody but weak CD8 T cell responses, could contribute to acute COVID-19 pathogenesis and have implications for vaccine development.

Keywords: COVID-19; SARS-CoV-2; T cell immune response; acute infection; convalescent; dendritic cell; neutralizing antibody; nucleocapsid protein; receptor-binding domain.


Conflict of interest statement

Declaration of Interests The authors declare no competing interests.

Figures

None
Graphical abstract
Figure 1
Figure 1
Acute SARS-CoV-2 Infection Results in Broad Immune Cell Suppression Fresh PBMCs were isolated from acute patients (APs), convalescent patients (CPs), and healthy donors (HDs). (A) For analysis of lymphocyte subsets including T, B, and NK cells, samples of 17 APs and 25 CPs were collected at a median of 13 (range, 1–42 days) and 30 days (range, 21–54 days) after symptoms onset, respectively. (B) For analysis of myeloid cells including DCs, CD14++CD16 monocytes, and M-MDSCs, samples of 17 APs and 29 CPs were collected at a median of 13 (range, 1–42 days) and 30 days (range, 21–54 days) after symptoms onset, respectively. Twenty HDs were included as controls. Cells were stained with different markers of immune cell populations and were subjected to flow cytometry analysis. Cumulative data show the cell frequencies. Each symbol represents an individual donor with a line indicating the mean of each group. Severe patients in both the AP and CP groups were presented as black symbols. Statistics were generated by using one-way ANOVA followed by Tukey’s multiple comparisons test and Mann-Whitney test. p < 0.05; ∗∗p < 0.01; ∗∗∗p < 0.001. See also Figures S1A and S2A; Tables S1 and S2.
Figure 2
Figure 2
DCs Derived from Acute Patients Have Reduced Maturation Potential (A) Flow cytometry analysis was used to define frequencies of CD11c+ cDC and CD123+ pDC in total blood DCs and the ratio of cDC:pDC. Samples of 17 APs and 29 CPs were collected at a median of 13 (range, 1–42 days) and 30 days (range, 21–54 days) after symptoms onset, respectively. Twenty HDs were included as controls. The expression of HLA-DR, CD86, and CCR2 on cDCs was analyzed by using the mean fluorescence intensity (MFI). Samples of 17 APs and 24 CPs were collected at a median of 13 (range, 1–42 days) and 30 days (range, 21–54 days) after symptoms onset, respectively. Severe patients in the AP and CP groups were presented as black symbols. (B) The expression of CD80 and CD86 on CD11c+ cDC was determined by using the MFI by flow cytometry analysis. Enriched DCs of 3 APs (purple line, 2 severe and 1 mild patients) and 4 mild CPs (blue line) were obtained from samples collected at a median of 11 (range, 1–13 days) and 25 days (range, 21–47 days) after symptoms onset, respectively. DCs were stimulated with the proinflammatory cytokine cocktail (stimuli) for 24 h before the analysis. Seven HDs (black line) were included as controls. Secreted levels of IFN-α and IFN-β were determined by the bead-based cytokine assays. (C) Enriched DCs derived from the same set of samples in (B) were stimulated with or without the stimuli for 24 h, followed by γ-irradiation and then co-cultured with CFSE-labeled allogeneic T cells from a HD for 5 days. Proliferation of CD4 and CD8 T cells was determined by the percentage of CFSE low using flow cytometry. Each symbol represents an individual donor. Error bars indicate standard deviation. Statistics were generated by using one-way ANOVA followed by Tukey’s multiple comparisons test Mann-Whitney test and 2-tailed Student’s t test. p < 0.05; ∗∗p < 0.01; ∗∗∗p < 0.001. See also Figures S2 and S3; Tables S1 and S2.
Figure 3
Figure 3
Peripheral T Cells Display Functional Loss during Acute SARS-CoV-2 Infection (A) Frequencies of Ki67+ cells on CD4 and CD8 T cells were determined by flow cytometry. Fresh PBMCs from 13 APs and 9 CPs were collected at a median of 9 (range, 1–20 days) and 31 days (range, 23–54 days) after symptoms onset, respectively. Frequencies of CD38+HLA-DR+ and PD-1+ cells on CD4 T cells (left) and CD8 T cells (right) were also determined by flow cytometry. Samples of 17 APs and 20 CPs were collected at a median of 13 (range, 1–42 days) and 29.5 days (range, 21–54 days) after symptoms onset, respectively. Samples of 17 HDs were included as controls. Severe patients in the AP and CP groups were presented as black symbols. (B) Proliferation ability of T cells from COVID-19 patients was determined by flow cytometry. Fresh PBMCs from 6 APs (1 severe and 5 mild patients) and 6 mild CPs were obtained at a median of 12 (range, 2–25 days) and 32 days (range, 23–39 days) after symptoms onset, respectively. PBMCs were labeled with CFSE and then were cultured in the presence or absences of anti-CD3 and anti-CD28 mAbs for 3 days before the flow cytometry. PBMCs of 6 HDs were included as controls. Representative histograms (top left) and quantified results (top right) depict the CFSE profiles of CD4 and CD8 T cells, respectively. The presence of IFN-γ, TNF-α, and IL-2 in culture supernatants after anti-CD3/CD28 stimulation was also quantified by using the bead-based cytokine assays (bottom). (C) T cell responses to non-specific stimulation. Fresh PBMCs (same samples from Figure 3B) were stimulated with PMA/Ionomycin activation cocktail in the presence of brefeldin A (BFA) for 6 h. Expression of IFN-γ and TNF-α in T cells were determined by intracellular cytokine staining analysis. Representative plots showing IFN-γ and TNF-α expression in CD4 and CD8 T cells (top). Frequencies of IFN-γ+ and TNF-α+ cells were gated on CD45RA CCR7+ CM and CD45RACCR7 EM CD4 T cells (middle), as well as on EM and CD45RA+CCR7 (CD45RA+ effector memory, EMRA) CD8 T cells (bottom). (D) Expression of granzyme B and perforin in unstimulated EM and EMRA CD8 T cells (same samples from Figure 3B) was determined by intracellular staining. Representative plots (top) and quantified results (bottom) are shown. Each symbol represents an individual donor. Error bars indicate standard deviation. Statistics were generated by using one-way ANOVA followed by Tukey’s multiple comparisons test, Mann-Whitney test, and 2-tailed Student’s t test. p < 0.05; ∗∗p < 0.01; ∗∗∗<0.001. See also Figures S1 and S4; Tables S1 and S2.
Figure 4
Figure 4
Impact of Disease Severity on AP-Derived Immune Cells Samples of 11 mild and 6 severe APs (same as Figures 1 and 2) were collected at a median of 9 (range, 3–23 days) and 15 days (range, 1–54 days) after symptoms onset, respectively. (A) The frequencies of lymphocyte subsets (T, B, and NK cells) and myeloid cells (DCs, CD14++CD16 monocytes, and M-MDSCs) were analyzed by flow cytometry. (B) Frequencies of CD11c+ cDC and CD123+ pDC in total blood DCs and the cDC:pDC ratios were determined by flow cytometry. The expression of HLA-DR, CD86, and CCR2 on cDCs was analyzed by using the MFI. Each symbol represents an individual donor with a line indicating the mean of each group. Statistics were generated by using 2-tailed Student’s t test. p < 0.05; ∗∗p < 0.01. See also Figure S5; Tables S1 and S2.
Figure 5
Figure 5
Timely Inverted RBD-Specific Antibody and T Cell Responses during Acute Infection (A) Nab responses, shown as IC50, of 17 APs were measured by a pseudovirus-based assay. Endpoint titers of RBD IgG in plasma of each patient were measured by ELISA. Antigen-specific T cell responses toward the RBD peptide pool and NP protein were determined by the IFN-γ ELISPOT assays. Patient IDs highlighted in bold represent severe patients. (B) Percentages of patients with positive RBD IgG, NAb, NP ELISPOT, and RBD ELISPOT responses in each week after symptoms onset according to results in (A). “NA” means that samples were not available. (C) Kinetics of viral loads, anti-RBD IgG, NAb, and T cell responses against RBD peptide pool and NP protein were presented by weeks. Each symbol represents an individual subject. The mean values of individual groups are indicated by bars. Undetectable viral titers and immune responses were set as 1 Log10. “NA” means that samples were not available. Severe patients were labeled by black symbols. (D) Comparisons of titers of anti-RBD IgG, NAb, T cell responses against RBD peptide pool, and NP protein between mild and severe acute patients with either undetectable (neg) or positive (pos) viral loads. Severe patients were labeled by black symbols. Negative response was set as 1 Log10. Each symbol represents an individual subject, and the mean values of each group are shown by bars. Statistics were generated by using 2-tailed Student’s t test. p < 0.05. See also Figures S6 and S7; Tables S1 and S3.
Figure 6
Figure 6
Antibody and T Cell Response Profiles of Convalescent Patients (A) The NAb IC50 of 23 convalescent patients was measured by the pseudovirus-based assay, and the endpoint titer of RBD IgG in plasma of each patient was measured by ELISA. Antigen-specific T cell responses toward the RBD peptide pool and NP protein were determined by IFN-γ ELISPOT respectively. Patient ID highlighted in bold represents severe patients. (B) PBMCs from 3 APs and 13 CPs were subjected to the ICS assay against RBD peptide pool and NP protein. IFN-γ+ cells were gated on CD4 and CD8 T cells, respectively. Representative dot plots (left) and quantified results (right) depict the percentage of IFN-γ+ cells. Each symbol represents an individual donor with a line indicating the mean of each group. (C) Phenotypes of RBD and NP-specific CD4 T cells were defined by using CD45RA and CCR7 markers (left). Averaged frequencies of each subset of IFN-γ+ cells were shown (right). Statistics were generated by using 2-tailed Student’s t test. p < 0.05. See also Figures S7 and S8; Tables S1 and S3.

Similar articles

Cited by

References

    1. Blanco-Melo D., Nilsson-Payant B.E., Liu W.C., Uhl S., Hoagland D., Møller R., Jordan T.X., Oishi K., Panis M., Sachs D. Imbalanced Host Response to SARS-CoV-2 Drives Development of COVID-19. Cell. 2020;181:1036–1045.e9. - PMC - PubMed
    1. Chan J.F., Kok K.H., Zhu Z., Chu H., To K.K., Yuan S., Yuen K.Y. Genomic characterization of the 2019 novel human-pathogenic coronavirus isolated from a patient with atypical pneumonia after visiting Wuhan. Emerg. Microbes Infect. 2020;9:221–236. - PMC - PubMed
    1. Chan J.F., Yip C.C., To K.K., Tang T.H., Wong S.C., Leung K.H., Fung A.Y., Ng A.C., Zou Z., Tsoi H.W. Improved Molecular Diagnosis of COVID-19 by the Novel, Highly Sensitive and Specific COVID-19-RdRp/Hel Real-Time Reverse Transcription-PCR Assay Validated In Vitro and with Clinical Specimens. J. Clin. Microbiol. 2020;58:e00310–e00320. - PMC - PubMed
    1. Chan J.F., Yuan S., Kok K.H., To K.K., Chu H., Yang J., Xing F., Liu J., Yip C.C., Poon R.W. A familial cluster of pneumonia associated with the 2019 novel coronavirus indicating person-to-person transmission: a study of a family cluster. Lancet. 2020;395:514–523. - PMC - PubMed
    1. Channappanavar R., Fett C., Zhao J., Meyerholz D.K., Perlman S. Virus-specific memory CD8 T cells provide substantial protection from lethal severe acute respiratory syndrome coronavirus infection. J. Virol. 2014;88:11034–11044. - PMC - PubMed

Publication types

MeSH terms