. 2020 Oct 6;32(4):676-688.e4.
doi: 10.1016/j.cmet.2020.07.013. Epub 2020 Aug 12.

Quantitative Fluxomics of Circulating Metabolites

Affiliations

Quantitative Fluxomics of Circulating Metabolites

Sheng Hui et al. Cell Metab. .

Abstract

Mammalian organs are nourished by nutrients carried by the blood circulation. These nutrients originate from diet and internal stores, and can undergo various interconversions before their eventual use as tissue fuel. Here we develop isotope tracing, mass spectrometry, and mathematical analysis methods to determine the direct sources of circulating nutrients, their interconversion rates, and eventual tissue-specific contributions to TCA cycle metabolism. Experiments with fifteen nutrient tracers enabled extensive accounting for both circulatory metabolic cycles and tissue TCA inputs, across fed and fasted mice on either high-carbohydrate or ketogenic diet. We find that a majority of circulating carbon flux is carried by two major cycles: glucose-lactate and triglyceride-glycerol-fatty acid. Futile cycling through these pathways is prominent when dietary content of the associated nutrients is low, rendering internal metabolic activity robust to food choice. The presented in vivo flux quantification methods are broadly applicable to different physiological and disease states.

Keywords: TCA cycle; circulating metabolites; energy metabolism; in vivo flux quantification; isotope tracing; ketogenic diet; metabolic cycling.


Conflict of interest statement

Declaration of Interests J.D.R. is a member of the Rutgers Cancer Institute of New Jersey and of the University of Pennsylvania Diabetes Research Center; a co-founder and stockholder in VL54, Sofro, and Raze Therapeutics; and advisor and stockholder in Agios Pharmaceuticals, Kadmon Pharmaceuticals, Bantam Pharmaceuticals, Colorado Research Partners, Rafael Pharmaceuticals, and L.E.A.F. Pharmaceuticals.

Figures

Figure 1.
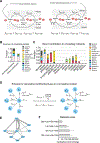
Figure 1.. Circulatory turnover flux markedly exceeds dietary flux, indicating active nutrient cycling. Data are from 8-h fasted mice on carbohydrate diet.
(A) Hypothetical store-release-burn model. In fed state, circulating nutrients originate from the diet and go to either storage or tissue energy generation. In fasted state, circulating nutrients come from the storage and are consumed solely for tissue energy generation. For a nutrient that follows this model, in fasted state, its circulatory turnover flux is less than its average dietary intake flux averaged over a diurnal cycle. Data in (B) and (C) contradict this conclusion, indicating active nutrient cycling in the fasted state. (B) Comparison between average dietary flux and fasted circulatory turnover flux for specific metabolites. See Table S2 for values of fluxes and N. (C) Comparison between the average dietary flux and fasted circulatory turnover flux, here shown as stacked bars. Different from (B), the flux units here are moles carbon, rather than moles molecules. See Table S2 for values.
Figure 2.
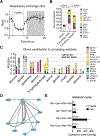
Figure 2.. Comprehensive tracer studies enable determination of direct sources and interconversion fluxes of circulating metabolites. Data are for 8-h fasted mice on carbohydrate diet.
(A) Example of calculating the direct contributions from two circulating metabolites (alanine, glucose) to a third metabolite (lactate). This requires infusion separately of alanine and of glucose. Each infusion experiment yields an isotope balance equation. Together, the two equations from the two infusions determine the two direct contributions. (B) Comparison between the normalized labeling of lactate (calculated separately from each infusion) and the direct contributions to lactate. (C) Direct contributions to each of 15 circulating metabolites from the other 14. See Table S3 for normalized labeling data and Table S4 for the direct contribution values. (D) Scheme for calculating absolute contributing fluxes from the relative direct contributions. (E) Circulating nutrient interconversion fluxes. Edge widths are proportional to log-transformed flux values. Shown are fluxes > 30 nmol C/min/g. (F) Metabolic cycles with flux > 40 nmol C/min/g.
Figure 3.
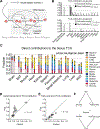
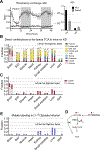
Figure 3.. Metabolite interconversion fluxes are similar between fed and fasted mice. Data are for 8-h fasted mice and 3-h refed mice on carbohydrate diet.
(A) Respiratory exchange ratio during a diurnal cycle (N=5). Shaded area indicates the dark period. Mice were 8-h fasted during the light period. (B) Dietary flux versus circulatory turnover flux in fed and fasted mice. See Table S2 for flux values and N. (C) Direct contributions to circulating metabolites in both fed and fasted mice. For each metabolite, the left bar is fed state and right bar is fasted. See Table S3 for normalized labeling and Table S4 for direct contribution values. (D) Circulating nutrient interconversion fluxes in fed mice. Edge widths are proportional to log-transformed flux values. Shown are fluxes > 30 nmol C/min/g. (E) Top metabolic cycles in fed and fasted mice.
Figure 4.
Figure 4.. Comprehensive tracer studies enable determination of direct sources of tissue TCA metabolites. Data are for 8-h fasted mice and 3-h refed mice on carbohydrate diet.
(A) Example of direct and indirect routes from the infused tracer to tissue TCA cycle. The labeling of the tissue TCA upon labeled X infusion can come from both directly from X or indirectly via circulating Y or Z, as codified in the isotope-balance equation. Infusions of Y and Z yield analogous equations which are needed to solve for the three direct contributions. (B) Comparison between the normalized labeling of tissue TCA intermediate (malate) and direct contribution for glucose (upper panel) and glycerol (lower panel). (C) Direct tissue TCA contributions for 15 circulating nutrients and 11 tissues. For each tissue, the left bar is fed state and right bar is fasted. See Table S3 for labeling data and Table S5 for direct TCA contribution values. (D) Comparison of direct contribution from carbohydrates (the sum of direct contributions from glucose and lactate) to tissue TCA between fasted and fed mice. (E) Comparison of direct contribution from fatty acids (the sum of direct contributions from palmitic acid, oleic acid, and linoleic acid) to tissue TCA between fasted and fed mice. (F) Schematic of major carbohydrate and fatty acid fluxes: constant functioning of the glucose-lactate cycle and the triglyceride-glycerol-fatty acid cycle, with glycerol connecting the two, and lactate and free fatty acids the primary direct tissue TCA contributors.
Figure 5.
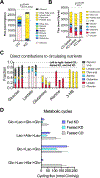
Figure 5.. Persistent circulatory carbohydrate fluxes on ketogenic diet. Data are for 8-h fasted carbohydrate diet mice and 8-h fasted and 3-h refed ketogenic diet mice.
(A) Comparison of the dietary fluxes. See Table S2 for flux values and N. (B) Comparison of the circulatory turnover fluxes. See Table S2 for flux values and N. (C) Comparison of the direct contributions to circulating metabolites. For each metabolite, the left bar is fasted carbohydrate diet, middle bar is fasted ketogenic diet, and right bar is fed ketogenic diet. See Table S6 for labeling data and Table S4 for direct contribution values. (D) Comparison of top metabolic cycles between the two diets.
Figure 6.
Figure 6.. In ketogenic diet, pyruvate cycling produces carbohydrate fluxes without carbohydrate burning.
(A) Comparison of respiratory exchange ratio between mice on the high-carbohydrate diet (N=5) and the ketogenic diet (N=4). Shaded areas indicate the dark periods. Mice were fasted for 8-hr in the first light period. Error bars are standard deviations. (B) Direct contributions from 9 circulating metabolites to the TCA cycle in tissues of fasted mice and fed mice on the ketogenic diet. See Table S6 for labeling data and Table S5 for direct TCA contribution values. (C) Same data as in (B), but only the glucose and lactate data are shown. (D) The labeled carbon of [1-13C]lactate is lost in the PDH reaction, and hence labeling observed in (D) reflects TCA input via the PC pathway. (E) Analogous to (C), with [1-13C]lactate as the tracer.

References

    1. Allen BG, Bhatia SK, Anderson CM, Eichenberger-Gilmore JM, Sibenaller ZA, Mapuskar KA, Schoenfeld JD, Buatti JM, Spitz DR, and Fath MA (2014). Ketogenic diets as an adjuvant cancer therapy: History and potential mechanism. Redox biology 2, 963–970. - PMC - PubMed
    1. Antoniewicz MR (2015). Methods and advances in metabolic flux analysis: a mini-review. Journal of industrial microbiology & biotechnology 42, 317–325. - PubMed
    1. Barañano KW, and Hartman AL (2008). The ketogenic diet: uses in epilepsy and other neurologic illnesses. Current treatment options in neurology 10, 410. - PMC - PubMed
    1. Bing R, Siegel A, Ungar I, and Gilbert M (1954). Metabolism of the human heart: II. Studies on fat, ketone and amino acid metabolism. The American journal of medicine 16, 504–515. - PubMed
    1. Burgess SC, Merritt ME, Jones JG, Browning JD, Sherry AD, and Malloy CR (2015). Limitations of detection of anaplerosis and pyruvate cycling from metabolism of [1–13 C] acetate. Nature medicine 21, 108. - PMC - PubMed

Publication types