. 2020 Jul 24;99(30):e21396.
doi: 10.1097/MD.0000000000021396.

Clinical and CT characteristics of healthcare workers with COVID-19: A single-centered, retrospective study

Affiliations

Clinical and CT characteristics of healthcare workers with COVID-19: A single-centered, retrospective study

Ying Xiong et al. Medicine (Baltimore). .

Abstract

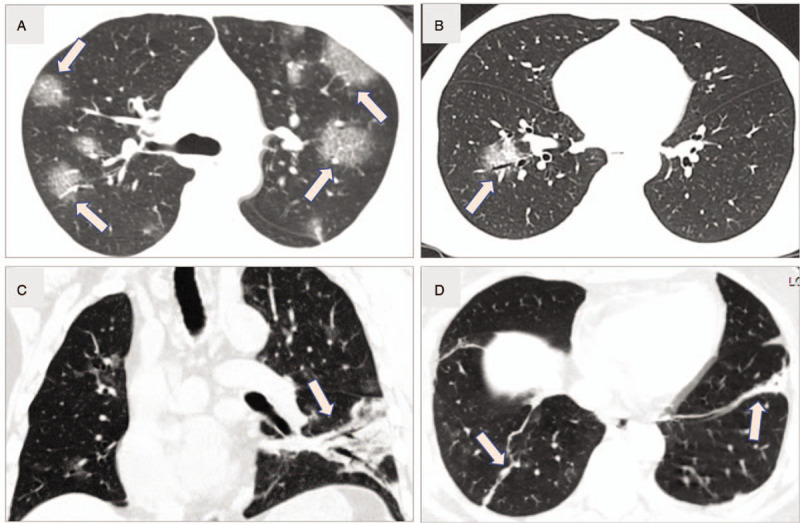
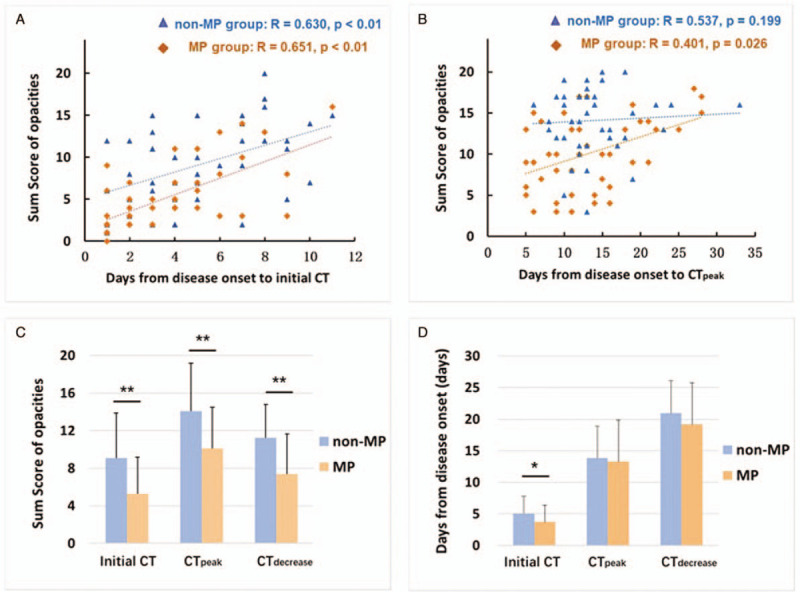
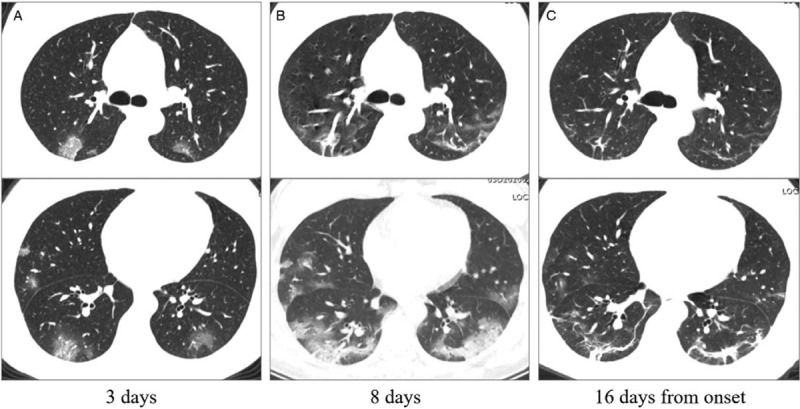
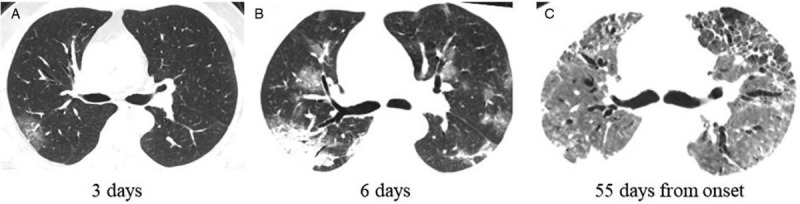
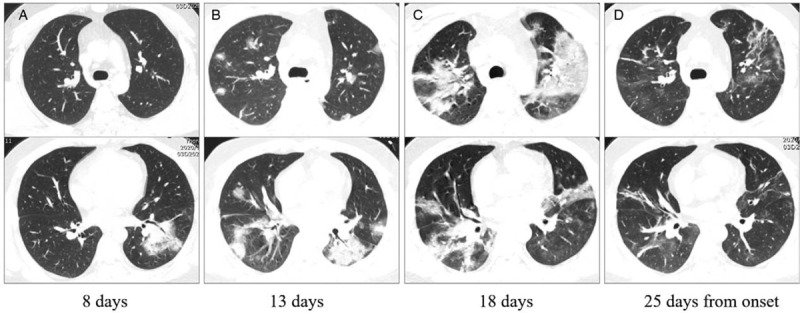
A large number of healthcare workers have been infected with coronavirus disease-2019 (COVID-19). We aimed to investigate their clinical and chest computed tomography (CT) characteristics.The clinical, laboratory test and CT features of 43 medical and hospital staff with confirmed COVID-19 (MP group, 26-70 years old) were retrospectively analyzed, and compared to 43 non-medical related patients (non-MP group, 26-71 years old). Follow-up CT characteristics were analyzed to assess the disease progression in the period of hospitalization.At admission, the main complaints of the MP group, including fever (81.4%), fatigue (48.8%) and cough (41.9%), were similar to the non-MP group. The C-reactive protein, erythrocyte sedimentation rate, and lactate dehydrogenase levels were higher in the non-MP group than the MP group (17.5 ± 22.4 mg/L, 20.2 ± 23.4 mm/H and 219 ± 66U/L, respectively, P < .05). Ground-grass opacities, consolidation, interstitial thickening were common CT features of both groups. The severity of opacities on initial CT were less in the MP group (5.3 ± 3.9 scores) than in the non-MP group (9.1 ± 4.8 scores, P < .05). Before regular treatments, the sum score of the opacities showed weak to moderate correlations with duration, C-reactive protein, erythrocyte sedimentation rate and lactate dehydrogenase levels (R ranged from 0.341-0.651, P < .05). In the study time window, the duration from illness onset to when the most obvious pulmonary opacities were observed, according to CT findings, were similar in the MP group (13.3 ± 6.6 days) and the non-MP group (13.8 ± 5.1 days, P = .69). Mild to moderate anxiety and depression were observed in both groups.Despite greater knowledge of how to protect themselves than the general population, healthcare workers are also susceptible to COVID-19 infection. Occupational exposure is a very important factor. Healthcare workers have a higher vigilance about the infection in the early stage of the disease.


Conflict of interest statement

The authors have no conflicts of interest to disclose.

Figures

Figure 1
Figure 1
Common computed tomography imaging features. A: Multiple patchy ground-glass opacities (GGO), and GGO with interlobular septal thickening (arrows, like reticulation or “paving stone sign”) of a 44 years old male common patient (5 days from onset). B: Single GGO in peribronchial area (arrow) of the right lower lobe of a 44 years old male patient (a physician, 2 days from onset). C: Diffuse opacities and consolidation, as well as air bronchograms (arrow) in a 54 years old patient (a surgeon, 6 days from onset). D: Fibrous stripes (arrows) are shown in bilateral lower lobes in a 51 years old female patient (a radiology technician, 20 days from onset).
Figure 2
Figure 2
A-B: Correlation between sum score and days from illness onset to initial CT; and days from illness onset to the most obvious pulmonary opacities were observed (CTpeak). (R denotes Pearson correlation coefficient with age and gender as covariates). C-D: Differences in mean values of sum score and disease duration to initial CT, CTpeak and the CT began to show decreased extent/density of the opacities (CTdecrease), between the MP and non-MP groups. Note that at the timepoint of CTdecrease, 41 patients in MP group and 40 patients in non-MP group were included. The bar height indicates the mean, and the line on top of the bar represents the standard deviation. Asterisk indicates a significant difference (P < .05, ∗∗P < .01).
Figure 3
Figure 3
The initial computed tomography (CT), CT with most obvious opacities, and CT with decreased opacities of a 38 years old nurse. A: Patchy ground-glass opacities distributed bilaterally on the initial CT (3 days from onset). B: In the follow-up CT, ground-glass opacities progressed to multiple ground-glass infiltration in the lungs. C: Fibrous stripes could be a common sign during the remission stage. Images in the first and second lines represent different cross sections.
Figure 4
Figure 4
The initial and follow-up computed tomography of a 54 years old patient (a surgeon). A: Focal ground-glass opacities in the right upper lobe (3 days from onset). B: Ground-glass opacities progressed to multiple ground-glass infiltration and consolidation bilaterally. C: The disease progressed very fast. He was admitted in intense care unit and received ECMO treatment. Fibrous stripes, interstitial thickening, pneumonocele and bronchiectasia could be seen.
Figure 5
Figure 5
The initial computed tomography (CT), follow-up CT, CT with most obvious opacities, and CT with decreased opacities of a 28 years old common patient admitted in our institution. A: Patchy ground-glass opacities in the left lower lobe on the initial CT (8 days from onset). B, C: In the follow-up CT, ground-glass opacities progressed to multiple ground-glass infiltration and consolidation bilaterally. D: After absorption of some opacities, fibrous stripes and interstitial thickening could be seen. Images in the first and second lines represent different cross sections.

References

    1. World Health Organization. WHO Statement regarding cluster of pneumonia cases in Wuhan, China. World Health Organization, Geneva. Available via https://www.who.int/china/news/detail/09-01-2020-who-statement-regarding.... Accessed 9 January 2020.
    1. Velavan TP, Meyer CG. The COVID-19 epidemic. Trop Med Int Health 2020;25:278–80. - PMC - PubMed
    1. World Health Organization. Novel coronavirus(2019-nCoV): situation report - 91. Available at: https://www.who.int/docs/default-source/coronaviruse/situation-reports/2.... Accessed April 20, 2020.
    1. Chan JF, Yuan S, Kok KH, et al. A familial cluster of pneumonia associated with the 2019 novel coronavirus indicating person-to-person transmission: a study of a family cluster. Lancet 2020;395:514–23. - PMC - PubMed
    1. Li Q, Guan X, Wu P, et al. Early transmission dynamics in Wuhan, China, of novel coronavirus-infected pneumonia. N Engl J Med 2020;382:1199–207. - PMC - PubMed

Publication types

MeSH terms