. 2020 Sep 1;34(17-18):1177-1189.
doi: 10.1101/gad.338046.120. Epub 2020 Aug 13.

The Daam2-VHL-Nedd4 axis governs developmental and regenerative oligodendrocyte differentiation

Affiliations

The Daam2-VHL-Nedd4 axis governs developmental and regenerative oligodendrocyte differentiation

Xiaoyun Ding et al. Genes Dev. .

Abstract

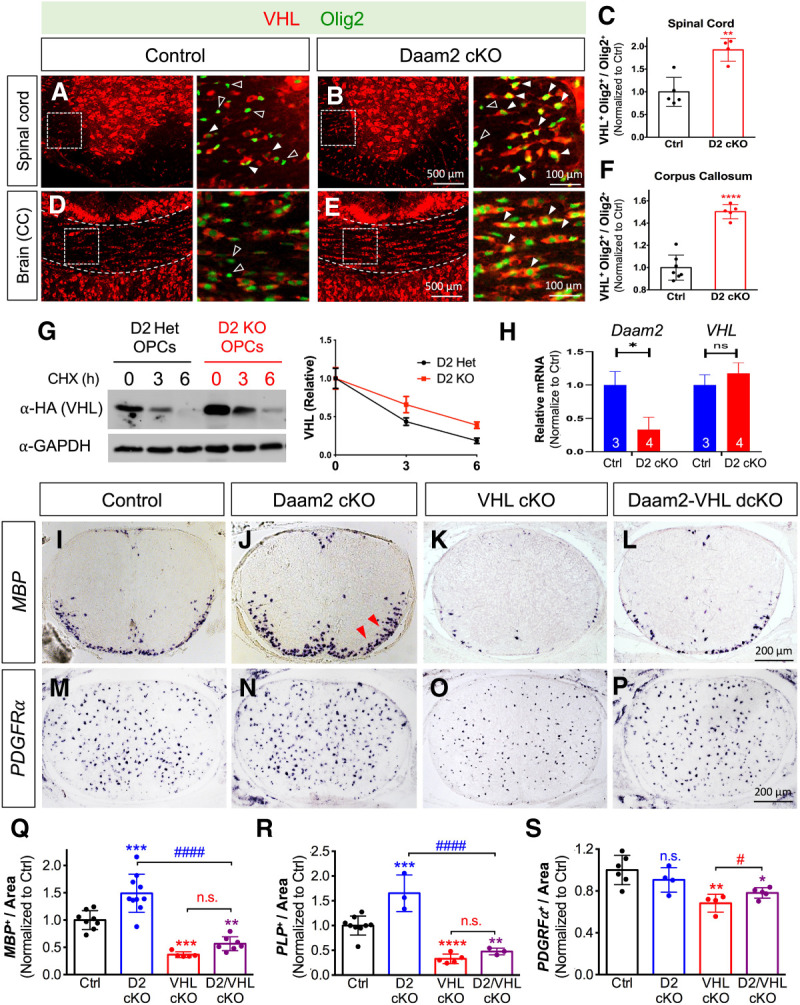
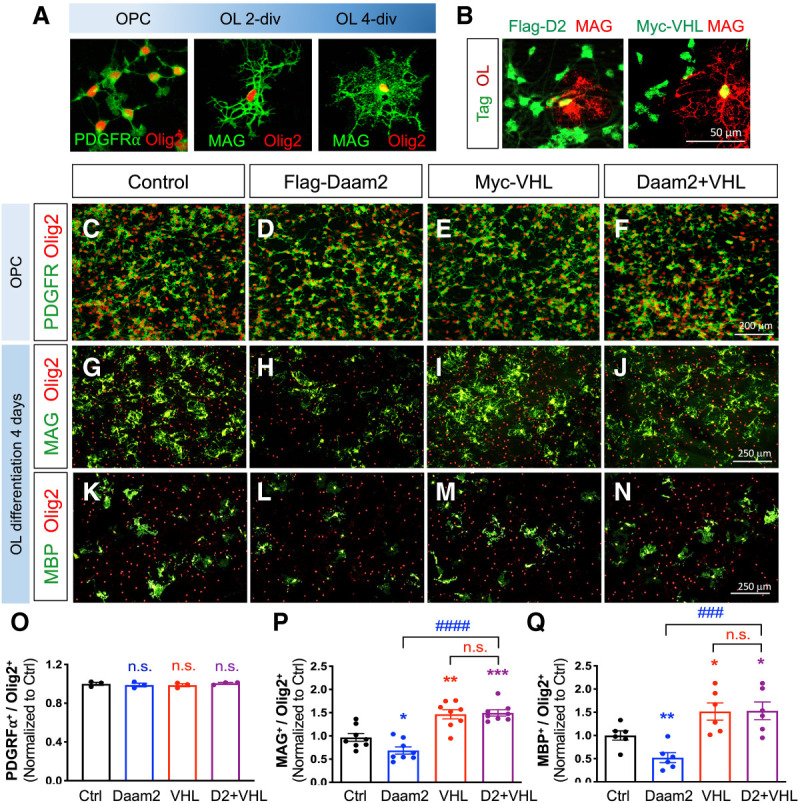
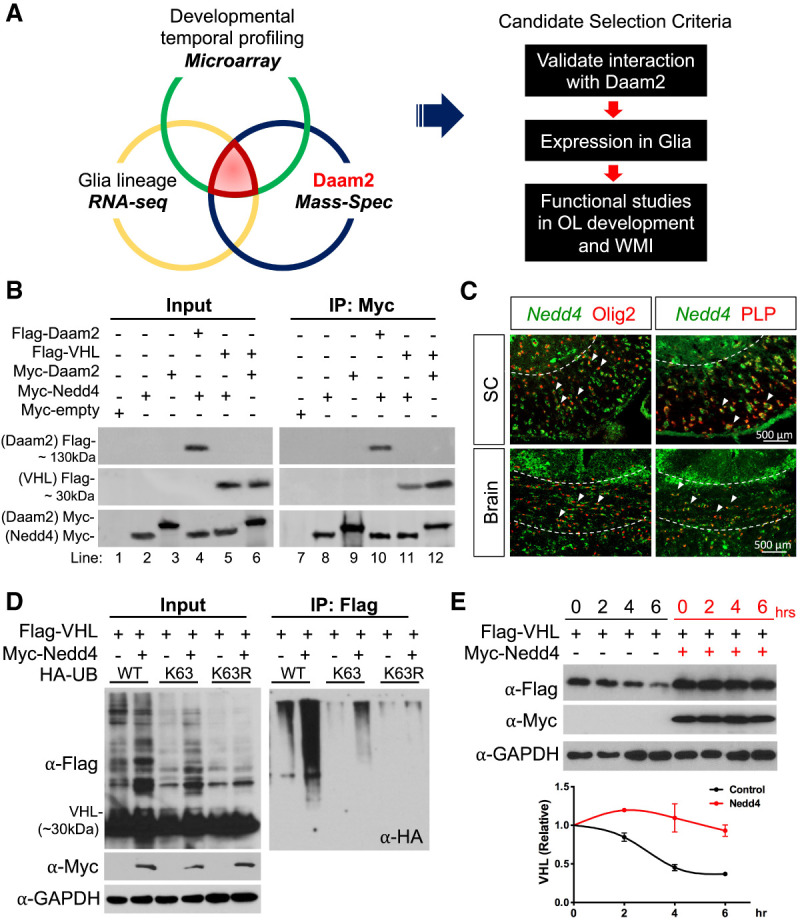
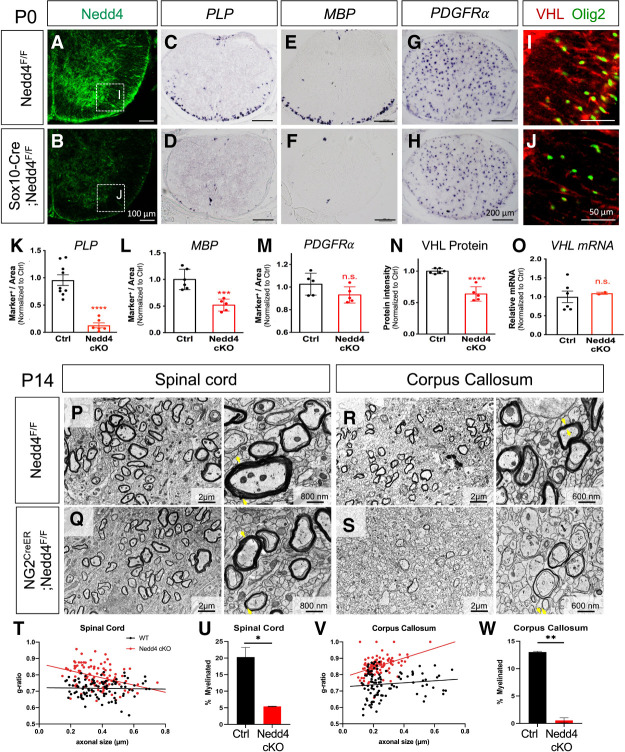
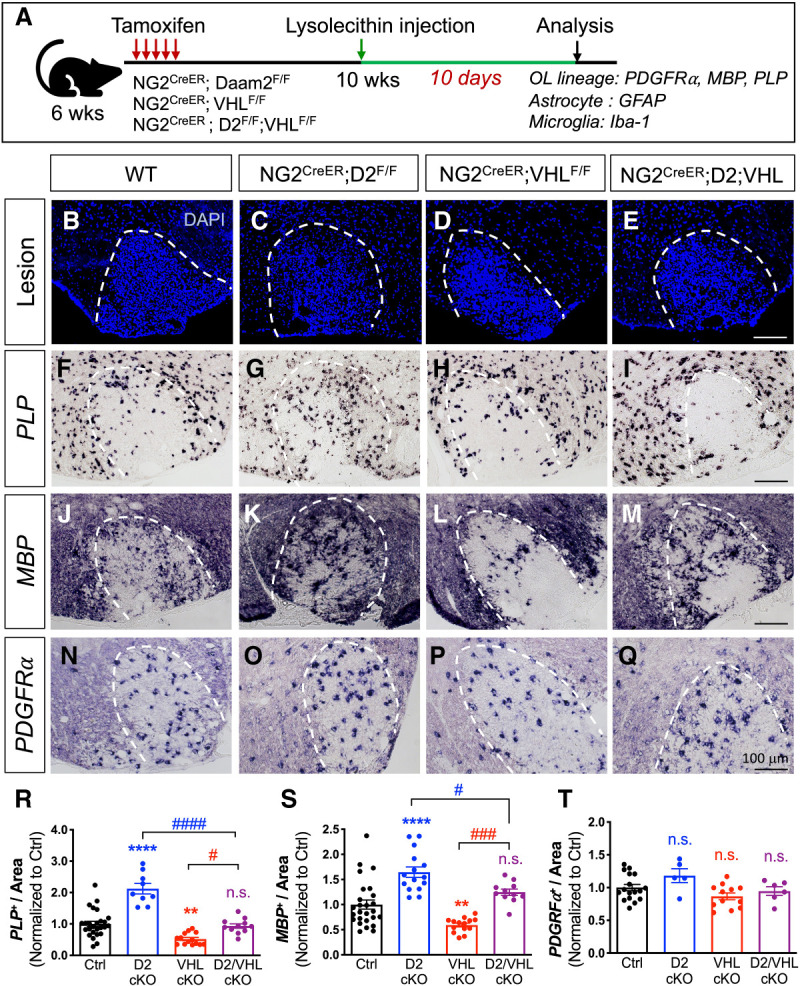
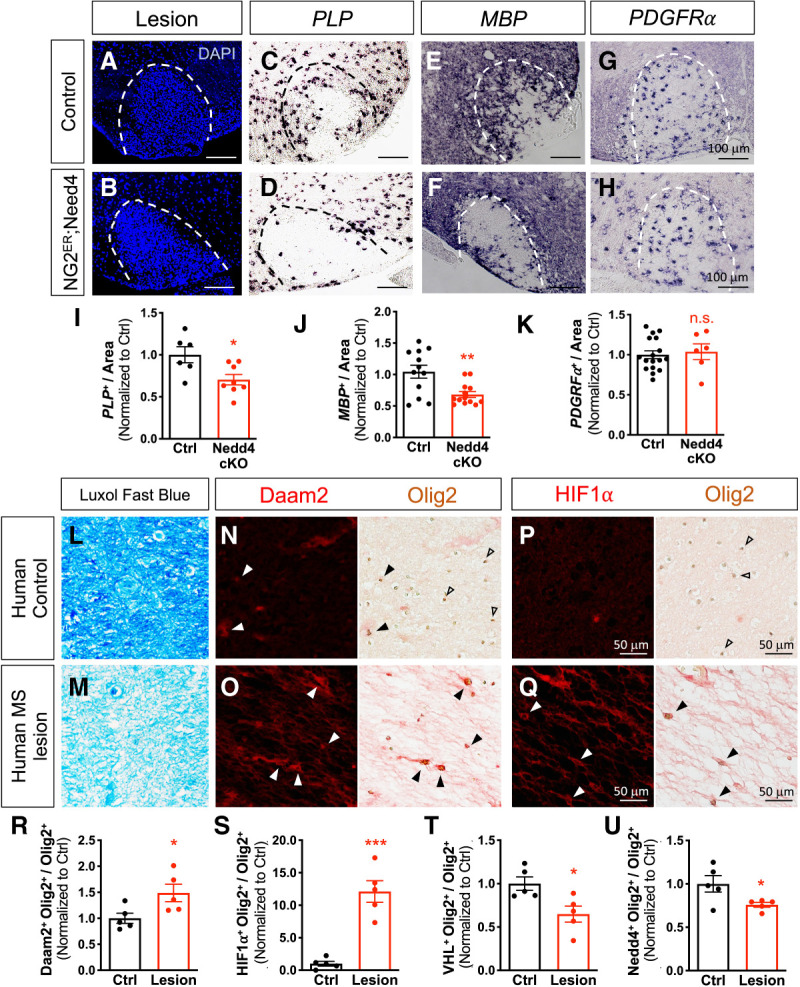
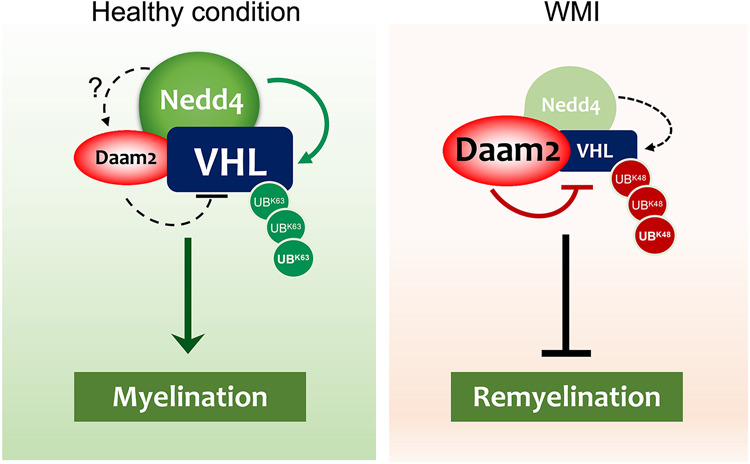
Dysregulation of the ubiquitin-proteasomal system (UPS) enables pathogenic accumulation of disease-driving proteins in neurons across a host of neurological disorders. However, whether and how the UPS contributes to oligodendrocyte dysfunction and repair after white matter injury (WMI) remains undefined. Here we show that the E3 ligase VHL interacts with Daam2 and their mutual antagonism regulates oligodendrocyte differentiation during development. Using proteomic analysis of the Daam2-VHL complex coupled with conditional genetic knockout mouse models, we further discovered that the E3 ubiquitin ligase Nedd4 is required for developmental myelination through stabilization of VHL via K63-linked ubiquitination. Furthermore, studies in mouse demyelination models and white matter lesions from patients with multiple sclerosis corroborate the function of this pathway during remyelination after WMI. Overall, these studies provide evidence that a signaling axis involving key UPS components contributes to oligodendrocyte development and repair and reveal a new role for Nedd4 in glial biology.

Keywords: CNS development; multiple sclerosis; oligodendrocyte; remyelination.


Figures

Figure 1.
Figure 1.
Daam2 suppresses VHL function during OL development. (AF) Immunofluorescence staining of VHL and Olig2 in the developing spinal cord and corpus callosum (CC) of control (Daam2F/F) versus Daam2 cKO (Sox10-Cre; Daam2F/F) mice at postnatal day 14 (P14). (A,B,D,E) Zoomed-in images are shown in the adjacent panels at the right, which are indicated in the dashed box. Solid and empty arrowheads indicate VHL-expressing versus nonexpressing OLs, respectively. (C,F) VHL-expressing Olig2+ cells were significantly increased in the spinal cord (Student's t-test, [**] P < 0.01) and corpus callosum in Daam2 cKO mice (Student's t-test, [****] P < 0.0001). Data points represent individual animals from three total litters. Plotted values are normalized to control. (G) VHL degradation assay was performed in primary OPCs from Daam2 knockout or heterozygote; OPCs were transfected with plasmids encoding HA-tagged VHL. After 2 d, the amount of VHL was analyzed by immunoblotting after cycloheximide (CHX) treatment for 0, 3, and 6 h. The intensity of VHL/GAPDH from the blots was quantified by ImageJ software and normalized to 0 h. Half-life of VHL in Het OPCs (2.66 h) and KO OPCs (4.77 h). Data were presented as mean ± SEM from three independent repeats. (H) mRNA level of Daam2 and VHL from P0 spinal cords of Daam2 cKO (n = 3) and control mice (n = 4) by real-time qPCR. Plotted values are normalized to control. (IS) Functional epistatic analysis of Daam2 and VHL loss of function (LOF) during OL development in vivo. (IP) Representative images of MBP+ mature OLs and PDGFRα+ OPCs via in situ hybridization on P0 spinal cord of Daam2 cKO, VHL cKO, and Daam2–VHL dcKO mice. (QS) Quantification of OL and OPC marker expression in single and double LOF. The experiments were performed on at least five animals per genotype, with quantification of at least 6 sections per animal. Each data point represents one animal from at least four litters. Values were normalized to control (one-way ANOVA with multiple comparisons, [**] P < 0.01; [***] P < 0.001; [****] P < 0.0001; [#] P < 0.05; [####] P#### < 0.0001).
Figure 2.
Figure 2.
VHL rescues Daam2-induced suppression of OPC differentiation in vitro. (A) Representative images for primary mouse OPC cultures. (B) The expression of Flag and Myc tags are confirmed by immunofluorescence staining, which indicates successful transduction. (CQ) In vitro overexpression analysis of Daam2 and VHL function during differentiation of OPC cultures. After gene transduction, OPCs were maintained in OPC medium for 2 d (CF) or in differentiation medium for 4 d (GN). Cells were then fixed and stained with anti-PDGFRα, anti-MAG and anti-MBP for OPC and mature OL markers, respectively. Anti-Olig2 was also used for labeling the OL lineage cells. (OQ) Data were acquired from three independent experiments, with values normalized to control (Student's t-test, [*] P < 0.05; [**] P < 0.01; [***] P < 0.001; [###] P < 0.001; [####] P < 0.0001).
Figure 3.
Figure 3.
Nedd4 stabilizes the VHL expression during OL development. (A) Screening scheme to identify targeting E3 ligases expressed during glial development (microarray) (Chaboub et al. 2016) and in the glial lineage (RNA-seq data) (Lin et al. 2017) that also interact with endogenous Daam2 in mouse brain (mass spectrometry). Pathway analysis of proteins from the mass spec screen with total protein levels ranked based on intensity-based absolute quantification score (iBAQ). (B) Coimmunoprecipitation of Daam2, VHL, and Nedd4 in the primary OPCs confirms that Daam2 and VHL, VHL and Nedd4, and Daam2–Nedd4 physically associate. (C) Double in situ-Immunofluorescence staining of Nedd4 in the OL lineage in the spinal cord and corpus callosum of the brain in P14 mice. Dashed line indicates white matter. Arrowheads indicate colocalization of Nedd4 with Olig2+ or PLP+ cells. (D) VHL ubiquitination assay. 293T cells were cotransfected with Flag-VHL, Myc-Nedd4, and HA-UbWT (wild type), HA-UbK63 (all six lysine [K] residues mutated to arginine [R] except K63), or HA-UbK63R (K63 residue alone mutated to R, blocking formation of K63-linked polyubiquitin chains). (Left) Representative blots for input samples before IP from three independent repeats. (Right) Representative blot for samples after IP with anti-Flag antibody conjugated beads from three independent repeats. (E) VHL protein stability assay in the presence of Nedd4 upon cycloheximide treatment. Results are mean ± SEM from three independent repeats.
Figure 4.
Figure 4.
OPC-specific Nedd4 KO recapitulates VHL loss-of-function phenotypes. (AO) Loss-of-function analysis of Nedd4 (Sox10-Cre; Nedd4F/F) in OL development in vivo. (A,B) Confirmation of Nedd4 deletion in the P0 spinal cord by immunofluorescence staining. (CH) In situ hybridization of mature OL markers for PLP+, MBP+, and OPC for PDGFRα+ cells in Nedd4 cKO versus control (Nedd4F/F) mice. (I,J) Immunostaining of VHL in Nedd4 cKO versus control mice. (KN) Quantification of the number of PLP+ (Student's t-test, [***] P < 0.0001), MBP+ cells (Student's t-test, [***] P < 0.001), PDGFRα+ cells (Student's t-test, P = 0.11670), and intensity of VHL (Student's t-test, [***] P < 0.0001). Each data point represents individual animal from three litters. Plotted values are normalized to control. (O) mRNA level of Nedd4 from P0 spinal cords of Nedd4 cKO and control by real-time qPCR. Plotted values are normalized to control. (PS) Electron microscopic analysis of the myelin structure in spinal cord and brain from the Nedd4 loss of function (NG2CreER; Nedd4F/F). Mice were injected with tamoxifen at birth and tissue harvested at P14 for further analysis. (TW) Statistical analysis of g-ratio and number of myelinated axons in the spinal cord and corpus callosum of NG2CreER; Nedd4F/F (n = 3) versus control animals (n = 4).
Figure 5.
Figure 5.
Loss of VHL abolishes the accelerated remyelination by loss of Daam2 in the LPC-induced demyelination model. (A) Experimental scheme of the lysolecithin (LPC)-induced demyelination model. NG2-CreER-derived mutants (NG2-CreER+/−; Daam2F/F, NG2-CreER+/−; VHLF/F, and NG2-CreER+/−; Daam2F/F; VHLF/F) were treated with tamoxifen at 4 wk prior to LPC injection to induce demyelination. Spinal cords were then harvested and analyzed 10 d after LPC injection. (BE) Lesion area is indicated by the dotted line. (FQ) In situ hybridization of mature OLs (PLP and MBP) and OPCs markers (PDGFRα) in the lesion. (RT) Quantification of PLP+, MBP+, and PDGFRα+ in the lesion. Each data point represents individual images from multiple animals. Values were normalized to control (one-way ANOVA with multiple comparisons, α = 0.05; [*] comparison with control; [#] comparison with D2/VHL double LOF; [**] P < 0.01; [***] P < 0.001; [#] P < 0.05; [###] P < 0.001; [####] P < 0.0001).
Figure 6.
Figure 6.
Nedd4 is required for OPC differentiation after WMI and is absent in Olig2+ cells in human MS lesions. (AH) NG2-CreER; Nedd4F/F and Nedd4F/F mice were treated with tamoxifen at 4 wk prior to LPC injection to induce demyelination. Spinal cords were then harvested and analyzed 10 d after LPC injection. (A,B) Lesion area is indicated by the dotted line. (CH) In situ hybridization for mature OL (PLP and MBP) and OPC marker (PDGFRα). (IK) Quantification of PLP+, MBP+, PDGFRα+, and in the lesion. Each data point represents individual images from multiple animals. Values were normalized to control (Student's t-test, [*] comparison with control; [*] P < 0.05; [**] P < 0.01). (LQ) Histological analysis of healthy human brains and MS lesion tissues. (L,M) Myelin is labeled by luxol fast blue (LFB), showing intact myelin in healthy tissue (L) compared with demyelinated MS lesion tissue (M). Immunohistochemical staining (IHC) of Daam2 (N,O) and HIF1α (P,Q) with Olig2. Solid arrowheads indicate colocalization with Olig2, while empty arrowheads indicate noncolocalization with Olig2. (RU) The numbers of Daam2, HIF1α, VHL, and Nedd4-positive cells over Olig2-positive cells in the control were counted. Data were acquired from five different tissues per group. Values were normalized to control (Student's t-test, [*] P < 0.01; [***] P < 0.0001).
Figure 7.
Figure 7.
Model for the Daam2–VHL–Nedd4 axis in OL development and WMI. (Left) Under healthy conditions, Nedd4 is expressed in a subset of OPCs where Daam2 is expressed at relatively low levels, and where VHL expression remains high. High VHL levels are protected against proteasomal degradation through Nedd4-mediated K63-linked ubiquitination. (Right) In white matter injury such as MS, Nedd4 expression is lost and Daam2 levels increase. This loss of Nedd4 leads to a decrease in protective K63-linked ubiquitination of VHL, while the coinciding increase in Daam2 promotes VHL degradation through the UPS pathway.

References

    1. Ambrozkiewicz MC, Kawabe H. 2015. HECT-type E3 ubiquitin ligases in nerve cell development and synapse physiology. FEBS Lett 589: 1635–1643. 10.1016/j.febslet.2015.05.009 - DOI - PubMed
    1. Amodio N, Scrima M, Palaia L, Salman AN, Quintiero A, Franco R, Botti G, Pirozzi P, Rocco G, De Rosa N, et al. 2010. Oncogenic role of the E3 ubiquitin ligase NEDD4-1, a PTEN negative regulator, in non-small-cell lung carcinomas. Am J Pathol 177: 2622–2634. 10.2353/ajpath.2010.091075 - DOI - PMC - PubMed
    1. Bhatt A, Fan L-W, Pang Y. 2014. Strategies for myelin regeneration: lessons learned from development. Neural Regen Res 9: 1347–1350. 10.4103/1673-5374.137586 - DOI - PMC - PubMed
    1. Bilić J, Huang YL, Davidson G, Zimmermann T, Cruciat CM, Bienz M, Niehrs C. 2007. Wnt induces LRP6 signalosomes and promotes dishevelled-dependent LRP6 phosphorylation. Science 316: 1619–1622. 10.1126/science.1137065 - DOI - PubMed
    1. Camera D, Coleman HA, Parkington HC, Jenkins TA, Pow DV, Boase N, Kumar S, Poronnik P. 2016. Learning, memory and long-term potentiation are altered in Nedd4 heterozygous mice. Behav Brain Res 303: 176–181. 10.1016/j.bbr.2016.01.054 - DOI - PubMed

Publication types

MeSH terms

Substances