. 2020 Aug 13;11(1):4058.
doi: 10.1038/s41467-020-17874-2.

The impact of transposable elements on tomato diversity

Affiliations

The impact of transposable elements on tomato diversity

Marisol Domínguez et al. Nat Commun. .

Erratum in

Abstract

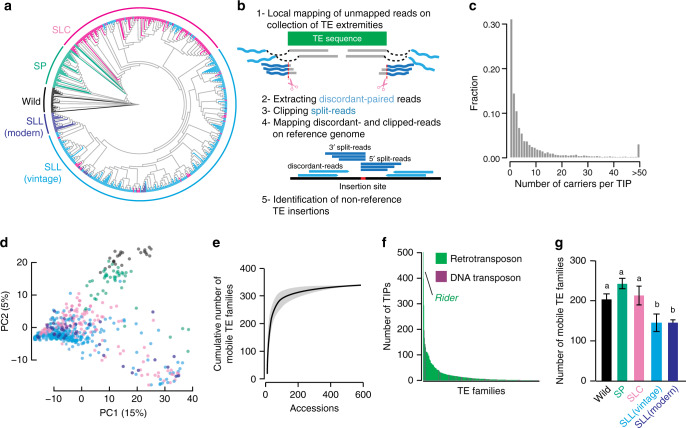
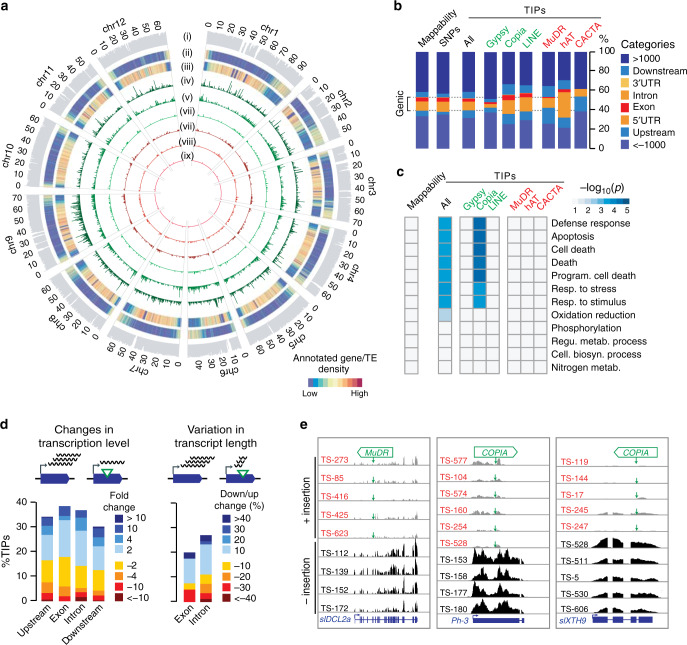
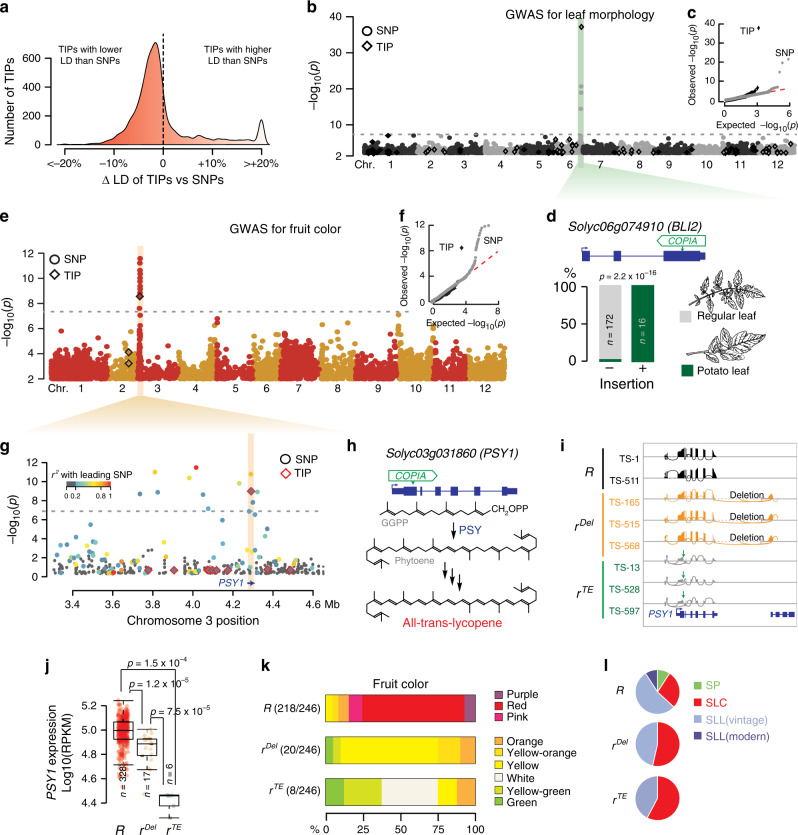
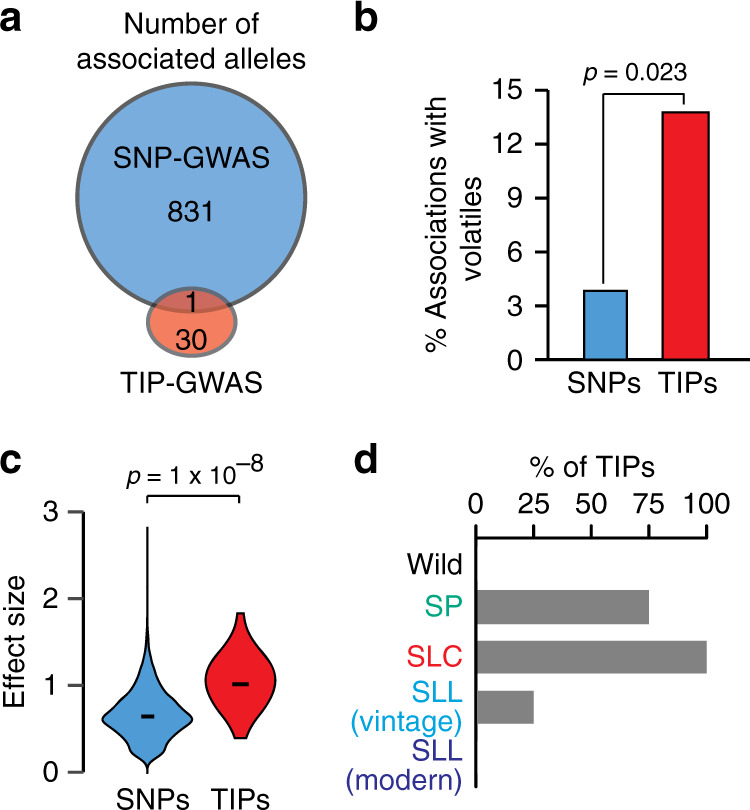
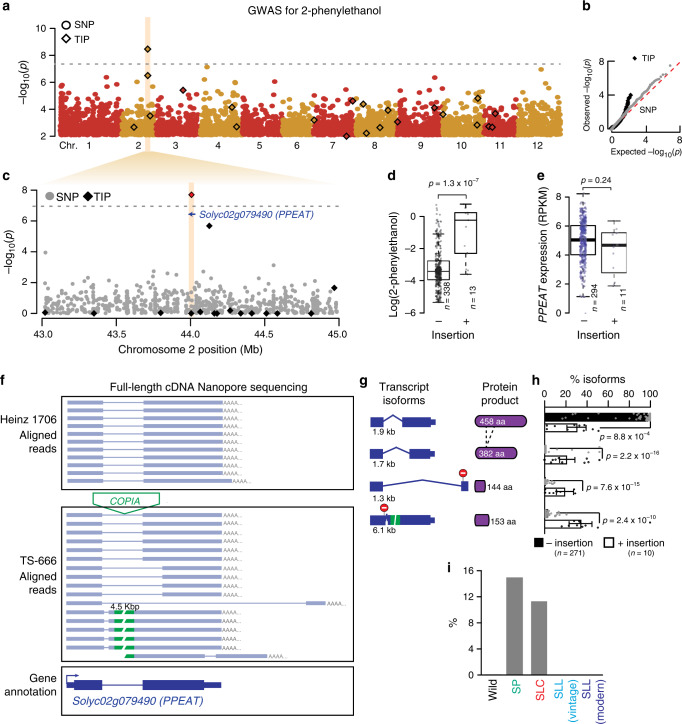
Tomatoes come in a multitude of shapes and flavors despite a narrow genetic pool. Here, we leverage whole-genome resequencing data available for 602 cultivated and wild accessions to determine the contribution of transposable elements (TEs) to tomato diversity. We identify 6,906 TE insertions polymorphisms (TIPs), which result from the mobilization of 337 distinct TE families. Most TIPs are low frequency variants and TIPs are disproportionately located within or adjacent to genes involved in environmental responses. In addition, genic TE insertions tend to have strong transcriptional effects and they can notably lead to the generation of multiple transcript isoforms. Using genome-wide association studies (GWAS), we identify at least 40 TIPs robustly associated with extreme variation in major agronomic traits or secondary metabolites and in most cases, no SNP tags the TE insertion allele. Collectively, these findings highlight the unique role of TE mobilization in tomato diversification, with important implications for breeding.


Conflict of interest statement

The authors declare no competing interests.

Figures

Fig. 1
Fig. 1. The tomato mobilome.
a Phylogeny of the 602 tomato accessions analyzed, including wild tomato relatives (Wild), wild tomatoes (S. pimpinellifolium, SP), early domesticated tomatoes (S. lycopersicum cerasiforme, SLC), and cultivated tomatoes (S. lycopersicum lycopersicum vintage and modern, SLL). b Schematic representation of the SPLITREADER bioinformatics pipeline used to identify TE insertion polymorphisms (TIPs) using split- and discordant reads. c Distribution frequency of allele counts for TIPs. d Principal component analysis based on TIPs. Colors represent tomato groups as indicated in (a). e Cumulative plot of the number of mobile TE families detected with increasing numbers of accessions. Shaded bands represent ±95% CI. f Number of detected TIPs per TE family. g Number of mobile TE families detected in each tomato group. Data are mean ±95% CI obtained by 100 bootstraps, and statistical significance for differences were obtained by a randomization test. Source data of Fig. 1a, f are provided as a Source Data file.
Fig. 2
Fig. 2. Landscape and transcriptional impact of TIPs.
a Chromosomal short-read mappability (i) and distributions of reference genes (ii) and TEs (iii) as well as TIPs by superfamily (iv–ix) across the 12 chromosomes of tomato genome. (iv) GYPSY, (v) COPIA, (vi) LINE, (vii) MuDR, (viii) hAT, and (ix) CACTA. b Distribution of TIPs over genic features. UTR, untranslated transcribed region. c GO-term analysis of genes with TIPs. d Proportion of TIP-containing genes with changes in transcription level or variation in transcript length in relation to the presence/absence of the TE insertion. e Genome browser view of RNA-seq coverage for three TIP-containing genes in accessions carrying or not the TE insertions. Green arrows indicate the position of TE insertion sites. Source data of Fig. 2c, d are provided as a Source Data file.
Fig. 3
Fig. 3. TIPs as an unregistered source of phenotypic variants.
a Distribution of the proportion of SNPs that are in lower or higher linkage disequilibrium (LD) with TIPs or other SNPs. b Manhattan plot of SNP- and TIP-based GWAS (circles and diamonds, respectively) for leaf morphology. c Observed and expected distribution of p values for SNP- and TIP-GWAS (gray circles and black diamonds, respectively). d Leaf morphology of accessions carrying or lacking a COPIA insertion within BLI2. Statistical significance for differences was obtained using two-sided Fisher test. e Manhattan plot of SNP- and TIP-based GWAS (circles and diamonds, respectively) for fruit color. f Observed and expected distribution of p values for SNP- and TIP-GWAS (gray circles and black diamonds, respectively). g Manhattan plot of SNP- and TIP-based GWAS (circles and diamonds, respectively) around PSY1. Colors indicate the linkage disequilibrium (r2) with the leading variant. h Structure of the PSY1 gene with the position of the RIDER insertion and simplified representation of lycopene biosynthesis. i Genome browser view of RNA-seq coverage over PSY1 for accessions carrying the wild-type (R) or mutant alleles (rdel and rTE) for the gene. j Quantification of PSY1 expression. For each boxplot, the lower and upper bounds of the box indicate the first (Q1) and third (Q3) quartiles, respectively, the center line indicates the median, and the whiskers represent data range, bounded to 1.5 * (Q3–Q1). Statistical significance for differences (not adjusted for multiple comparisons) was obtained using a two-sided MWU test. k Fruit color of accessions with the distinct alleles of PSY1. l Distribution of the three PSY1 alleles between tomato groups. GGPP geranylgeranyl diphosphate. Source data of Fig. 3d, e, j are provided as a Source Data file.
Fig. 4
Fig. 4. TIP associations with secondary metabolism.
a Significant associations detected by SNP- and TIP-GWAS and their overlap. b Percentage of identified loci associated with variation in volatiles. Statistical significance for differences was obtained using a two-sided Fisher test. c Effect size for association signals detected in SNP- and TIP-GWAS. Statistical significance for differences was obtained using a two-sided MWU test. d Percentage of TIPs with significant associations present within each of the five tomato groups. Source data of Fig. 4a, b, d are provided as a Source Data file.
Fig. 5
Fig. 5. A key TIP for tomato flavor.
a Manhattan plot of SNP- and TIP-based GWAS (circles and diamonds, respectively) for 2-phenylethanol. b qq-plot depicting observed and expected distribution of p values for SNP- and TIP-GWAS (gray circles and black diamonds, respectively). c Detailed view of the Manhattan plot for 2-phenylethanol spanning Solyc02g079490 (PPEAT). d. 2-phenylethanol levels in accessions carrying or not the intronic COPIA insertion. Statistical significance for differences was obtained using one-sided t test. e. PPEAT expression level in accessions carrying or not the intronic COPIA insertion. Statistical significance for differences was obtained using two-sided MWU test. f Genome Browser view of full-length cDNA nanopore reads from accessions carrying or not the intronic COPIA insertion. g PPEAT transcript isoforms, protein products, and abundance of transcript isoforms in accessions carrying or not the associated TE insertion. Data are mean ± s.d., and statistical significance for differences was obtained using two-sided MWU test. h Frequency (%) of the intronic COPIA-containing allele in each of the five tomato groups. PPEAT putative 2-phenylethanol acyl transferase. For each boxplot, the lower and upper bounds of the box indicate the first (Q1) and third (Q3) quartiles, respectively, the center line indicates the median, and the whiskers represent data range, bounded to 1.5 * (Q3–Q1). Source data of Fig. 5d, e, g, h are provided as a Source Data file.

Comment in

References

    1. Blanca J, et al. Genomic variation in tomato, from wild ancestors to contemporary breeding accessions. BMC Genomics. 2015;16:257. - PMC - PubMed
    1. Lin T, et al. Genomic analyses provide insights into the history of tomato breeding. Nat. Genet. 2014;46:1220–1226. - PubMed
    1. Gao L, et al. The tomato pan-genome uncovers new genes and a rare allele regulating fruit flavor. Nat. Genet. 2019;51:1044–1051. - PubMed
    1. Huang X, Han B. Natural variations and genome-wide association studies in crop plants. Annu. Rev. Plant Biol. 2014;65:531–551. - PubMed
    1. Eathington SR, Crosbie TM, Edwards MD, Reiter RS, Bull JK. Molecular markers in a commercial breeding program. Crop Sci. 2007;47:S–154.

Publication types

MeSH terms

Substances