. 2020 Aug 13;11(1):4056.
doi: 10.1038/s41467-020-17882-2.

Autophagy regulates fatty acid availability for oxidative phosphorylation through mitochondria-endoplasmic reticulum contact sites

Affiliations

Autophagy regulates fatty acid availability for oxidative phosphorylation through mitochondria-endoplasmic reticulum contact sites

Claudie Bosc et al. Nat Commun. .

Abstract

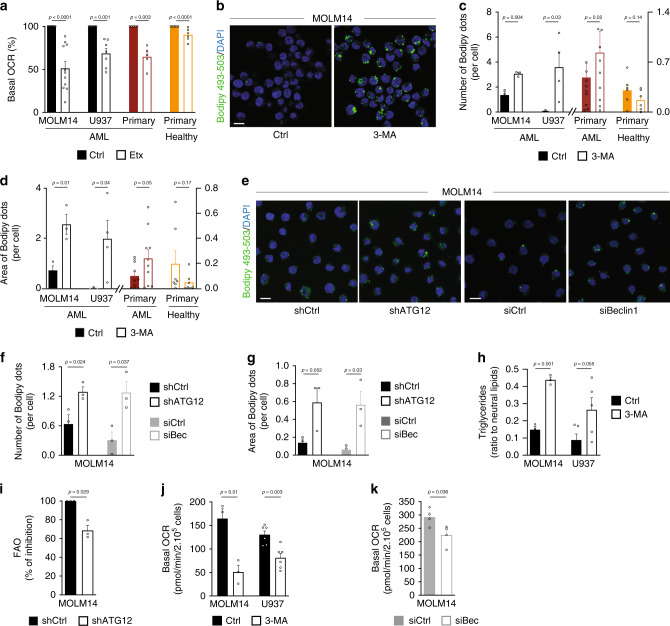
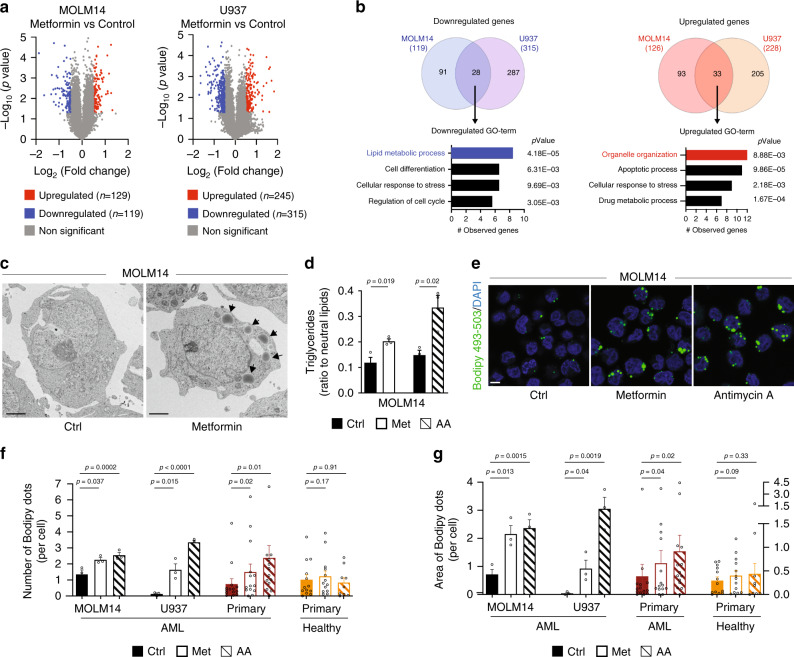
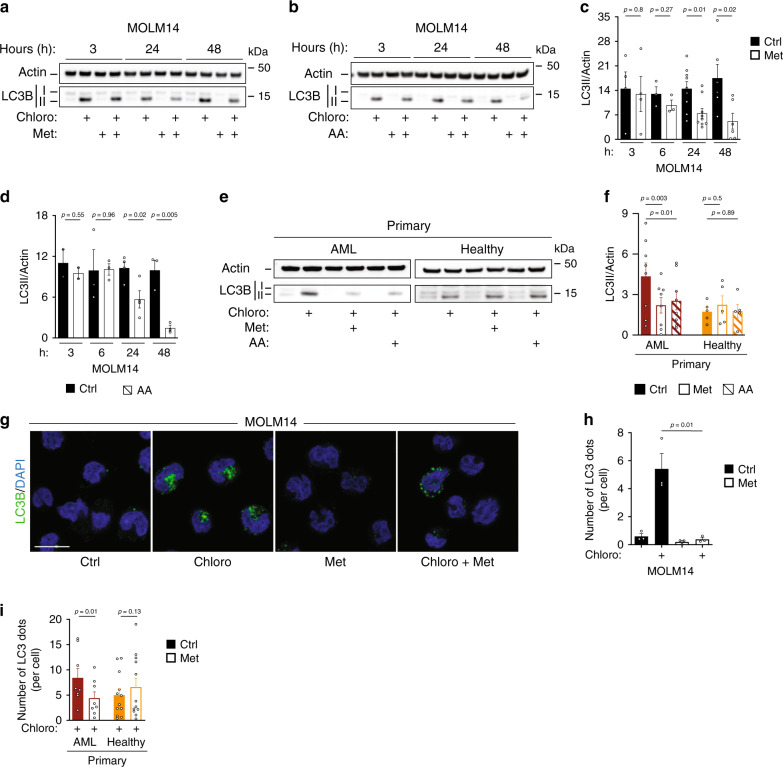
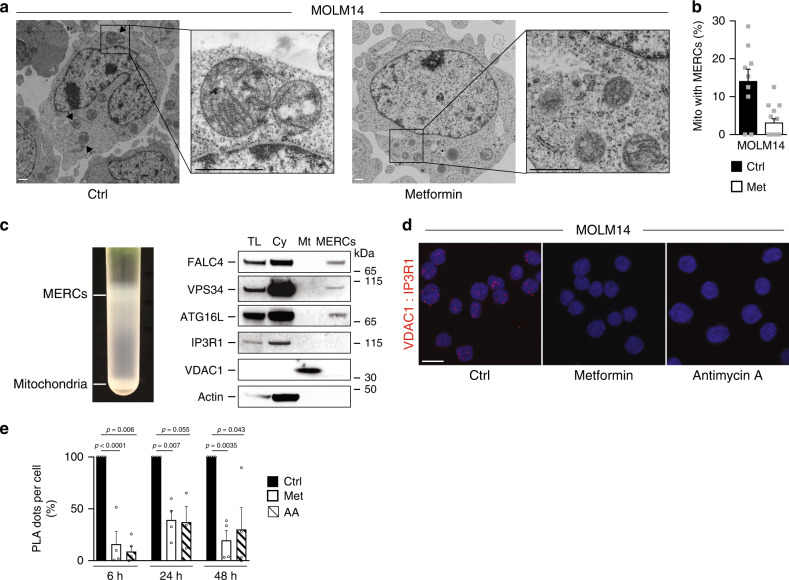
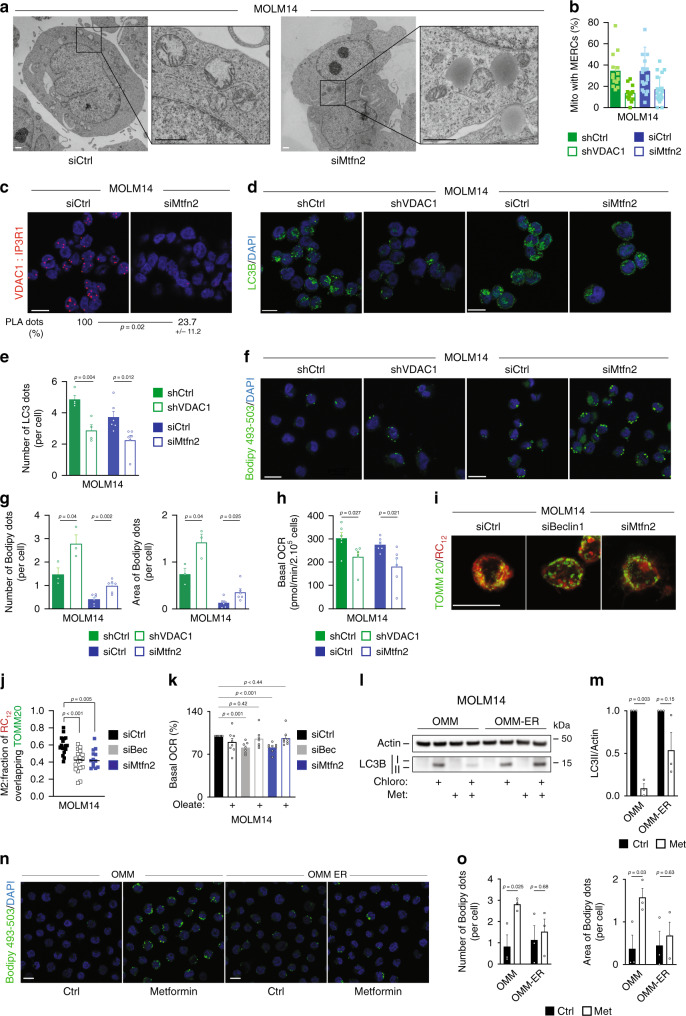
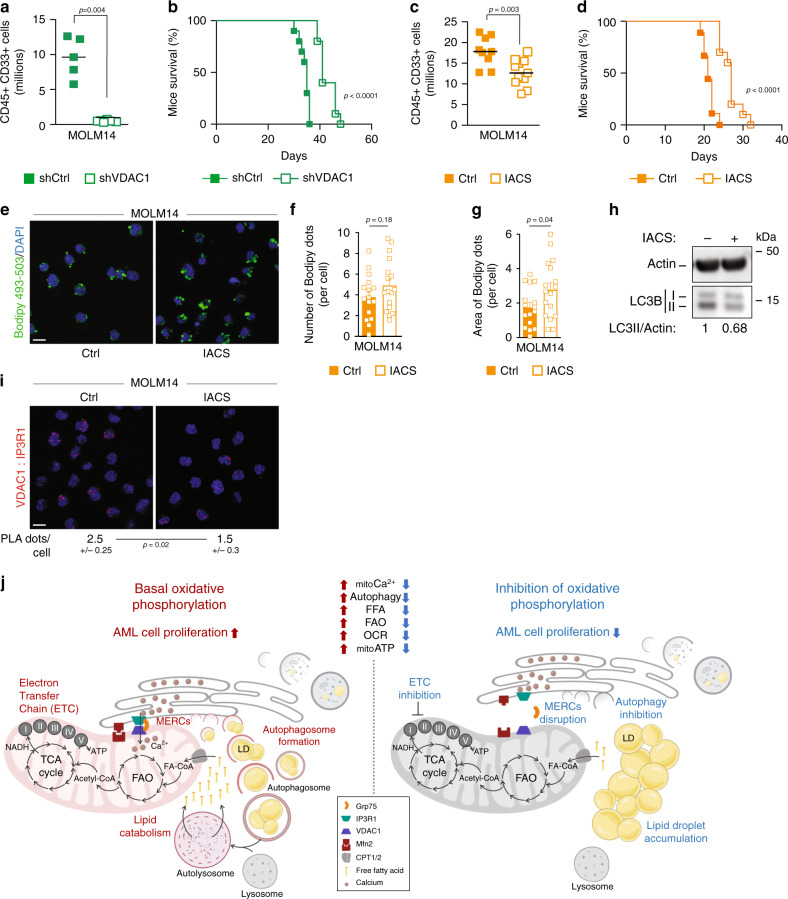
Autophagy has been associated with oncogenesis with one of its emerging key functions being its contribution to the metabolism of tumors. Therefore, deciphering the mechanisms of how autophagy supports tumor cell metabolism is essential. Here, we demonstrate that the inhibition of autophagy induces an accumulation of lipid droplets (LD) due to a decrease in fatty acid β-oxidation, that leads to a reduction of oxidative phosphorylation (OxPHOS) in acute myeloid leukemia (AML), but not in normal cells. Thus, the autophagic process participates in lipid catabolism that supports OxPHOS in AML cells. Interestingly, the inhibition of OxPHOS leads to LD accumulation with the concomitant inhibition of autophagy. Mechanistically, we show that the disruption of mitochondria-endoplasmic reticulum (ER) contact sites (MERCs) phenocopies OxPHOS inhibition. Altogether, our data establish that mitochondria, through the regulation of MERCs, controls autophagy that, in turn finely tunes lipid degradation to fuel OxPHOS supporting proliferation and growth in leukemia.


Conflict of interest statement

The authors declare no competing interests.

Figures

Fig. 1
Fig. 1. Autophagy participates to lipid catabolism to support OxPHOS.
a Seahorse measurement of basal oxygen consumption rate (OCR) in MOLM14 (n = 11) and U937 (n = 7) AML cell lines, in primary AML patient cells (n = 4) and in primary normal hematopoietic cells (PBMC n = 6; CD34+n = 3) treated or not with Etx (3 µM, 15 min; one-sample t-test). b MOLM14 cells were treated with 3-methyladenine (3-MA, 5 mM, 24 h), fixed and stained for Bodipy 493/503 and DAPI. Representative confocal pictures from three independent experiments are shown. Scale bar: 10 µm. c, d MOLM14 (n = 3) and U937 (n = 4) AML cell lines, primary AML patient cells (n = 10) and primary normal hematopoietic cells (PBMC n = 7) were treated or not with 3-MA (5 mM, 24 h), fixed, and stained for Bodipy 493/503 and DAPI. Histograms show the number (c) or the area (d) of Bodipy 493/503 dots per cell (one-sample t-test). e, g MOLM14 cells were either transduced with a shRNA directed against ATG12 or transfected with a siRNA targeting Beclin1. Cells were then stained for Bodipy 493/503 and DAPI. Representative confocal pictures from three independent experiments are shown (e). Scale bar: 10 µm. Graphs represent the number (f) or the area (g) of Bodipy 493/503 dots per cell, (n = 3, unpaired t-test). h MOLM14 (n = 3) and U937 (n = 5) cells were treated with 3-MA (5 mM, 24 h), and processed for triglycerides content analysis. Graph represents the ratio of triglycerides on total neutral lipids (unpaired t-test). i MOLM14 transduced with Ctrl or ATG12 shRNAs were examined for their rates of β-oxidation, (n = 3, one-sample t-test). j, k Seahorse measurement of basal OCR in MOLM14 (n = 3) and U937 (n = 6) cells treated or not with 3-MA for 24 h (j), or MOLM14 cells transfected with siRNA control or targeting Beclin1 (n = 4) (k) (unpaired t-test). Data are means ± s.e.m.
Fig. 2
Fig. 2. Inhibition of OxPHOS affects lipid metabolism.
a Volcano plots displaying fold change versus adjusted p-values of MOLM14 (left) and U937 (right) cells treated with 10 mM of metformin (Met) for 24 h (p-value < 0.05, absolute log2 fold change > 0.5, unpaired t-test). b Venn diagram representing overlap between MOLM14 and U937 downregulated (left) and upregulated (right) genes. Enrichment analysis of Gene Ontology (GO) classification for common downregulated (left) and upregulated (right) genes by Genomatics software analysis (Fisher’s exact test). c MOLM14 cells treated with Met (10 mM) for 24 h were fixed and processed for transmission electron microscopy analysis. Representative electron microscopy pictures from two independent experiments are shown. Arrows indicate lipid droplets. Scale bar: 2 µm. d MOLM14 cells were treated with Met or with antimycin A (AA) and processed for triglycerides content analysis, (n = 3, unpaired t-test). e MOLM14 cells were treated with Met or with AA, fixed and stained for Bodipy 493/503 and DAPI. Representative confocal pictures from three independent experiments are shown. Scale bar: 10 µm. f, g MOLM14 (n = 3) and U937 (n = 3) AML cell lines, primary AML patient cells (n = 14) and primary normal hematopoietic cells (PBMC n = 9; CD34+n = 4) were treated with Met or with AA for 48 h, fixed, and stained for Bodipy 493/503 and DAPI. Histograms show the number (f) or the area (g) of Bodipy 493/503 dots per cell (unpaired t-test or paired t-test for patients’ samples). Data are means ± s.e.m.
Fig. 3
Fig. 3. Inhibition of OxPHOS reduces autophagic flux.
a, b Western blots of LC3B and actin from at least three independent experiments of MOLM14 cells treated with metformin (Met) (a) or with antimycin A (AA) (b) ± chloroquine (chloro) for the indicated times are shown. c, d LC3B-II/actin ratios identified by densitometries from Western blots shown in a, b in MOLM14 cells treated with Met (c) or with AA (d) in presence of chloro. Data are means ± s.e.m, (at least n = 3, unpaired t-test). e Western blots of LC3B and actin from primary AML (n = 8) or normal (n = 5) cells treated with Met or with AA ± chloro. f Primary AML patient cells (n = 8 with Met, n = 8 with AA) and primary normal hematopoietic cells (PBMC) were treated with Met (n = 5) or AA (n = 5) for 48 h in presence of chloro followed by immunoblotting for LC3B and actin. Histograms represent the LC3B/actin ratios obtained by densitometric analysis of Western blots (paired t-test). g, h Representative confocal pictures from three independent experiments of MOLM14 cells treated with Met for 48 h ± chloro, fixed and stained for LC3B and DAPI. Scale bar: 10 µm. g Histograms represent the number of LC3B puncta per cell (h), (n = 3, unpaired t-test). i Primary AML patient cells (n = 8) and primary normal hematopoietic cells (PBMC n = 8, CD34+n = 4) were treated or not with Met for 48 h ± chloro, fixed and stained for LC3B and DAPI. Histograms represent the number of LC3B puncta per cell (paired t-test). Data are means ± s.e.m.
Fig. 4
Fig. 4. OxPHOS regulates MERCs number and function.
a MOLM14 cells treated with metformin (Met, 10 mM) for 24 h were fixed and processed for electron microscopy analysis. Representative electron microscopy pictures from two independent experiments are shown. Arrows indicate MERCs. Scale bar: 1 µm. b Histograms represent the % of mitochondria that are in contact with endoplasmic reticulum per cell treated or not with Met from pictures displayed in a. Data are means ± s.e.m with each dot corresponding to one cell. c Protein components of subcellular fractions (left panel) from two independent experiments prepared from MOLM14 cells revealed by immunoblot analysis (right panel). TL: total lysate, Cy: cytosol, Mt: pure mitochondrial fraction, MERCs: mitochondria–ER contact site fraction. d Representative orthogonal confocal projections of Z sections of PLA (red signal) between VDAC1 and IP3R1 from MOLM14 cells treated or not with Met or antimycin A (AA) for 48 h (at least n = 3). Scale bar: 10 µm e Quantitative analysis of PLA signal between VDAC1 and IP3R1 from MOLM14 cells treated or not with Met or AA for 6 h, 24 h or 48 h (n = 4, one-sample t-test). Data are means ± s.e.m.
Fig. 5
Fig. 5. MERCs regulate lipophagy to sustain OxPHOS.
a MOLM14 cells transfected with siRNA control (Ctrl) or mitofusin2 (Mtfn2) were processed for electron microscopy analysis. Electron microscopy pictures from one experiment are shown. Scale bar: 1 µm. b Histograms represent the % of mitochondria in contact with ER. Each dot corresponding to one cell. c Images of proximity ligation assay between VDAC1 and IP3R1 from MOLM14 transfected with Ctrl or Mtfn2 siRNAs (n = 3). Scale bar: 10 µm. Numbers represent the % of dots in cells transfected with siRNA Mtfn2 compared with cells transfected with siRNA Ctrl. d, e MOLM14 cells were transduced with Ctrl or VDAC1 shRNAs (n = 4) or transfected with Ctrl or Mtfn2 siRNAs (n = 6), and stained for LC3B and DAPI. Confocal sections (at least four independent experiments) are shown. Scale bar: 10 µm (d). Histograms represent the number of LC3B puncta per cell (e) (unpaired t-test). f, g MOLM14 cells transduced with Ctrl or VDAC1 shRNAs (n = 3) or transfected with Ctrl or Mtfn2 siRNAs (n = 6) were stained for Bodipy and DAPI. Scale bar: 10 µm, (f). Histograms show the number or the area of Bodipy dots per cell (g) (unpaired t-test). h Measurement of basal oxygen consumption rate (OCR) in MOLM14 cells transduced with Ctrl or VDAC1 shRNAs (n = 6) or transfected with Ctrl or Mtfn2 siRNAs (n = 6, unpaired t-test). i, j MOLM14 cells transfected with Ctrl or Beclin1 (Bec) or Mtfn2 siRNAs and incubated with RC12, were stained for TOMM20 and confocal Z-stacks were acquired (three independent experiments). Scale bar: 10 µm (i). Fraction of RC12 overlapping TOMM20 staining (j). siCtrl (n = 17), siBec (n = 18), and siMtfn2 (n = 13, unpaired t-test). k Measurement of OCR in MOLM14 cells transfected with Ctrl (n = 8), Bec (n = 7), or Mtfn2 siRNAs (n = 8) ± Oleate-BSA. lo MOLM14 cells were transduced with the mitochondria–ER organelle linker (OMM-ER) and its control (OMM), treated ± metformin, and subjected to Western blot analysis for actin and LC3B (l, m) or stained for Bodipy and DAPI (n, o) (three independent experiments). Scale bar: 10 µm. Histograms represent the number of LC3B puncta (m) or the area of Bodipy dots per cell (o) unpaired t-test. Data are means ± s.e.m.
Fig. 6
Fig. 6. MERCs support the dialog between autophagy and OxPHOS.
a, b NSG mice (n = 31) were engrafted with MOLM14 cells expressing the Ctrl or VDAC1 shRNAs by intravenous injection. Seventeen days post graft, five mice shCtrl and six mice shVDAC1 were killed, and the number of human cells (hCD45+ and hCD33+) in the bone marrow and spleen was analyzed by flow cytometry. Graphs represent the number of human positive cells for hCD45 and hCD33 within the murine bone marrow and spleen from one experiment (a) (unpaired t-test). The remaining mice per group were used for overall survival analysis (b). Graph represents the Kaplan–Meier survival curves (Log-rank test). c, d NSG mice (n = 39) were engrafted with MOLM14 cells and daily treated with vehicle or IACS-010759 by gavage. Seventeen days post graft, nine mice vehicle group and 11 mice IACS-010759-treated group were killed, and the number of human cells (hCD45+ and hCD33+) in the bone marrow and spleen was analyzed by flow cytometry. Graphs represent the number of human positive cells for hCD45 and hCD33 within the murine bone marrow and spleen (c) (unpaired t-test). The remaining mice were used for overall survival analysis (d). Graph represents the Kaplan–Meier survival curves (Log-rank test). eg Viable bone marrow AML blasts from mice treated with IACS-010759 were stained for Bodipy 493/503 and DAPI. Scale bar: 10 µm (e). Histograms show the number or the area of Bodipy 493/503 dots per cell (f, g) (unpaired t-test). h Viable bone marrow AML blasts from mice treated with IACS-010759 (one experiment) were subjected to Western blot analysis for actin and LC3B. Numbers indicate ratios obtained by densitometric analysis. i Purified viable bone marrow AML blasts from mice treated with IACS-010759 (one experiment) were subjected to PLA assay. Numbers represent the number of PLA dots per cell (minimum 130 cells, unpaired t-test). Scale bar: 10 µm (j). Schematic diagram depicting the interplay between the autophagy process and the mitochondria in AML cells. Autophagy appears as a major regulator of mitochondria activity with the mitochondria controlling its supply of FFAs by regulating the number of autophagosomes via the formation MERCs. Data are means ± s.e.m.

References

    1. Klionsky DJ. Autophagy: from phenomenology to molecular understanding in less than a decade. Nat. Rev. Mol. Cell Biol. 2007;8:931–937. - PubMed
    1. Moreau K, Luo S, Rubinsztein DC. Cytoprotective roles for autophagy. Curr. Opin. Cell Biol. 2010;22:206–211. - PMC - PubMed
    1. Kuma A, et al. The role of autophagy during the early neonatal starvation period. Nature. 2004;432:1032–1036. - PubMed
    1. Karsli-Uzunbas G, et al. Autophagy is required for glucose homeostasis and lung tumor maintenance. Cancer Discov. 2014;4:914–927. - PMC - PubMed
    1. Guo JY, et al. Activated Ras requires autophagy to maintain oxidative metabolism and tumorigenesis. Genes Dev. 2011;25:460–470. - PMC - PubMed

Publication types

MeSH terms