. 2020 Aug 13;11(1):4054.
doi: 10.1038/s41467-020-17807-z.

Deep neural networks enable quantitative movement analysis using single-camera videos

Affiliations

Deep neural networks enable quantitative movement analysis using single-camera videos

Łukasz Kidziński et al. Nat Commun. .

Abstract

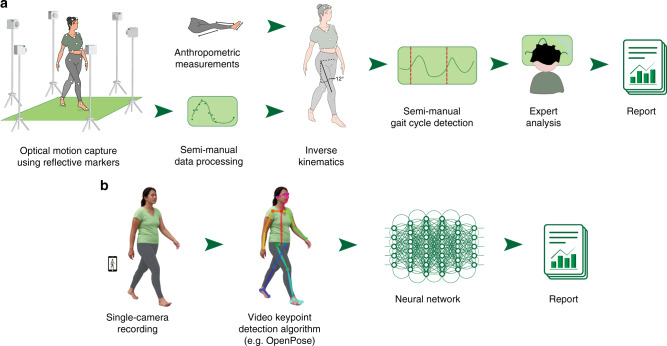
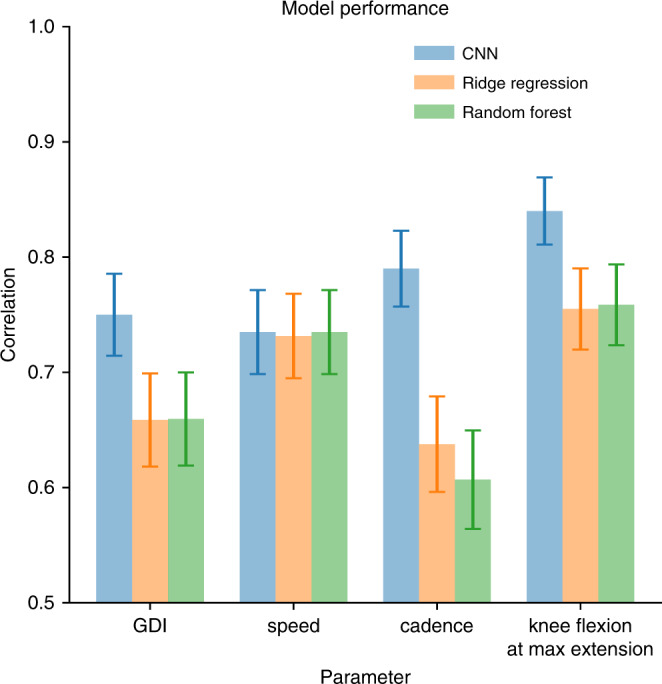
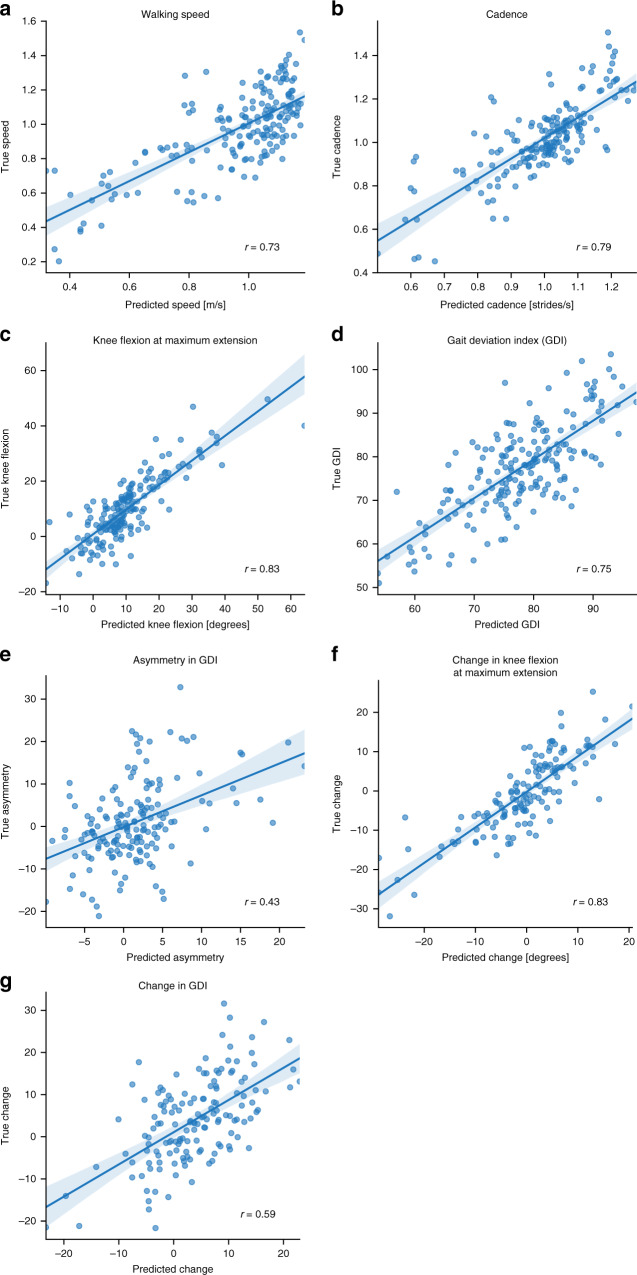
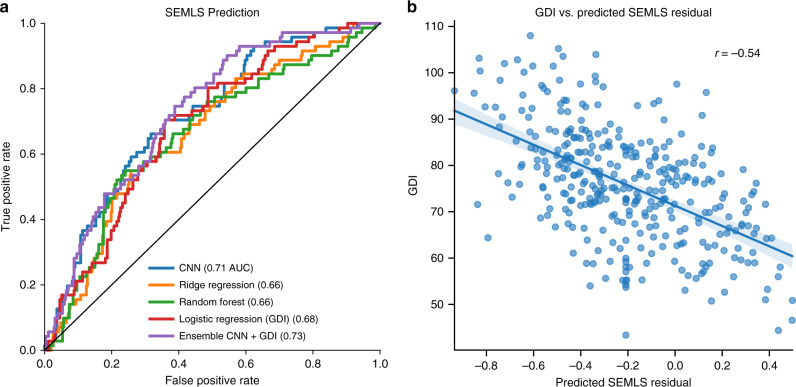
Many neurological and musculoskeletal diseases impair movement, which limits people's function and social participation. Quantitative assessment of motion is critical to medical decision-making but is currently possible only with expensive motion capture systems and highly trained personnel. Here, we present a method for predicting clinically relevant motion parameters from an ordinary video of a patient. Our machine learning models predict parameters include walking speed (r = 0.73), cadence (r = 0.79), knee flexion angle at maximum extension (r = 0.83), and Gait Deviation Index (GDI), a comprehensive metric of gait impairment (r = 0.75). These correlation values approach the theoretical limits for accuracy imposed by natural variability in these metrics within our patient population. Our methods for quantifying gait pathology with commodity cameras increase access to quantitative motion analysis in clinics and at home and enable researchers to conduct large-scale studies of neurological and musculoskeletal disorders.


Conflict of interest statement

The authors declare no competing interests.

Figures

Fig. 1
Fig. 1. Comparison of the current clinical workflow with our video-based workflow.
a In the current clinical workflow, a physical therapist first takes a number of anthropometric measurements and places reflective markers on the patient’s body. Several specialized cameras track the positions of these markers, which are later reconstructed into 3D position time series. These signals are converted to joint angles as a function of time and are subsequently processed with algorithms and tools unique to each clinic or laboratory. b In our proposed workflow, data are collected using a single commodity camera. We use the OpenPose algorithm to extract trajectories of keypoints from a sagittal-plane video. We present an example input frame, and then the same frame with detected keypoints overlaid. To illustrate the detected pose, the keypoints are connected. Next, these signals are fed into a neural network that extracts clinically relevant metrics. Note that this workflow does not require manual data processing or specialized hardware, allowing monitoring at home.
Fig. 2
Fig. 2. Comparison of prediction accuracy for models using video signals.
We compare three methods: convolutional neural network (CNN), random forest, and ridge regression. To predict each of the four gait metrics (speed, cadence, GDI, and knee flexion angle at maximum extension), we trained a model on a training set, choosing the best parameters on the validation set. The reported values of bars are the correlation coefficients between the true and predicted values for each metric, evaluated on the test set. Error bars represent standard errors derived using bootstrapping (n = 200 bootstrapping trials).
Fig. 3
Fig. 3. Convolution neural network (CNN) model performance.
We evaluated the correlation, r, between the true gait metric values from motion capture data and the predicted values from the video keypoint time-series data and our model. Our model predicted (a) speed, (b) cadence, (c) knee flexion angle at maximum extension, and (d) Gait Deviation Index. We also did a post-hoc analysis to predict (e) asymmetry in GDI, as well as longitudinal changes in (f) knee flexion angle at maximum extension and (g) GDI. In all plots, the straight blue line corresponds to the best linear fit to predicted vs. observed data while light bands correspond to the 95% confidence interval for the regression curve derived using bootstrapping (n = 200 bootstrapping trials).
Fig. 4
Fig. 4. Correlation between GDI prediction residuals and non-sagittal-plane kinematics.
The residuals from predicting GDI from video are correlated with the mean (a) foot progression and (b) hip adduction angles derived from optical motion capture. These correlations suggest that the foot progression and hip adduction angles, which are inputs to the calculation of ground-truth GDI, are not fully captured in the sagittal-plane video. We tried linear and quadratic models and chose the better one by the Bayesian Information Criterion. In each plot, the blue curve corresponds to the best quadratic fit to predicted vs. observed data while the light band corresponds to the 95% confidence interval for the regression curve derived using bootstrapping (n = 200 bootstrapping trials). We tested if each fit is significant by using the F-test and we reported corresponding p values.
Fig. 5
Fig. 5. Analysis of models for treatment decision prediction.
a Our CNN model outperformed ridge regression and random forest models that used summary statistics of the time series (see Methods) and the logistic regression model using only GDI. b Residuals from the CNN model to predict SEMLS treatment decisions correlate with GDI. The straight blue line corresponds to the best linear fit to predicted vs. observed data while the light band corresponds to the 95% confidence interval for the regression curve derived using bootstrapping (n = 200 bootstrapping trials).
Fig. 6
Fig. 6. Convolutional neural network architecture.
Our CNN is composed of four types of blocks. The convolutional block (ConvBlock) maps a multivariate time series (w × d) into another multivariate time series (w × f) using f parameterized one-dimensional convolutions (d × s), i.e. sliding filters with learnable parameters. Convolutions are followed by a nonlinear activation function and a normalization component. The maximum pooling block (MaxPooling) extracts the maximum value from a sequence of r values, thus reducing the dimensionality from w to w/r. The flattening block (Flatten) changes the shape of an array of dimensions w × d to a vector of dimensions dw. Dense block (dense) is a multiple linear regression from d1 dimensional space to d2 dimensional space with a nonlinear function at the output (see Methods). The diagram on the right shows the sequential combination of these blocks used in our final model.

References

    1. Hanakawa T, Fukuyama H, Katsumi Y, Honda M, Shibasaki H. Enhanced lateral premotor activity during paradoxical gait in Parkinson’s disease. Ann. Neurol. 1999;45:329–336. doi: 10.1002/1531-8249(199903)45:3<329::AID-ANA8>3.0.CO;2-S. - DOI - PubMed
    1. Al-Zahrani KS, Bakheit AMO. A study of the gait characteristics of patients with chronic osteoarthritis of the knee. Disabil. Rehabil. 2002;24:275–280. doi: 10.1080/09638280110087098. - DOI - PubMed
    1. von Schroeder HP, Coutts RD, Lyden PD, Billings E, Jr, Nickel VL. Gait parameters following stroke: a practical assessment. J. Rehabil. Res. Dev. 1995;32:25–31. - PubMed
    1. Gage, J. R., Schwartz, M. H., Koop, S. E. & Novacheck, T. F. The identification and treatment of gait problems in cerebral palsy. (John Wiley & Sons, 2009).
    1. Martin CL, et al. Gait and balance impairment in early multiple sclerosis in the absence of clinical disability. Mult. Scler. 2006;12:620–628. doi: 10.1177/1352458506070658. - DOI - PubMed

Publication types