. 2020 Aug 13;11(1):4044.
doi: 10.1038/s41467-020-17836-8.

Optogenetic control of protein binding using light-switchable nanobodies

Affiliations

Optogenetic control of protein binding using light-switchable nanobodies

Agnieszka A Gil et al. Nat Commun. .

Abstract

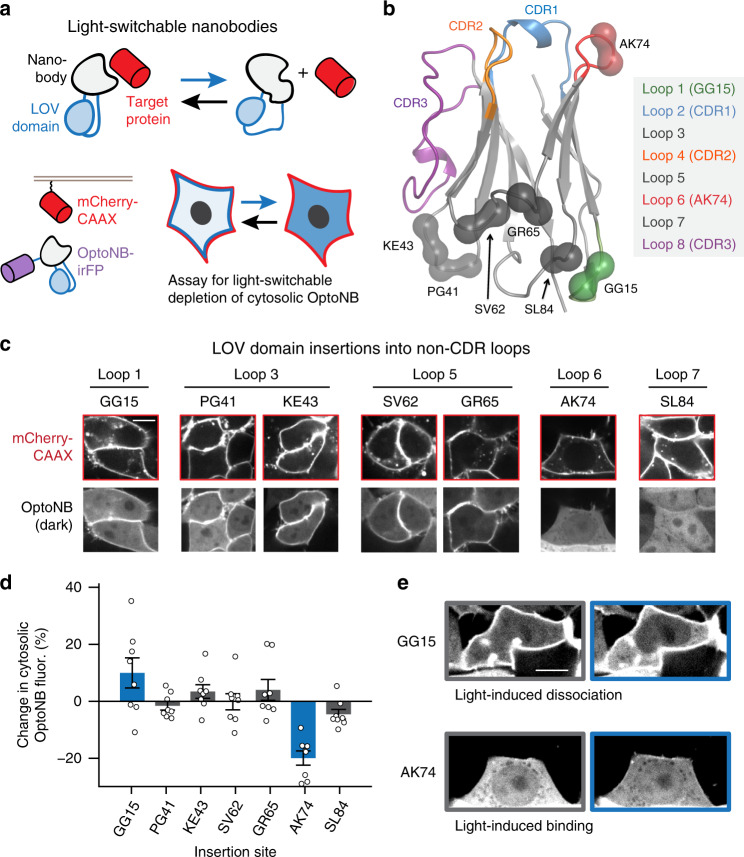
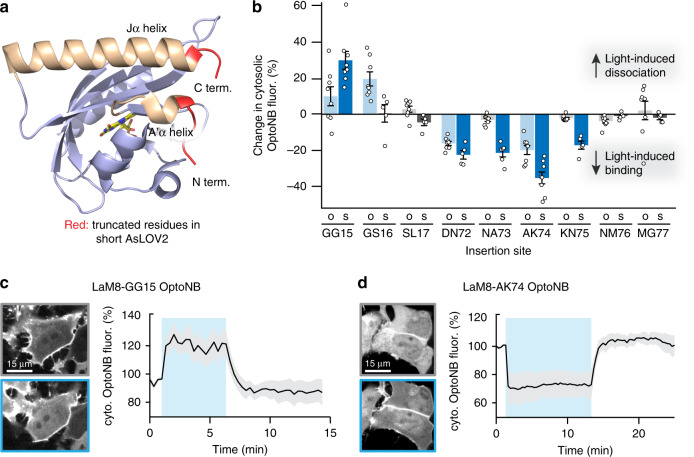
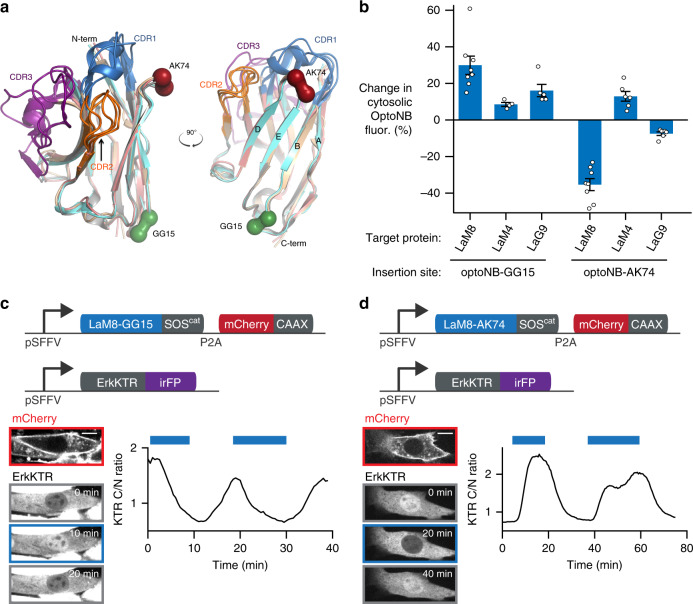
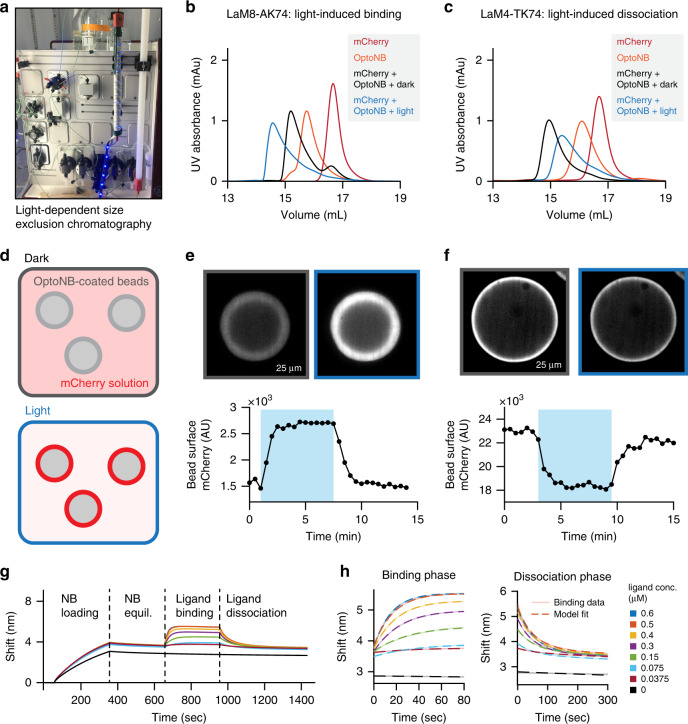
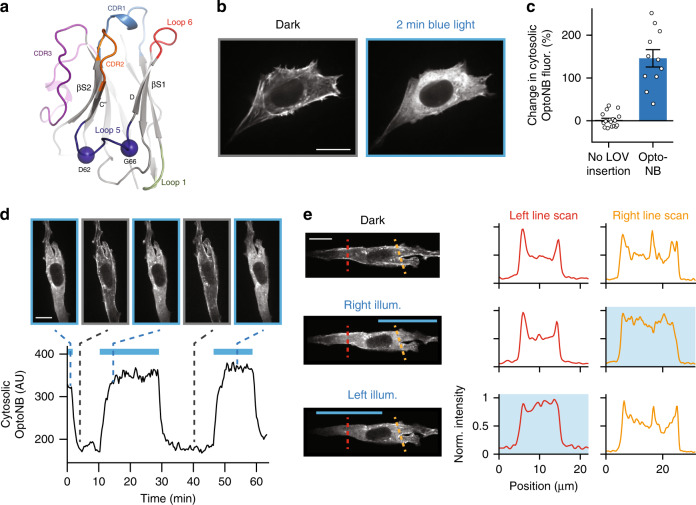
A growing number of optogenetic tools have been developed to reversibly control binding between two engineered protein domains. In contrast, relatively few tools confer light-switchable binding to a generic target protein of interest. Such a capability would offer substantial advantages, enabling photoswitchable binding to endogenous target proteins in cells or light-based protein purification in vitro. Here, we report the development of opto-nanobodies (OptoNBs), a versatile class of chimeric photoswitchable proteins whose binding to proteins of interest can be enhanced or inhibited upon blue light illumination. We find that OptoNBs are suitable for a range of applications including reversibly binding to endogenous intracellular targets, modulating signaling pathway activity, and controlling binding to purified protein targets in vitro. This work represents a step towards programmable photoswitchable regulation of a wide variety of target proteins.


Conflict of interest statement

A patent application describing the opto-nanobody design and applications is currently pending. Inventors: Jared E. Toettcher, José L. Avalos, Wilson Max, Alex Goglia, Evan M. Zhao, Agnieszka A. Gil, and César Carrasco-López. Application number: 62962517, pending. The remaining authors declare no competing interests.

Figures

Fig. 1
Fig. 1. Initial screen for light-controllable opto-nanobodies (OptoNBs).
a Schematic of approach. By insertion into a solvent-exposed turn or loop, the light-switchable AsLOV2 domain (blue) could modulate the conformation of a nanobody (gray), thus allosterically altering its ability to bind to a target protein (red). Cytosolic iRFP-fused OptoNBs were assayed for translocation to membrane-bound mCherry in the presence or absence of blue light. b Positions targeted for LOV domain insertions mapped onto the crystal structure of an anti-GFP minimizer nanobody (PDB ID: 3G9A). Spheres indicate the residues between which the LOV domain was inserted. Loops of interest and the hypervariable complementarity-determining regions (CDRs) are colored according to the legend. c Representative images for all LOV insertions. HEK293 cells expressing membrane-tethered mCherry (mCherry-CAAX) and cytosolic OptoNB-iRFP (OptoNB) are shown. d Quantification of light-induced change in cytosolic intensity for each OptoNB variant in (c). An increase in cytosolic OptoNB fluorescence corresponds to light-induced dissociation from membrane-bound mCherry, and vice versa for light-induced decrease in cytosolic iRFP. Error bars indicate mean ± SEM for n = 8 cells per variant. e Images before (gray box) and after (blue box) light stimulation for HEK293T cells expressing mCherry-CAAX and either of two OptoNB variants, LaM8-AK74 and LaM8-GG15, showing light-dependent changes in OptoNB localization. Images are representative of three replicate experiments. Scale bars: 10 μm. Source data are available as a Source data file.
Fig. 2
Fig. 2. An optimized short-LOV domain for OptoNB engineering.
a AsLOV2 crystal structure (PDB ID: 2V0U) indicating amino acids removed (red) to generate the optimized short AsLOV2 (408–543) for nanobody insertions. b Comparison of photoswitchable OptoNB binding in original AsLOV2 (‘o’) and short AsLOV2 (‘s’) for 9 insertion sites near the original two hits, GG15 and AK74. Blue bars indicate a light-induced change; gray bars indicate no photosensitive response. Error bars indicate the mean + SEM of the light-induced change in cytosolic intensity for n = 8 cells per variant. c, d Light-induced membrane/cytosol translocation in HEK293T cells for the LaM8-AK74 (in c) and LaM8-GG15 (in d) OptoNBs. The percent change in cytosolic intensity from the original, dark-equilibrated value is shown. Curves and shaded regions indicate mean ± SD for n = 10 cells per variant. Source data are available as a Source data file.
Fig. 3
Fig. 3. OptoNBs can be deployed against multiple targets and used to control intracellular signaling.
a Superimposed nanobody structures with diverse binding modes: the anti-GFP minimizer nanobody in gray (PDB ID: 3G9A), anti-EGFR 7D12 in blue (PDB ID: 4KRL), anti-VGLUT Nb9 in beige (PDB ID: 5OCL), anti-Gelsolin Nb11 in pink (PDB ID: 4S10), and anti-CD38 MU551 in green (PDB ID: 5F1O). The CDRs, GG15 position, and AK74 position are highlighted in colors as indicated. b Light-induced translocation from nucleus to cytosol of LaM8, LaM4, and LaG9 OptoNBs with LOV insertion at GG15 or AK74. The change in cytosolic intensity from the original, dark-equilibrated value is shown. Error bars indicate mean ± SEM for n = 8, 4, 5, 8, 6, and 6 cells, respectively. c, d NIH3T3 cell lines harboring OptoNB-controlled Ras/Erk pathway activity using LaM8-GG15 (in c) and LaM8-AK74 (in d). Upper diagrams show lentiviral constructs expressed in each cell: membrane-localized mCherry-CAAX, OptoNB-SOScat, and a live-cell biosensor of Erk activity (ErkKTR-iRFP). Lower diagrams indicate mCherry and ErkKTR expression and localization for representative cells. Curves show the cytosolic-to-nuclear ratio of ErkKTR for a representative cell when pulsed with blue light (blue bars). Images are representative of three replicate experiments. Scale bars: 10 μm. Source data are available as a Source data file.
Fig. 4
Fig. 4. In vitro characterization of OptoNB binding.
a Size exclusion chromatography (SEC) for light-dependent protein separation. The column was wrapped with 450 nm blue LEDs to allow for direct illumination of the protein during the SEC run, or in aluminum foil to keep it in darkness. b, c SEC elution profile for LaM8-AK74 (in b) and LaM4 TK74 (in c) in light conditions; for additional runs in the light and dark see Supplementary Fig. 4a, b. Free mCherry, free OptoNB, and dark- and light-incubated OptoNB/mCherry mixtures are shown in the indicated curves. Shorter retention times indicate larger size and increased complex formation. d Schematic representing light-induced binding of mCherry to OptoNB-coated beads. His-tagged OptoNBs are immobilized on Ni-NTA agarose beads, while untagged mCherry is in the buffer solution surrounding the beads. A change in illumination conditions results in mCherry-OptoNB binding and a brighter bead surface in the mCherry channel. e, f Top panels: confocal mCherry images of beads coated with a mixture of His-tagged EGFP with His-tagged LaM8-AK74 in a 200:1 ratio (in e) or LaM8-GG15 in a 1000:1 ratio (in f). Beads were placed in 1 μM mCherry solution (in e) or 2 μM mCherry solution (in f). A 450 nm LED was toggled on and off (blue shading indicates LED illumination). Bottom panels: quantification of bead surface intensity during cycles of darkness and blue light illumination. Images are representative of three replicate experiments. g Representative bio-layer interferometry (BLI) traces for quantifying nanobody-protein binding and dissociation kinetics. Four phases indicate His-tagged OptoNB loading onto the Ni-NTA coated tips, equilibration in buffer, binding to different concentrations of soluble mCherry, and mCherry dissociation into buffer. h Raw data (solid lines) and best-fit traces simultaneously fit to simple mass-action kinetic binding model (dashed lines) are shown for the immobilized LaM8 nanobody binding to soluble mCherry at eight concentrations. Source data are available as a Source data file.
Fig. 5
Fig. 5. Development and characterization of an anti-actin OptoNB.
a Position DG62-66 targeted for the LOV domain insertion into the α-actin nanobody and mapped onto the crystal structure of the anti-GFP minimizer nanobody (PDB ID: 3G9A). Residues D62 and G66 (blue spheres) are highlighted within Loop 5 (dark blue). CDRs, Loop 1, and Loop 6 are colored as previously described in Fig. 1. b Still frames showing dark and illuminated conditions for a cell expressing the actin OptoNB fused to TagRFP. c Light-induced translocation of actin OptoNBs. The light-induced change in cytosolic intensity from the original, dark-equilibrated value is shown. Error bars indicate means ± SEM for n = 17 and 11 cells, respectively. d Reversible actin OptoNB translocation to and from the cytoskeleton in a representative cell. Curve indicates the mean intensity in a cytosolic region in response to pulses of blue light (blue bars). Upper images show the cell at the indicated time points. e Spatial illumination leads to local nanobody unbinding. Left panels: representative images of a representative cell that was left un-illuminated or illuminated for 10 min on its left or right half. Dashed lines indicate positions of line scans for quantifying local enrichment along actin filaments. Right panels: quantification of actin OptoNB fluorescence along the line scans in dark, left, or right illumination. Scale bars: 20 μm. Source data are available as a Source data file.

References

    1. Shimizu-Sato S, Huq E, Tepperman JM, Quail PH. A light-switchable gene promoter system. Nat. Biotechnol. 2002;20:1041–1044. - PubMed
    1. Boyden ES, Zhang F, Bamberg E, Nagel G, Deisseroth K. Millisecond-timescale, genetically targeted optical control of neural activity. Nat. Neurosci. 2005;8:1263–1268. - PubMed
    1. Levskaya A, Weiner OD, Lim WA, Voigt CA. Spatiotemporal control of cell signalling using a light-switchable protein interaction. Nature. 2009;461:997–1001. - PMC - PubMed
    1. Guntas G, et al. Engineering an improved light-induced dimer (iLID) for controlling the localization and activity of signaling proteins. Proc. Natl Acad. Sci. USA. 2015;112:112–117. - PMC - PubMed
    1. Kennedy MJ, et al. Rapid blue-light-mediated induction of protein interactions in living cells. Nat. Methods. 2010;7:973–975. - PMC - PubMed

Publication types