. 2020 Aug 13;11(1):4051.
doi: 10.1038/s41467-020-17753-w.

Clearance of HIV infection by selective elimination of host cells capable of producing HIV

Affiliations

Clearance of HIV infection by selective elimination of host cells capable of producing HIV

Min Li et al. Nat Commun. .

Erratum in

Abstract

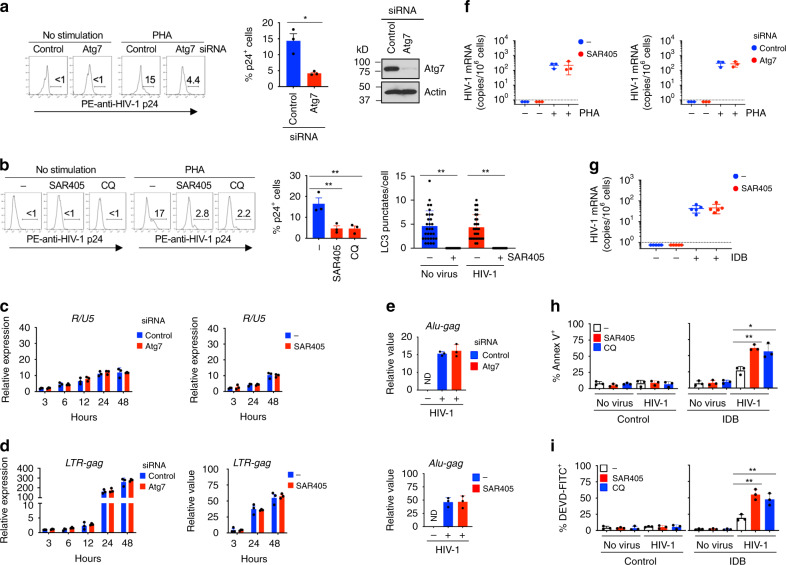
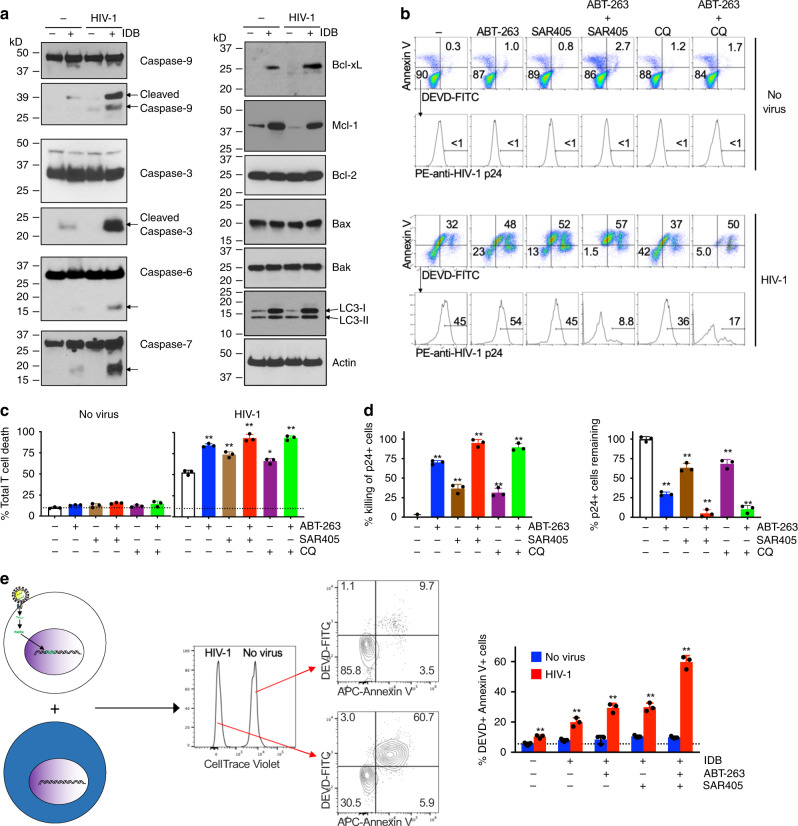
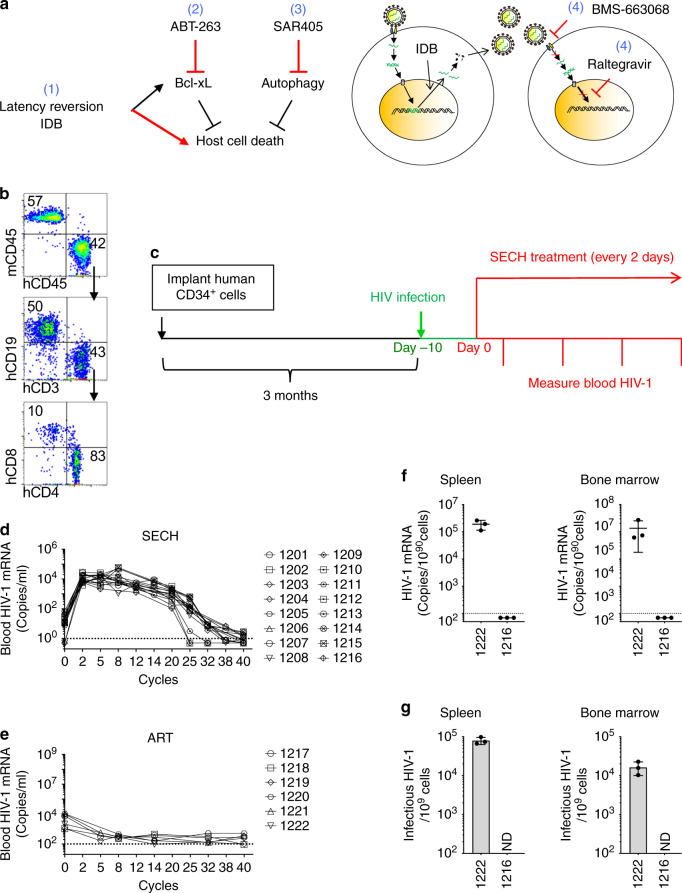
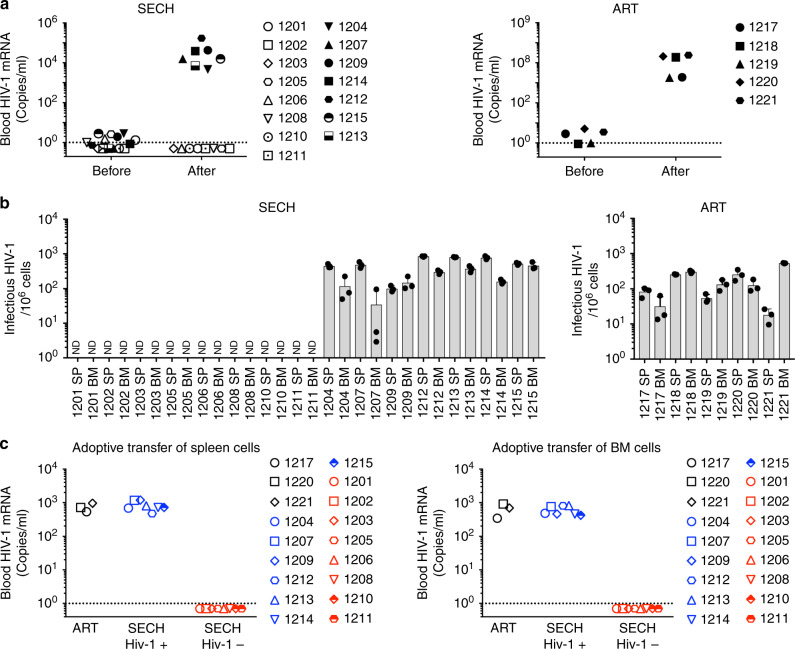
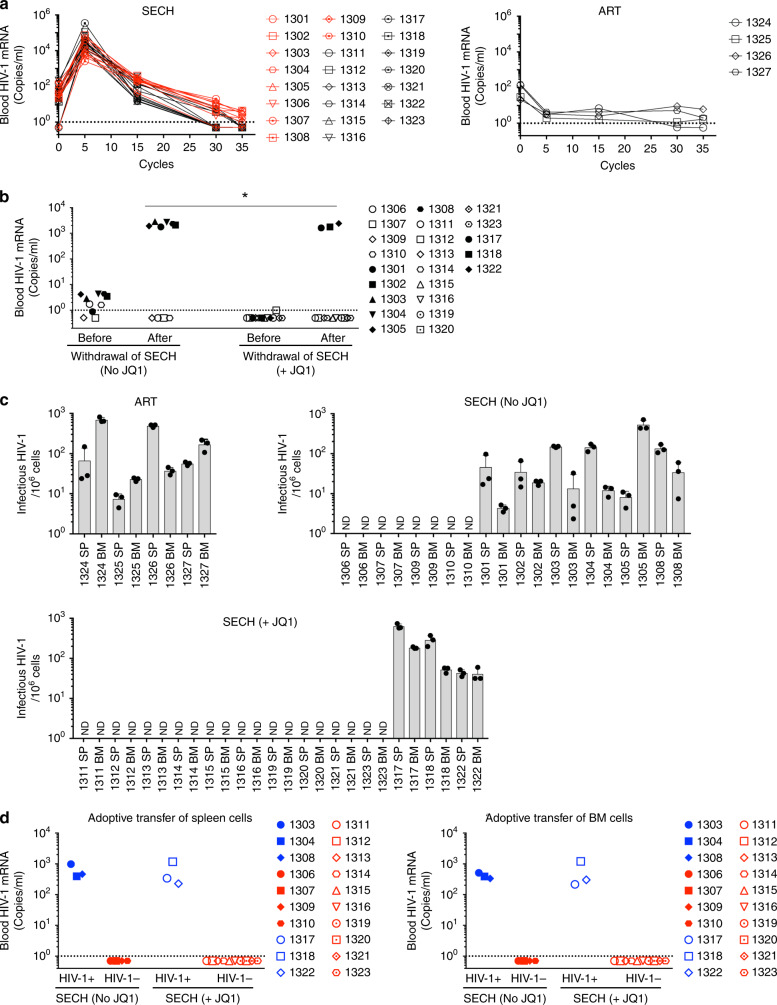
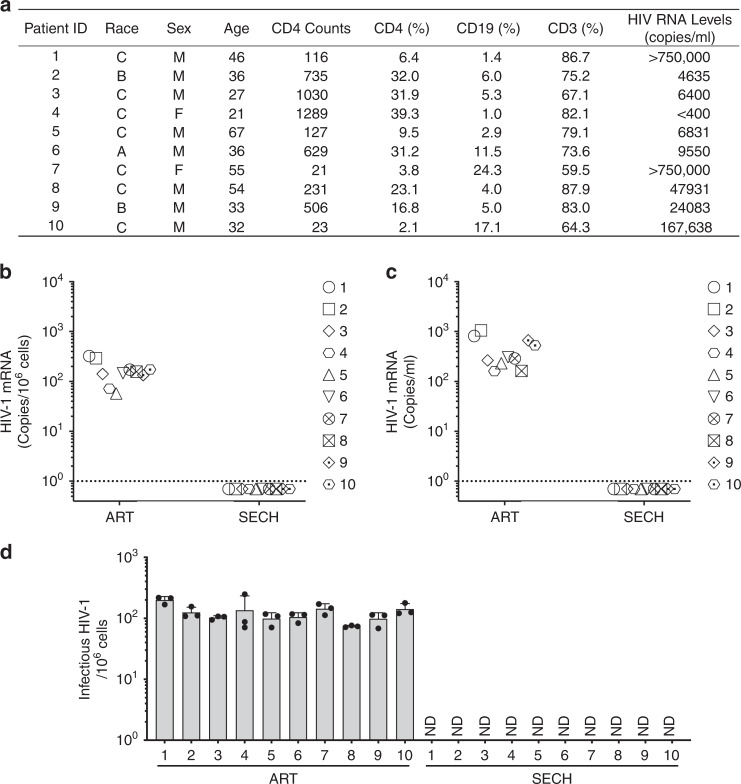
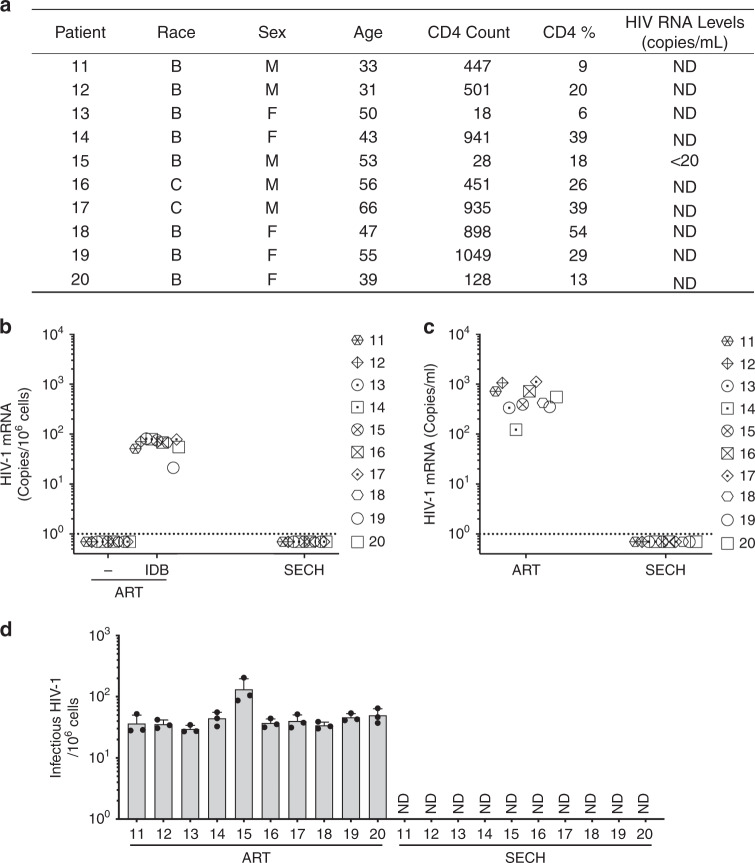
The RNA genome of the human immunodeficiency virus (HIV) is reverse-transcribed into DNA and integrated into the host genome, resulting in latent infections that are difficult to clear. Here we show an approach to eradicate HIV infections by selective elimination of host cells harboring replication-competent HIV (SECH), which includes viral reactivation, induction of cell death, inhibition of autophagy and the blocking of new infections. Viral reactivation triggers cell death specifically in HIV-1-infected T cells, which is promoted by agents that induce apoptosis and inhibit autophagy. SECH treatments can clear HIV-1 in >50% mice reconstituted with a human immune system, as demonstrated by the lack of viral rebound after withdrawal of treatments, and by adoptive transfer of treated lymphocytes into uninfected humanized mice. Moreover, SECH clears HIV-1 in blood samples from HIV-1-infected patients. Our results suggest a strategy to eradicate HIV infections by selectively eliminating host cells capable of producing HIV.


Conflict of interest statement

The authors declare no competing interests.

Figures

Fig. 1
Fig. 1. Regulation of host cell survival, but not HIV-1 reverse transcription and integration into the host genome by inhibition of autophagy.
a CMT transfected with Atg7 siRNA were infected with HIV-1 (NL4-3, 0.1 MOI) and cultured for 4 d to establish latency. After latency reversal by PHA, p24+ cells (n = 3 biologically independent samples) and Atg7 expression (representative of two biologically independent experiments) were determined. *p = 0.011. b CMT latently infected with HIV-1 were stimulated with IDB with SAR405 (2 μm) or CQ (10 μm). p24 staining and the number of LC3 punctate per cells were analyzed. p24+ cells (n = 3 biologically independent experiments), p = 0.010 (SAR405) and 0.0098 (CQ); LC3 punctate/cell (n = 30 cells from two biologically independent experiments), p = 0.0001 (no virus) and 0.0001 (HIV-1). c, d Atg7 siRNA-transfected CMT were infected with HIV-1. Alternatively, CMT infected with HIV-1 were cultured with SAR405. Cells at different time after infection were collected (n = 3 biologically independent samples) for RT-PCR for R/U5c and LTR-gagd. eAlu-gag PCR for genomic DNA from CMT as in a, CMT treated with SAR405 as in b or uninfected CMT. Data were normalized against β-globin. ND: not detectable. Data are presented as mean ± SD (n = 3 biologically independent samples). f, g CMT cultured as in a, b were reactivated with PHA for 24 h f (n = 3 biologically independent samples). PBMCs from ART-treated HIV-1-infected patients (n = 5 patients) were stimulated with IDB in the presence or absence of SAR405 for 24 h g. HIV-1 mRNA was determined by RT-PCR. Data are presented as mean ± SD. The dashed line indicates detection limit. h, i CMT latently infected with HIV-1 (NL4-3, 1 MOI) as in a were reactivated with 100 nm IDB for 24 h. Annexin V h or DEVD i staining were analyzed by flow cytometry (n = 3 biologically independent samples). SAR405 vs. control, p = 0.0012 h, 0.0024 i; CQ vs. control, p = 0.0164 h, 0.0088 i. Source data are provided as a Source Data file.
Fig. 2
Fig. 2. Induction of caspase activation and cell death in HIV-1-infected T cells.
a CD4+ T cells from PBMCs with or without infection by HIV-1 (NL4-3, 1 MOI) were cultured for 4 days to establish latency, followed by stimulation with IDB for 24 h. Cell lysates were used for western blot (representative of two biologically independent experiments). Arrows indicate cleaved caspases. b CMT with or without infection by HIV-1 (NL4-3, 1 MOI) were cultured for 4 days to establish latency. The cells were stimulated with 0.1 μm IDB. ABT-263 (0.2 μm) and SAR405 (2 μm) and chloroquine (CQ, 10 μm) were added as indicated. The cells were cultured for 48 h, followed by incubation with DEVD-FITC, staining with APC-Annexin V, and intracellular staining with PE-anti-HIV p24. c Total cell death for cells treated in b was calculated (n = 3 biologically independent samples). Data are presented as mean ± SD. p values for control vs. five treatment groups in sequence: 0.0001, 0.0011, 0.0002, 0.0049, and 0.0001 (one-way ANOVA with unpaired two-tailed t test). d The combinations of ABT-263 and SAR405 or CQ in the killing of IDB-stimulated HIV-1-infected T cells in b was calculated. The remaining viable HIV-1 p24+ cells (negative for staining by APC-annexin V and DEVD-FITC) in b were also calculated. Data are presented as mean ± SD (n = 3 biologically independent samples). p values for control vs. four treatment groups in sequence (for killing of p24+ cells and for p24+ cells remaining): 0.0001, 0.0006, 0.0001, 0.0011, and 0.0001 (one-way ANOVA with unpaired two-tailed t test). e T cells latently infected with HIV-1 as in Fig. 1a were mixed with CellTrace violet-labeled uninfected T cells, and cultured with IDB, SAR405, and ABT-263 as in b, in the presence of 0.2 μm BMS-626529 for 48 h. The cells were stained with DEVD-FITC and APC-Annexin V, followed by flow cytometry analysis. Data are presented as mean ± SD and are representative of five independent experiments. p values for control vs. four treatment groups (HIV-1-infected samples) in sequence: 0.0059, 0.0005, 0.0004, and 0.0001 (one-way ANOVA with unpaired two-tailed t test). Source data are provided as a Source Data file.
Fig. 3
Fig. 3. Treatment of HIV-1 infections in Hu-HSC mice by SECH.
a The SECH regimen includes: (1) latency reversion; (2) induction of cell death; (3) inhibition of autophagy; and (4) blocking of new infections with inhibitors for HIV-1 attachment and integration. b An example of flow cytometry analyses of human cells in the peripheral blood of NSG-SGM3 mice 3 months after reconstitution with human CD34+ stem cells. Cell negative for mouse CD45 (mCD45) and positive for human CD45 (hCD45) were gated to analyze CD19+ human B cells, CD3+CD4+, and CD3+CD8+ human T cells. c Three months after reconstitution with human CD34+ stem cells, one set of HIV-1-infected Hu-HSC mice (Supplementary Table 1) were infected with HIV-1 (AD8 strain, 1000 pfu/mouse) intraperitoneally. Ten days after HIV-1 infections, the mice were used for treatments by ART or SECH. d, e RNA from the whole blood (including plasma and cells) was extracted to measure HIV-1 mRNA in mice treated by SECH e or ART f for 40 cycles. The dash line indicates detection limit. f HIV-1 mRNA in the spleen and bone marrow of mice treated by SECH or ART was determined by RT-PCR. Data are presented as mean ± SD (n = 3 technical replicates). ND, not detectable. g Infectious HIV-1 in the spleen and bone marrow of mice treated by SECH or ART was measured by TZA assays. Data are presented as mean ± SD (n = 3 technical replicates). Source data are provided as a Source Data file.
Fig. 4
Fig. 4. Clearance of HIV-1 infections in Hu-HSC mice by SECH.
a HIV-1 viral RNA levels in the blood of SECH- or ART-treated Hu-HSC mice before and after 2 months of withdrawal of the treatments (ART, n = 5; SECH, n = 15). The dash line indicates detection limit. b Measuring infectious HIV-1 from spleen and bone marrow (BM) cells of HIV-1-infected Hu-HSC mice by TZA. Data are presented as mean ± SD (ART, n = 5 mice; SECH, n = 15 mice). Data are presented as mean ± SD. Each biological sample was measured in three technical replicates. ND, not detectable. c Virus outgrowth assay after adoptive transfer of spleen and BM cells from mice as in c into uninfected Hu-HSC recipient mice. (ART, n = 3 mice; SECH, n = 15 mice). Source data are provided as a Source Data file.
Fig. 5
Fig. 5. Improvement of SECH treatment by inclusion of JQ1.
a Viral RNA levels in one set of HIV-1-infected Hu-HSC mice (Supplementary Table 3) orally treated by SECH with (black symbols) or without JQ1 (red symbols) for a total of 35 cycles (ART, n = 5 mice; SECH, n = 10 mice; SECH + JQ1, n = 13 mice). The dash line indicates detection limit. b Viral titer in the blood before and after withdrawal of the treatments. (SECH, n = 10 mice; SECH + JQ1, n = 13 mice). No JQ1 vs. JQ1, p = 0.0407 (Mann–Whitney test). c Measuring infectious HIV-1 from spleen and bone marrow cells of HIV-1-infected Hu-HSC mice by TZA. Biological samples from each mouse were measured in three technical replicates. Data are presented as mean ± SD (ART, n = 5 mice; SECH, n = 10 mice; SECH + JQ1, n = 13 mice). ND, not detectable. d hmVOA for spleen and bone marrow cells from mice in c (SECH, n = 7 mice; SECH + JQ1, n = 13 mice). Source data are provided as a Source Data file.
Fig. 6
Fig. 6. Clearance of HIV-1-infected cells from ART-naive HIV-1 patients by SECH treatments in vitro.
a CD4 counts and HIV-1 load in ART-naive HIV-1-infected patients (n = 10) without previous antiretroviral treatment. A, Asian; B, Black; C, Caucasian. b PBMCs obtained from ART-naive HIV-1 patients (n = 10) were culture in vitro with agents for SECH or ART only for 2 days as on cycle, with a total of seven cycles as described in the “Method” section. Samples were also re-stimulated with IDB for detection of HIV-1 mRNA by RT-PCR. The dash line indicates detection limit. c PBMCs treated by in b were depleted of CD8+ T cells and 3 × 106 cells were adoptively transferred into uninfected Hu-HSC mice for detection of HIV-1 by hmVOA. d The cells treated in b were used for TZA analyses. Ten biological samples were each measured in three technical replicates and presented as mean ± SD. Source data are provided as a Source Data file.
Fig. 7
Fig. 7. Clearance of HIV-1-infected cells from ART-experienced HIV-1 patients by SECH treatments in vitro.
a CD4 counts and HIV-1 load in ART-experienced HIV-1-infected patients (n = 10). HIV viremia was successfully suppressed in all patients at the time of blood collection. Patients 18 and 19 had undergone ART treatments for 139 and 95 days, respectively. bd PBMCs from ART-experienced HIV-1 patients (n = 10) were treated with SECH or ART and then used for detection of HIV-1 mRNA by RT-PCR b hmVOA c and TZA analyses d as in Fig. 6. Ten biological samples were each measured in three technical replicates and presented as mean ± SD d. Source data are provided as a Source Data file.

References

    1. Barre-Sinoussi F, et al. Isolation of a T-lymphotropic retrovirus from a patient at risk for acquired immune deficiency syndrome (AIDS) Science. 1983;220:868–871. - PubMed
    1. Deeks SG, et al. J. International AIDS Society global scientific strategy: towards an HIV cure 2016. Nat. Med. 2016;22:839–850. - PMC - PubMed
    1. Simon V, Ho DD. HIV-1 dynamics in vivo: implications for therapy. Nat. Rev. Microbiol. 2003;1:181–190. - PubMed
    1. Abrahams MR, et al. The replication-competent HIV-1 latent reservoir is primarily established near the time of therapy initiation. Sci. Transl. Med. 2019;11:eaaw5589. - PMC - PubMed
    1. Whitney JB, et al. Rapid seeding of the viral reservoir prior to SIV viraemia in rhesus monkeys. Nature. 2014;512:74–77. - PMC - PubMed

Publication types