. 2020 Aug 13;11(1):4049.
doi: 10.1038/s41467-020-17922-x.

Face mask use in the general population and optimal resource allocation during the COVID-19 pandemic

Affiliations

Face mask use in the general population and optimal resource allocation during the COVID-19 pandemic

Colin J Worby et al. Nat Commun. .

Abstract

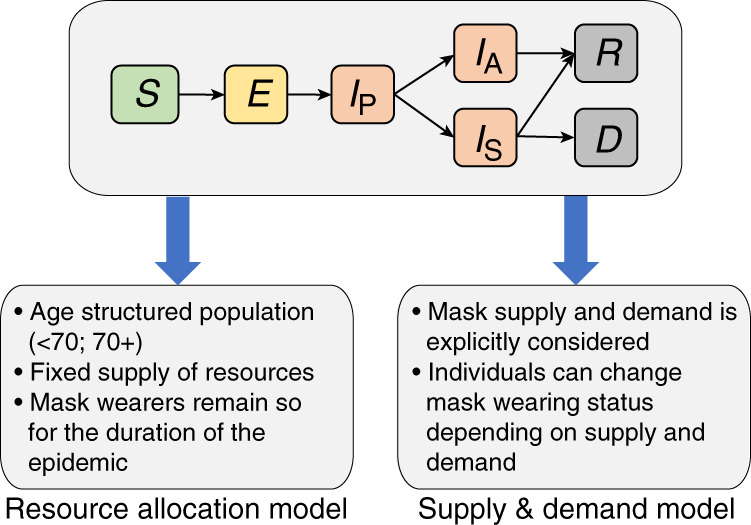
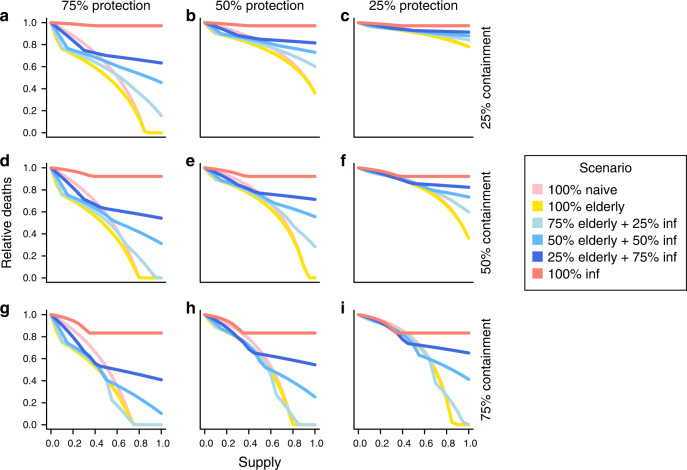
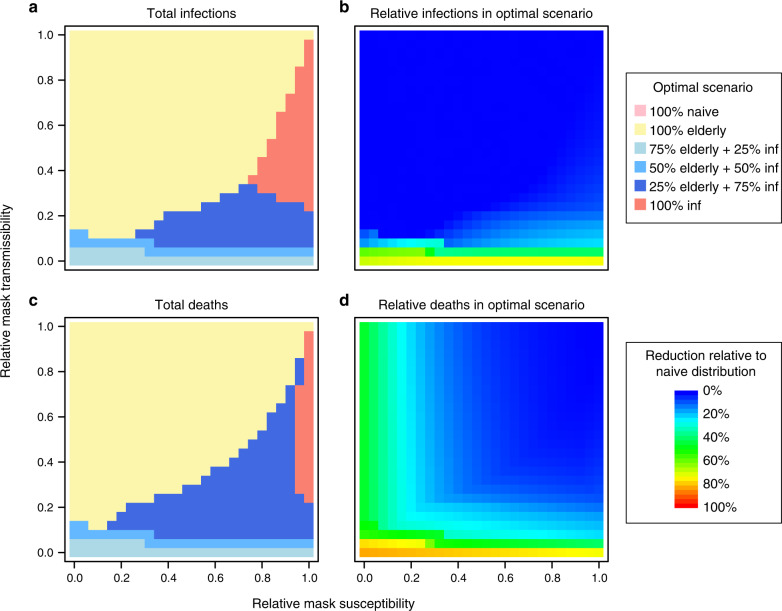
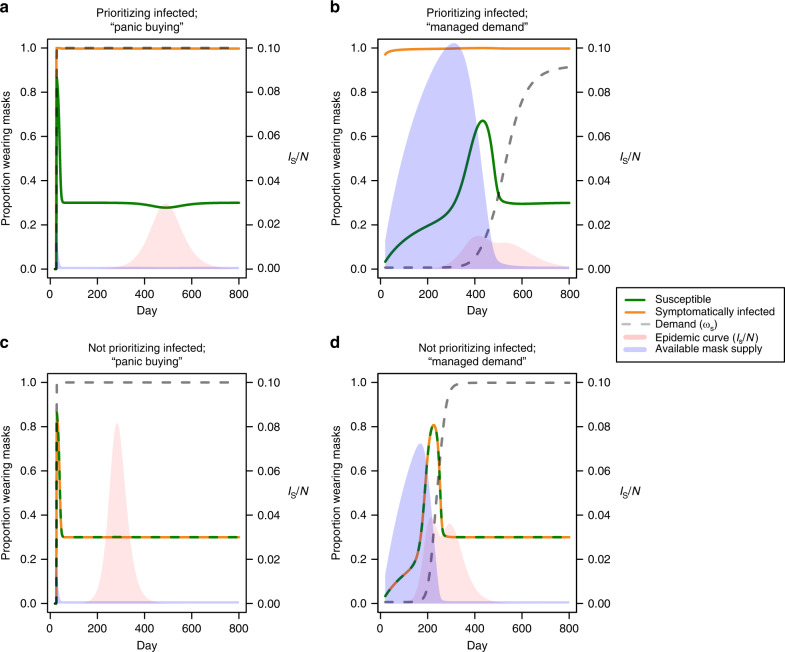
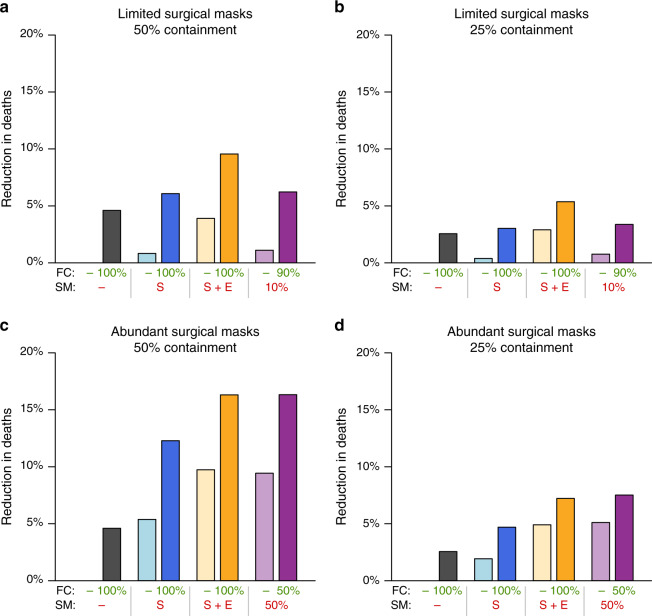
The ongoing novel coronavirus disease (COVID-19) pandemic has already infected millions worldwide and, with no vaccine available, interventions to mitigate transmission are urgently needed. While there is broad agreement that travel restrictions and social distancing are beneficial in limiting spread, recommendations around face mask use are inconsistent. Here, we use mathematical modeling to examine the epidemiological impact of face masks, considering resource limitations and a range of supply and demand dynamics. Even with a limited protective effect, face masks can reduce total infections and deaths, and can delay the peak time of the epidemic. However, random distribution of masks is generally suboptimal; prioritized coverage of the elderly improves outcomes, while retaining resources for detected cases provides further mitigation under a range of scenarios. Face mask use, particularly for a pathogen with relatively common asymptomatic carriage, is an effective intervention strategy, while optimized distribution is important when resources are limited.


Conflict of interest statement

The authors declare no competing interests.

Figures

Fig. 1
Fig. 1. The compartmental structure common to both models.
Susceptible hosts (S) become exposed (E) and progress to presymptomatic infectious (IP). Infected hosts can become either asymptomatic or mildly symptomatic (IA), or symptomatic (IS). Recovery (R) or death (D) follow. The resource allocation model and the supply & demand model then have unique additional features and dynamics. A schematic of the supply & demand compartmental model is shown in Supplementary Fig. 11. For a full description of each model and the specification of dynamics between compartments, see the Supplementary Methods.
Fig. 2
Fig. 2. Reduction in total deaths under each distribution strategy for a range of mask availability levels.
Each panel represents mask effectiveness in terms of relative protection and containment. Containment levels of 25% ac, 50% df, and 75% gi are shown with varying protection levels; c represents the least effective mask and g represents the most effective mask. Masks are provided naively (pink), prioritized to the elderly (yellow), saved for detected cases (red), or balanced at different levels between healthy individuals, prioritizing the elderly, and detected cases (blue). Inflection points occur at the point where supplies are exhausted, and the outbreak continues with no new individuals adopting masks. Here, 30% of infections are assumed to be undetected. See “Methods” for further details.
Fig. 3
Fig. 3. Optimal distribution of resources for different levels of mask effectiveness.
a The strategy which minimized the number of infections is indicated for each level of intervention protection and containment. With a supply of masks for 40% of the population, resources are provided under each of the strategies described in “Methods”. b The reduction in infections under the optimal strategy is shown relative to the numbers under the naive strategy. Here we assume 30% of cases to be undetected. c and d show the equivalent plots for total deaths.
Fig. 4
Fig. 4. Early demand management can limit the total number of infections.
While prioritizing masks for infectious cases, epidemic curves (pink) and mask supply (blue) are shown in a a “panic buying” demand curve and b a more gradual “managed demand” curve. Demand is shown as a dashed gray line, while the proportion of the susceptible and symptomatically infected population wearing masks are shown as green and orange lines, respectively. (k1, k2) are (1, 100) and (10−6, 5 × 106) for “panic buying” and managed demand, respectively (see “Methods”). The dynamics shown here are based on mask production rate, B/N, equal to 30%. Equivalent plots are provided showing dynamics when infectious cases are not prioritized under c “panic buying” and d “managed demand” scenarios.
Fig. 5
Fig. 5. Universal face covering combined with targeted surgical mask deployment reduces total deaths.
Eight face mask policies were compared under scenarios where surgical mask (SM) supplies were limited to cover 10% a, b or 50% c, d of the population, and where surgical mask containment was high (50%, a, c) or low (25%, b, d). Available surgical masks were either not used (gray), provided to symptomatic persons (S; blue), provided to elderly and symptomatic persons (S + E; orange), or distributed randomly to the susceptible population (purple). These policies are compared with and without universal face coverings (FC) for the remaining population (darker and lighter colors, respectively). Surgical masks are assumed to confer 25% protection in all settings, and are three times more effective than face coverings.

Update of

References

    1. Sohrabi C, et al. World Health Organization declares global emergency: a review of the 2019 novel coronavirus (COVID-19) Int J. Surg. 2020;76:71–76. doi: 10.1016/j.ijsu.2020.02.034. - DOI - PMC - PubMed
    1. Johns Hopkins University. Johns Hopkins CSSE Covid-19 Dashboard. (Baltimore, MD 2020). https://coronavirus.jhu.edu/map.html.
    1. Qiu, J. Covert coronavirus infections could be seeding new outbreaks. Nature, 10.1038/d41586-020-00822-x (2020). - PubMed
    1. Bai Y, et al. Presumed asymptomatic carrier transmission of COVID-19. JAMA. 2020;323:1406–1407. doi: 10.1001/jama.2020.2565. - DOI - PMC - PubMed
    1. Novel Coronavirus Pneumonia Emergency Response Epidemiology, T. [The epidemiological characteristics of an outbreak of 2019 novel coronavirus diseases (COVID-19) in China]. Zhonghua Liu Xing Bing Xue Za Zhi41, 145–151 (2020). - PubMed

Publication types

MeSH terms