. 2020 Aug 13;10(1):13699.
doi: 10.1038/s41598-020-70674-y.

Nanoscale light element identification using machine learning aided STEM-EDS

Affiliations

Nanoscale light element identification using machine learning aided STEM-EDS

Hong-Kyu Kim et al. Sci Rep. .

Abstract

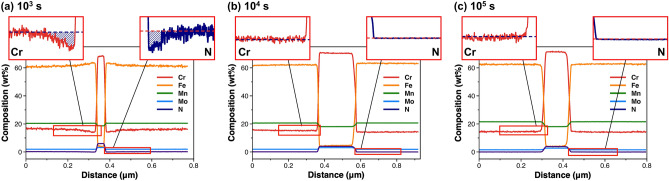
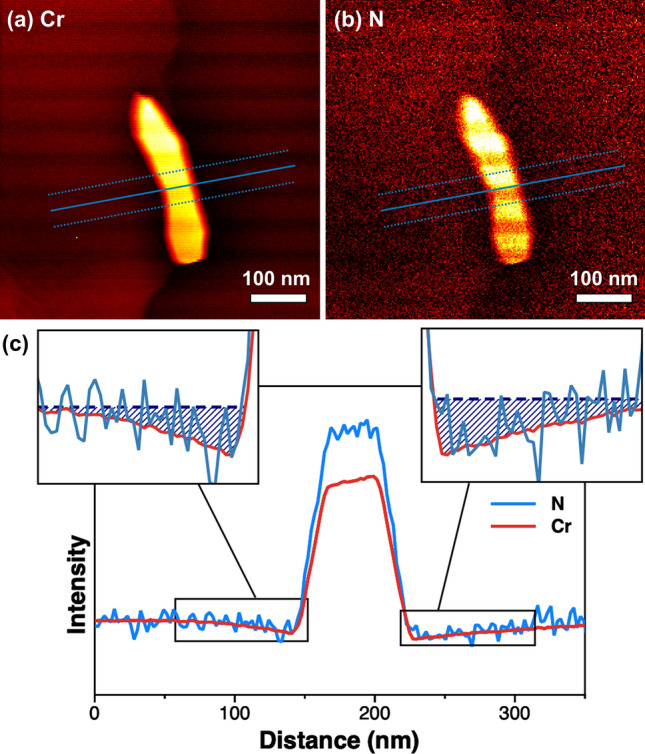
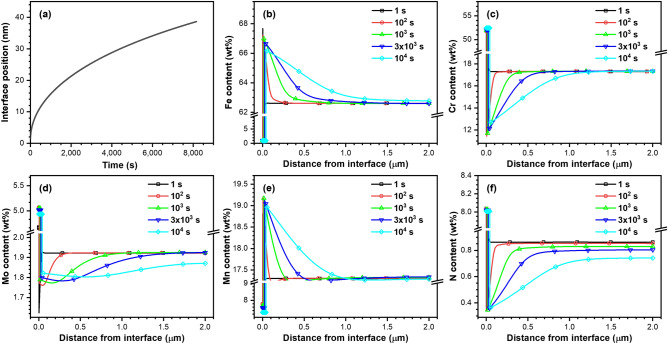
Light element identification is necessary in materials research to obtain detailed insight into various material properties. However, reported techniques, such as scanning transmission electron microscopy (STEM)-energy dispersive X-ray spectroscopy (EDS) have inadequate detection limits, which impairs identification. In this study, we achieved light element identification with nanoscale spatial resolution in a multi-component metal alloy through unsupervised machine learning algorithms of singular value decomposition (SVD) and independent component analysis (ICA). Improvement of the signal-to-noise ratio (SNR) in the STEM-EDS spectrum images was achieved by combining SVD and ICA, leading to the identification of a nanoscale N-depleted region that was not observed in as-measured STEM-EDS. Additionally, the formation of the nanoscale N-depleted region was validated using STEM-electron energy loss spectroscopy and multicomponent diffusional transformation simulation. The enhancement of SNR in STEM-EDS spectrum images by machine learning algorithms can provide an efficient, economical chemical analysis method to identify light elements at the nanoscale.


Conflict of interest statement

The authors declare no competing interests.

Figures

Figure 1
Figure 1
Scanning electron microscopy (SEM) images (top) and higher magnified images (bottom) of yellow box marked in each SEM image of P900NMo alloy specimens showing morphologies of Cr2N precipitates grown by aging at 900 °C in high-nitrogen stainless steel (HNS) for different aging times: (a) 103 s, (b) 104 s, and (d) 105 s.
Figure 2
Figure 2
High-angle annular dark-field imaging (HAADF)-scanning transmission electron microscopy (STEM) and energy dispersive X-ray spectroscopy (EDS) elemental mapping images of the Cr2N precipitate in the specimen aged at 900 °C for 103 s: (a) HAADF-STEM image, (b) Cr EDS map, (c) N EDS map, (d) Fe EDS map, (e) Mn EDS map, and (f) Mo EDS map.
Figure 3
Figure 3
High-angle annular dark-field imaging (HAADF)-scanning transmission electron microscopy (STEM) micrographs of Cr2N precipitates (top) and composition line profiles for Cr, Fe, Mn, Mo, and N (bottom) along the red lines marked in the HAADF-STEM images of specimens aged at 900 °C for different aging times: (a) 103 s, (b) 104 s, and (c) 105 s. The composition line profiles of Cr and N are magnified and displayed as insets, showing whether the depletion region of Cr and N is observed.
Figure 4
Figure 4
Images with enhanced resolution due to reduced noise signals. Energy dispersive X-ray spectroscopy (EDS) mapping images reconstructed using only a few principal components of the samples aged at 900 °C for different aging times: (a) 103 s, (b) 104 s, and (c) 105 s.
Figure 5
Figure 5
Energy dispersive X-ray spectroscopy (EDS) line profiles of each element for the samples aged at 900 °C for different aging times: (a) 103 s, (b) 104 s, and (c) 105 s. The composition of each element is profiled along the same red lines marked in the high-angle annular dark-field imaging (HAADF)-scanning transmission electron microscopy (STEM) images in Fig. 3.
Figure 6
Figure 6
Electron energy loss spectroscopy (EELS) elemental maps of (a) Cr and (b) N constituting the Cr2N precipitate, and (c) their line profiles. The line profiles are obtained along the blue lines indicated in the EELS mapping images, and regions in black boxes are magnified as insets. The line profile of N was multiplied by an appropriate value to allow comparison with that of Cr.
Figure 7
Figure 7
Results of a multicomponent diffusional transformation simulation showing Cr2N precipitate growth. (a) Precipitate size as a function of temperature, and alloying element contents profile for (b) Fe, (c) Cr, (d) Mo, (e) Mn, and (f) N.

References

    1. Foct J. Unexplored possibilities of nitrogen alloying of steel. In: Weng Y, Dong H, Gan Y, editors. Advanced Steels. Berlin: Springer; 2011. pp. 363–366.
    1. Simmons JW. Overview: high-nitrogen alloying of stainless steels. Mater. Sci. Eng. 1996;207:159–169.
    1. Mudali UK. Nitrogen—a boon to the metals industry. Mater. Manuf. Process. 2004;19:1–5.
    1. Talha M, Behera CK, Sinha OP. A review on nickel-free nitrogen containing austenitic stainless steels for biomedical applications. Mater. Sci. Eng. C. 2013;33:3563–3575. - PubMed
    1. Metikoš-Huković M, Babić R, Grubač Z, Petrović Ž, Lajçi N. High corrosion resistance of austenitic stainless steel alloyed with nitrogen in an acid solution. Corros. Sci. 2011;53:2176–2183.