. 2020 Aug 13;10(1):13748.
doi: 10.1038/s41598-020-69869-0.

Setting a baseline for global urban virome surveillance in sewage

Collaborators, Affiliations

Setting a baseline for global urban virome surveillance in sewage

David F Nieuwenhuijse et al. Sci Rep. .

Erratum in

Abstract

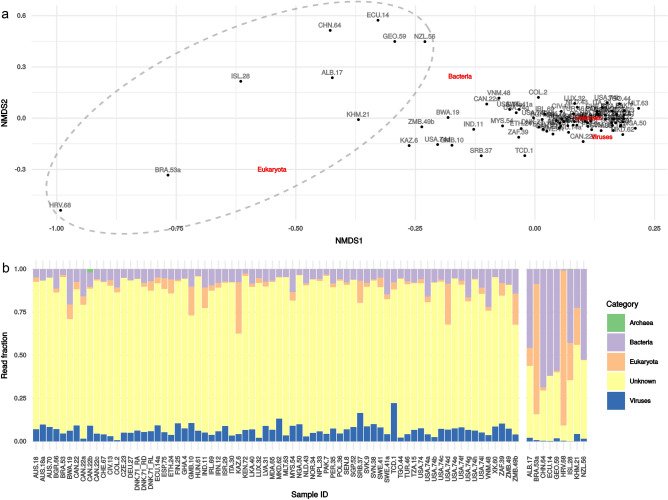
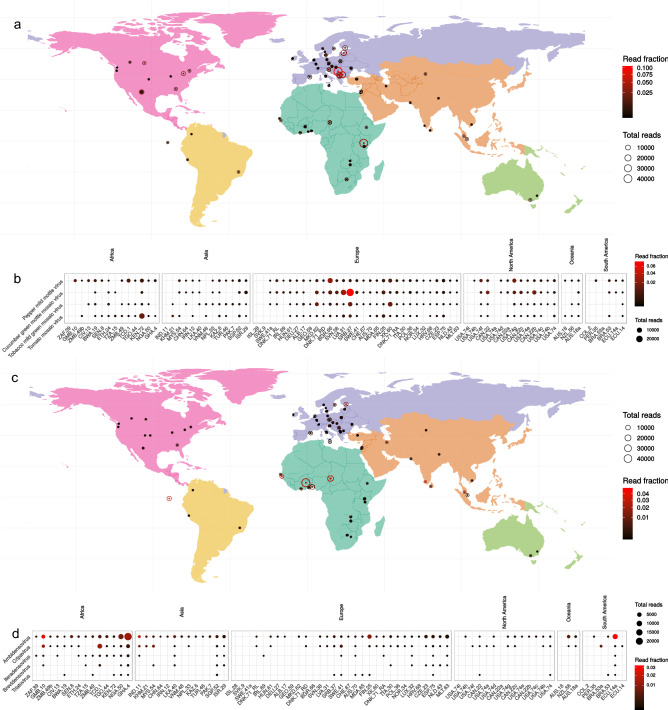
The rapid development of megacities, and their growing connectedness across the world is becoming a distinct driver for emerging disease outbreaks. Early detection of unusual disease emergence and spread should therefore include such cities as part of risk-based surveillance. A catch-all metagenomic sequencing approach of urban sewage could potentially provide an unbiased insight into the dynamics of viral pathogens circulating in a community irrespective of access to care, a potential which already has been proven for the surveillance of poliovirus. Here, we present a detailed characterization of sewage viromes from a snapshot of 81 high density urban areas across the globe, including in-depth assessment of potential biases, as a proof of concept for catch-all viral pathogen surveillance. We show the ability to detect a wide range of viruses and geographical and seasonal differences for specific viral groups. Our findings offer a cross-sectional baseline for further research in viral surveillance from urban sewage samples and place previous studies in a global perspective.


Conflict of interest statement

The authors declare no competing interests.

Figures

Figure 1
Figure 1
Effect of read preprocessing on data interpretation. (a) Number of reads before preprocessing (blue bars) after quality control (red bars) and read dereplication (green bars). The x axis shows sample identifiers ordered by number of dereplicated reads. (b, c) Effect of number of PCR replication cycles on library concentration (color), species diversity (b) and read replication rate (c). (d, e) Fold replication of raw reads by species level annotation (points). X axis separates superkingdom or “Unknown” annotations. (d) shows sample LVA_31 with a high replication rate and panel e shows sample MLT_63 with a low replication rate.
Figure 2
Figure 2
Effect of non-viral background read abundances on viral read abundance and the chosen outlier samples in the sewage metagenome data. (a) A multidimensional scaling of Bray–Curtis dissimilarity between samples based on the normalized read counts of bacterial, archaeal, eukaryote (human), and viral content. “Unknown” indicates reads that could not be assigned any annotation. The red labels indicate the effect of the different annotations on the position of a sample in the plot. Gray circle indicates the samples that were manually assigned to be outliers. (b) A scaled bar chart of relative read abundance showing the outliers in a separate facet to the right.
Figure 3
Figure 3
Heatmap of the viral diversity at viral family level (when available) and non-viral fraction. The read abundance after quality control and dereplication is shown ordered by total read abundance after preprocessing and facetted by continent. The heatmap follows the same ordering. Color gradient represents log-transformed relative abundance of reads belonging to the taxonomic groups indicated. The top four rows of the heatmap show read abundances of non-viral annotations, the other rows show read abundance by viral family, or “no family” if only genus or species level annotation was available. Vertical facets represent subdivision of the viral families based on their inferred host. Black arrows indicate outlier samples based on an overabundance of background sequences.
Figure 4
Figure 4
Overview of the global distribution and abundance of plant viruses and insect viruses in urban sewage (a) Global distribution of all plant viruses (b) The four most abundant plant virus species and their global spread. (c) Global distribution of all insect related viruses. (d) Top 5 most abundant insect virus genera. Datapoints represent absolute read numbers and read fraction by varying size and color respectively. Viral species are ordered by summed read abundance across samples and samples are ordered by total read abundance from left to right. Facets represent continent of sample origin.
Figure 5
Figure 5
Overview of the most abundant vertebrate viruses and specific human viruses and their distribution worldwide in urban sewage. (a) Distribution of the top ten most abundant vertebrate viral families. (b) Relative abundance of viruses encountered in clinical surveillance (c) World maps showing distribution of viruses encountered in clinical surveillance. Coloring of the maps delineates differences in climate by geographical location. Datapoints represent absolute read numbers and read fraction by varying size and color respectively. Viral families are ordered by summed read abundance across samples and samples are ordered by total read abundance from left to right. Facets represent continent of sample origin.

References

    1. Gomes MFC, et al. Assessing the international spreading risk associated with the 2014 west african ebola outbreak. PLoS Curr. 2014;6:1. - PMC - PubMed
    1. Koopmans M, et al. Familiar barriers still unresolved—a perspective on the Zika virus outbreak research response. Lancet Infect. Dis. 2019;19:e59–e62. - PubMed
    1. Thézé J, et al. Genomic epidemiology reconstructs the introduction and spread of Zika virus in Central America and Mexico. Cell Host Microbe. 2018;23:855–864.e7. - PMC - PubMed
    1. Glennon EE, Jephcott FL, Restif O, Wood JLN. Estimating undetected Ebola spillovers. PLoS Negl. Trop. Dis. 2019;13:e0007428. - PMC - PubMed
    1. Peeling RW, Murtagh M, Olliaro PL. Epidemic preparedness: Why is there a need to accelerate the development of diagnostics? Lancet Infect. Dis. 2019;19:e172–e178. - PubMed

Publication types