. 2020 Jul 22:11:1800.
doi: 10.3389/fmicb.2020.01800. eCollection 2020.

Geographic and Genomic Distribution of SARS-CoV-2 Mutations

Affiliations

Geographic and Genomic Distribution of SARS-CoV-2 Mutations

Daniele Mercatelli et al. Front Microbiol. .

Abstract

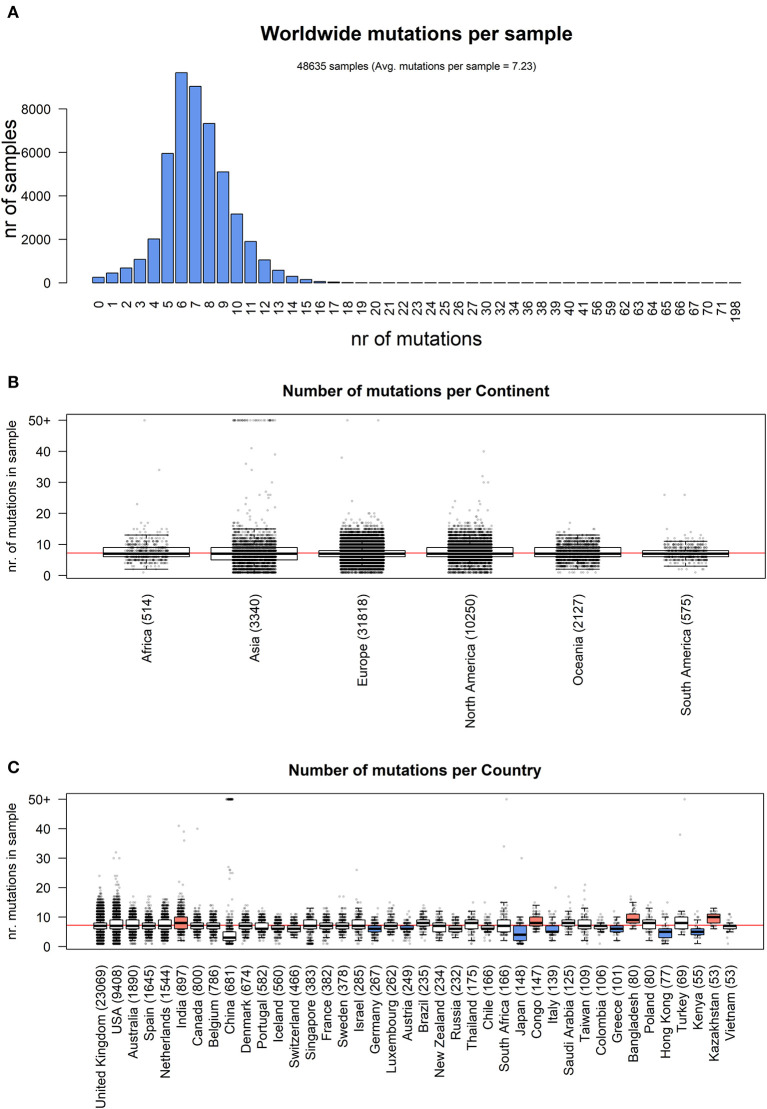
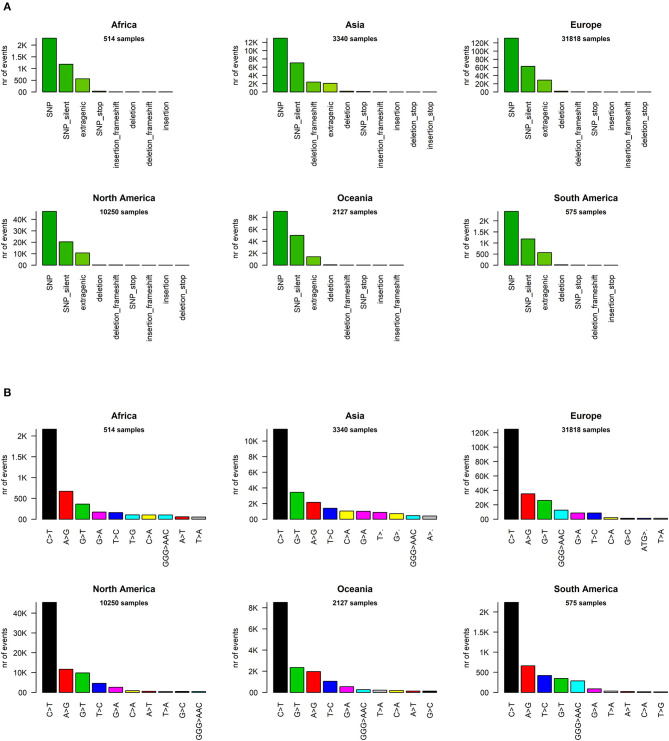
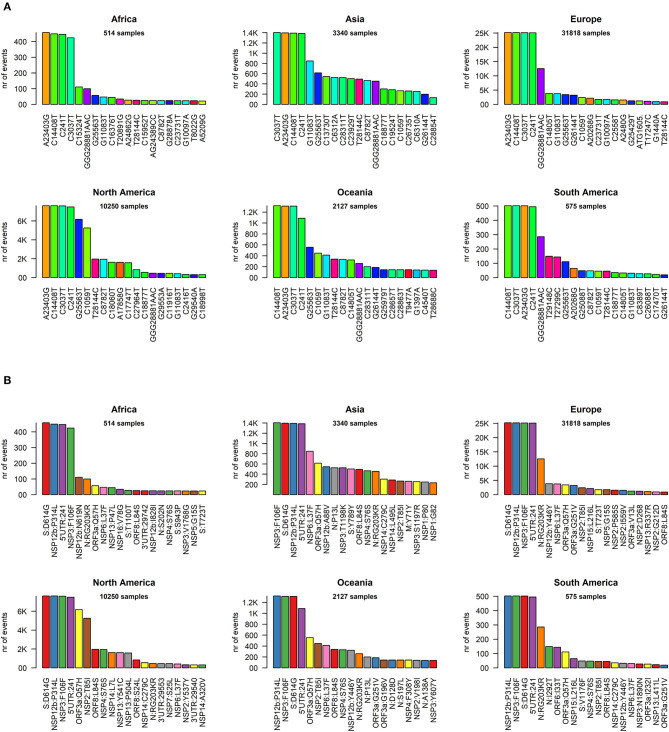
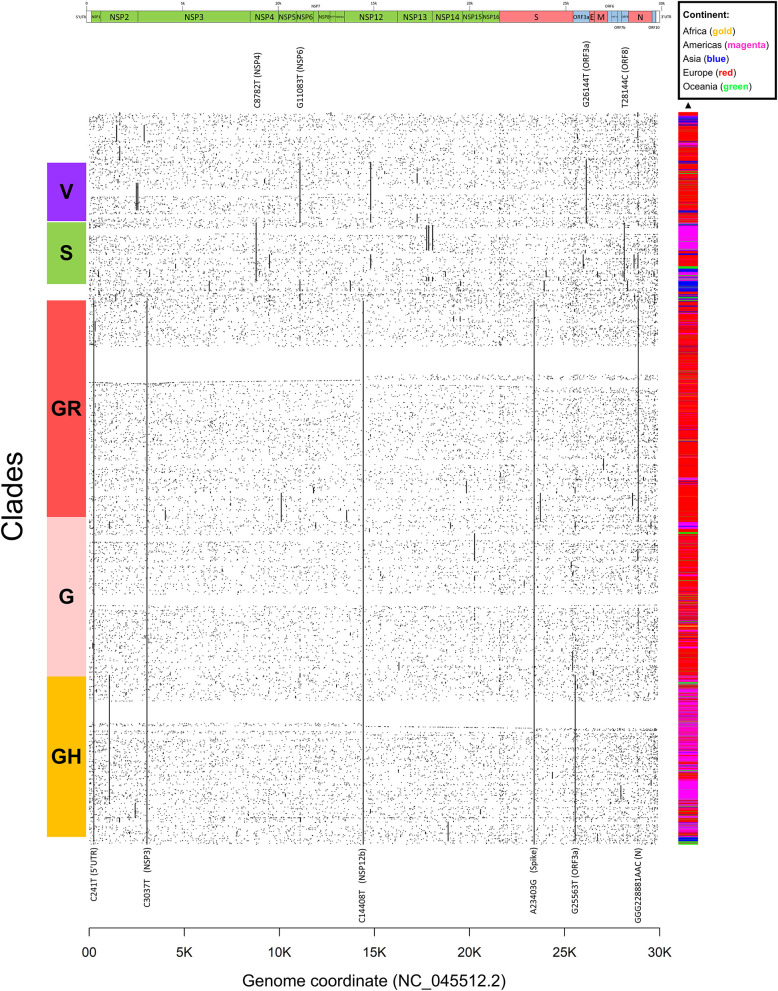
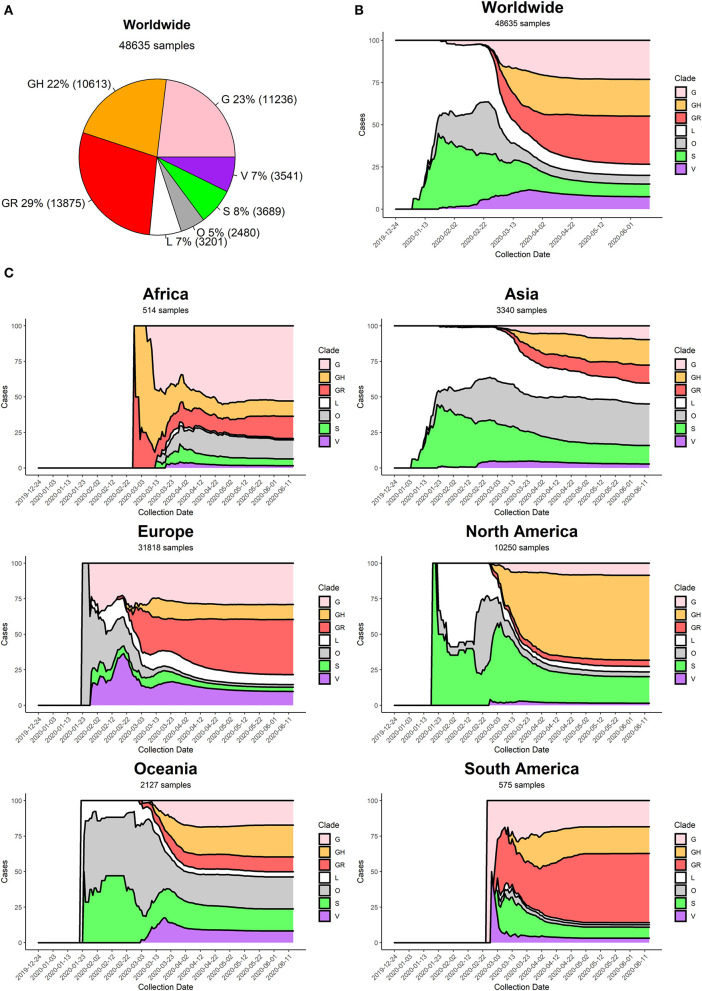
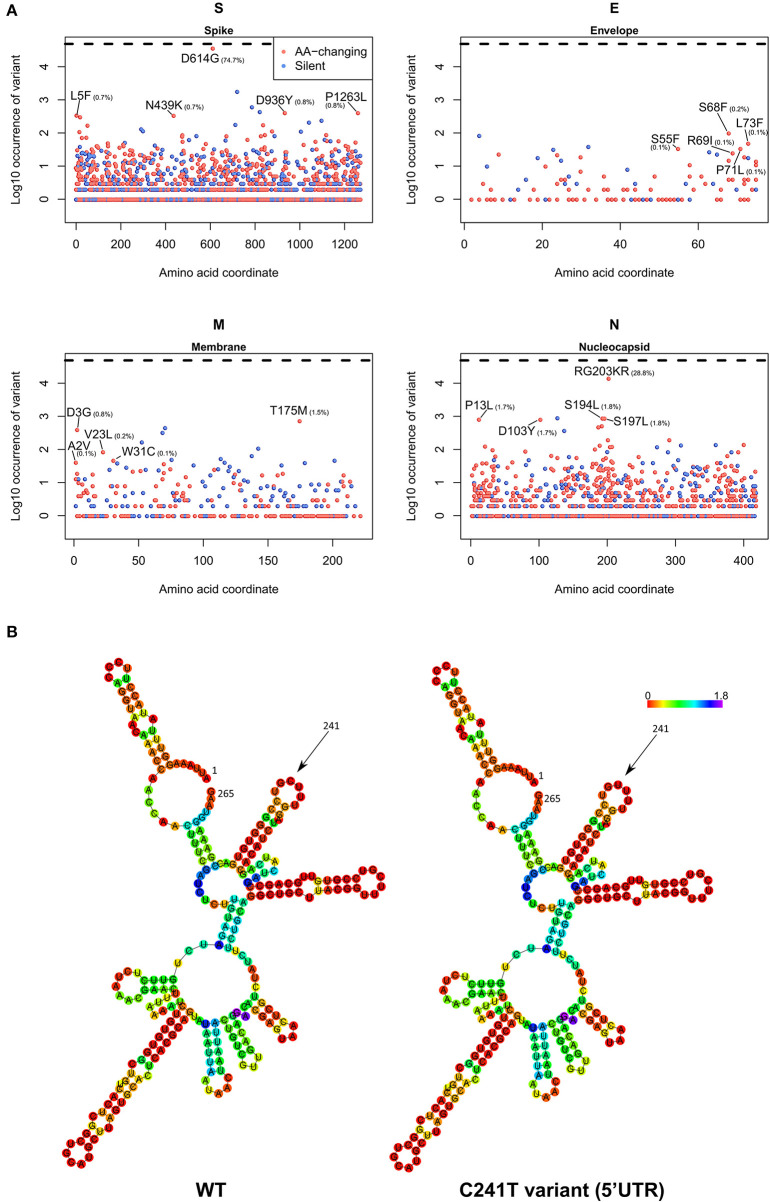
The novel respiratory disease COVID-19 has reached the status of worldwide pandemic and large efforts are currently being undertaken in molecularly characterizing the virus causing it, SARS-CoV-2. The genomic variability of SARS-CoV-2 specimens scattered across the globe can underly geographically specific etiological effects. In the present study, we gather the 48,635 SARS-CoV-2 complete genomes currently available thanks to the collection endeavor of the GISAID consortium and thousands of contributing laboratories. We analyzed and annotated all SARS-CoV-2 mutations compared with the reference Wuhan genome NC_045512.2, observing an average of 7.23 mutations per sample. Our analysis shows the prevalence of single nucleotide transitions as the major mutational type across the world. There exist at least three clades characterized by geographic and genomic specificity. In particular, clade G, prevalent in Europe, carries a D614G mutation in the Spike protein, which is responsible for the initial interaction of the virus with the host human cell. Our analysis may facilitate custom-designed antiviral strategies based on the molecular specificities of SARS-CoV-2 in different patients and geographical locations.

Keywords: COVID-19; SARS-CoV-2; coronavirus; genome evolution; genomics.


Figures

Figure 1
Figure 1
(A) Distribution of number of mutational events for all SARS-CoV-2 genome samples analyzed. (B) Distributions of number of mutations for each sample, stratified per continent. The main boxplot rectangles are drawn between the 1st and 3rd quartile, with the median value indicated as a thick line. Boxplot whiskers fall on the closest point to the 1st/3rd quartile + 1.5 interquartile range as described in the R boxplot() function. The number in brackets after the continent name indicates the number of sequenced genomes. The horizontal red line indicates the average number of mutations per sample, worldwide. (C) As in (B), with stratification performed country-wise, using the 40 countries with the highest number of sequenced genomes. The boxplot color indicates the country has a mutation rate higher (red) or lower (blue) than the world's average (Kolmogorov-Smirnov test p < 2.2 × 10⁻¹⁶ and absolute difference of averages between country and world higher than one).
Figure 2
Figure 2
(A) Distribution of SARS-CoV-2 mutation classes in continents. “SNP,” “deletion,” and “insertion” terms without further specifications are intended as frameshift-preserving aa-changing events. (B) Continent-stratified distribution of SARS-CoV-2 mutation types. Colors are assigned randomly but preserved across panels to facilitate tracking of identical types across continents. Listed nucleotide changes represent those found in the positive-sense viral RNA. We indicate the thymine T letter for consistency with the NCBI reference sequence NC_045512.2, but the actual viral sequence will be factually represented by a U (uracil) as the RNA counterpart for thymine. Dots (‘·’) on the x-axis mutation type names indicate nucleotide deletion.
Figure 3
Figure 3
(A) Continent-stratified distribution of SARS-CoV-2 most frequent specific events, annotated as nucleotide coordinates over the reference genome NC_045512.2. Colors are assigned randomly but preserved across panels to facilitate tracking of identical types across continents. (B) Continent-stratified distribution of SARS-CoV-2 most frequent specific events, annotated protein changes using the format protein:mutation. Colors are assigned randomly but preserved across panels to facilitate tracking of identical types across continents.
Figure 4
Figure 4
Dot mat showing as X-axis the 29,903 nucleotide positions (sorted from left, 5′ to right, 3′) of SARS-CoV-2, and as Y axis the 48,635 genomes analyzed in this study. The genomic sequences were clustered using simple correlation followed by the “complete” clustering algorithm. Coding sequence regions are shown at the top. To the right of the plot, we assigned a color to each sample according to the continent of origin. On the left, we manually annotated the groups according to the known GISAID clades (G, GH, GR, S, and V) and the mutations that named them. Labels of clade-defining mutations are placed on the corresponding genomic coordinate.
Figure 5
Figure 5
(A) Distribution of SARS-CoV-2 clades in the World at the time of writing (26 June 2020). (B) Stacked area chart of relative SARS-CoV-2 clade frequency (y-axis) over time (x-axis) worldwide. (C) Stacked area charts of relative SARS-CoV-2 clade frequency over time in six continents.
Figure 6
Figure 6
(A) Occurrence of mutations in the four SARS-CoV-2 structural proteins S (Spike), E (Envelope), M (Membrane), and N (Nucleocapsid). On the x-axis, the amino acid coordinate of the mutation. On the y-axis, the Log10 of the number of samples where the mutations have been observed, worldwide. The horizontal dashed line indicates the maximum (Log10 of all the 48,635 samples). In blue, silent mutations, and in red, mutations affecting the protein sequence. The frequency (in percentage) of the top 5 aa-changing mutations is also indicated. (B) Dot-bracket notation of minimum free energy prediction of the secondary structure of SARS-CoV-2 5′UTR (nt 1-265), WT (left) and C241T variant (right). Base reliability is expressed as positional entropy and colored accordingly.

References

    1. Amanat F., Krammer F. (2020). SARS-CoV- 2 vaccines: status report. Immunity. 52, 583–589. 10.1016/j.immuni.2020.03.007 - DOI - PMC - PubMed
    1. Andersen K. G., Rambaut A., Lipkin W. I., Holmes E. C., Garry R. F. (2020). The proximal origin of SARS-CoV-2. Nat. Med. 26, 450–452. 10.1038/s41591-020-0820-9 - DOI - PMC - PubMed
    1. Becerra-Flores M., Cardozo T. (2020). SARS-CoV-2 viral spike G614 mutation exhibits higher case fatality rate. Int. J. Clin. Pract. e13525. 10.1111/ijcp.13525. [Epub ahead of print]. - DOI - PMC - PubMed
    1. Brufsky A. (2020). Distinct viral clades of SARS-CoV-2: implications for modeling of viral spread. J. Med. Virol. 10.1002/jmv.25902. [Epub ahead of print]. - DOI - PMC - PubMed
    1. Ceraolo C., Giorgi F. M. (2020). Genomic variance of the 2019-nCoV coronavirus. J. Med. Virol. 92, 522–528. 10.1002/jmv.25700 - DOI - PMC - PubMed