. 2020 Jul 21:11:1536.
doi: 10.3389/fimmu.2020.01536. eCollection 2020.

Essential Role for CD30-Transglutaminase 2 Axis in Memory Th1 and Th17 Cell Generation

Affiliations

Essential Role for CD30-Transglutaminase 2 Axis in Memory Th1 and Th17 Cell Generation

Akane S Suzuki et al. Front Immunol. .

Abstract

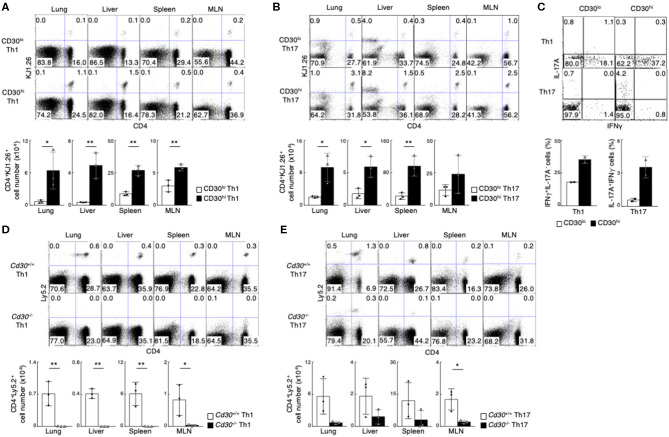
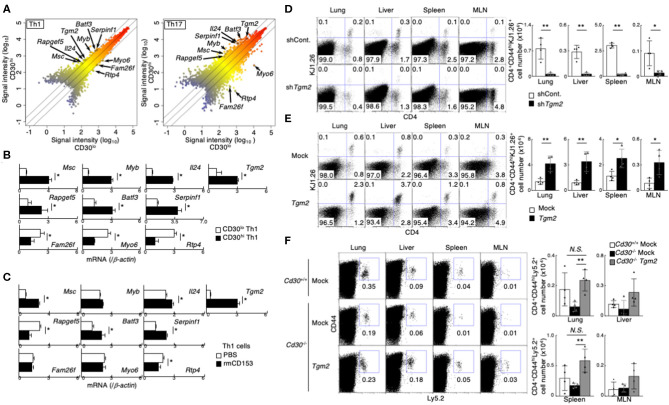
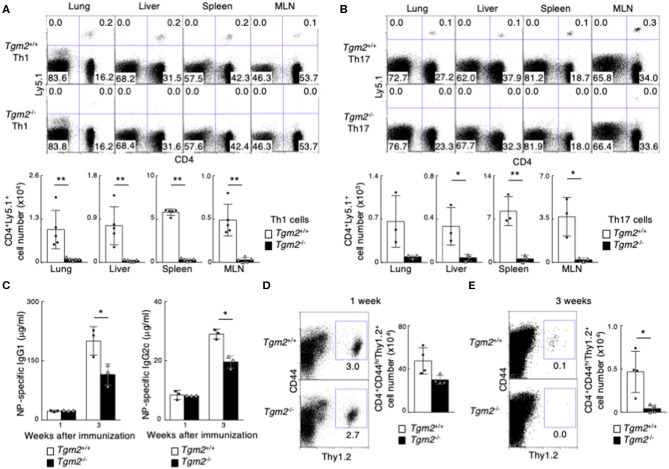
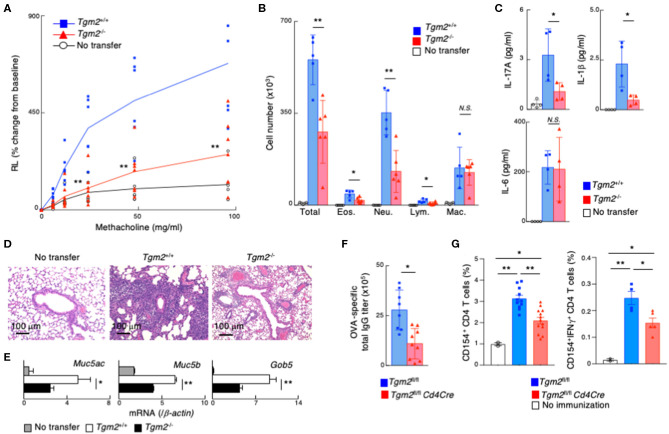
Memory helper T (Th) cells are crucial for secondary immune responses against infectious microorganisms but also drive the pathogenesis of chronic inflammatory diseases. Therefore, it is of fundamental importance to understand how memory T cells are generated. However, the molecular mechanisms governing memory Th cell generation remain incompletely understood. Here, we identified CD30 as a molecule heterogeneously expressed on effector Th1 and Th17 cells, and CD30hi effector Th1 and Th17 cells preferentially generated memory Th1 and Th17 cells. We found that CD30 mediated signal induced Transglutaminase-2 (TG2) expression, and that the TG2 expression in effector Th cells is essential for memory Th cell generation. In fact, Cd30-deficiency resulted in the impaired generation of memory Th1 and Th17 cells, which can be rescued by overexpression of TG2. Furthermore, transglutaminase-2 (Tgm2)-deficient CD4 T cells failed to become memory Th cells. As a result, T cells from Tgm2-deficient mice displayed impaired antigen-specific antibody production and attenuated Th17-mediated allergic responses. Our data indicate that CD30-induced TG2 expression in effector Th cells is essential for the generation of memory Th1 and Th17 cells, and that CD30 can be a marker for precursors of memory Th1 and Th17 cells.

Keywords: CD30; TG2; Th1; Th17; airway inflammation; memory Th cell generation; memory precursor.


Figures

Figure 1
Figure 1
Preferential generation of memory Th1 and Th17 cells from effector CD30hi Th cells. (A,B) in vitro-differentiated DO11.10 Tg CD30hi, or CD30lo Th1 (A) or Th17 (B) cells (5 × 10⁶) were transferred into BALB/c mice, and the mice were analyzed 1 month later (the protocol shown in Supplemental Figure 1F). Representative CD4/KJ1.26 profiles of the transferred cells in the lung, liver, spleen, and mesenteric lymph node (MLN) (upper panels) and the absolute cell numbers of CD4+KJ1.26+ transferred cells in three individual animals are shown (lower panels). Data are representative of three independent experiments. (C) Cytokine profiles of splenic CD4+KJ1.26+ memory Th1 and Th17 cells recovered from the host mice as in (A,B) are shown. Whole splenocytes were restimulated with PMA + Ionomycin for 4 h in the presence of monensin, and performed intracellular staining to detect the indicated cytokines. (D,E) in vitro-differentiated Th1 (D) or Th17 (E) cells (3 × 10⁷) from OTII Tg Cd30+/+ or Cd30−/− mice (Ly5.2) were transferred into Ly5.1 mice and analyzed 1 month later (the protocol shown in Supplemental Figure 1F). Representative CD4/Ly5.2 profiles of the transferred cells in the indicated tissues (upper panels) and the absolute cell numbers of CD4+Ly5.2+ transferred cells are shown (lower panels). Data are representative of at least two independent experiments. Mean values with SDs (n = 3) are shown (**P < 0.01, *P < 0.05).
Figure 2
Figure 2
Importance of CD30 signaling-induced Transglutaminase 2 (TG2) expression on memory Th1 and Th17 cell generation. (A) Scatterplot showing the correlation of gene expression in cDNA microarray analysis between CD30hi vs. CD30lo cells in Th1 (left) and Th17 (right) cells. Signal intensities (log10) are shown. Differentially expressed genes were selected using the following criteria: (1) signal “present” call and (2) signal intensity >= 300 for higher expressed genes. (3) 2-1.5-fold change in gene expression. (B) mRNA expression of the indicated genes between CD30hi and CD30lo Th1 cells by qRT-PCR. Mean values with SDs are shown (*P < 0.01). (C) mRNA expression of the indicated genes after recombinant mouse CD153 stimulation. Naïve CD4 T cells were cultured under Th1 cell conditions for 24 h and the cells were treated with or without recombinant mouse CD153 (the protocol shown in Supplemental Figure 2C). Mean values with SDs are shown (*P < 0.01). (D,E) Effects of TG2 knockdown (D) and overexpression (E) on the generation of memory Th cells. DO11.10 Tg Th1 cells (the protocol shown in Supplemental Figure 2E). TG2 knockdown (D) and overexpressed (E) cells transferred into the host mice were detected based on their CD4 and KJ1.26 expression (left panels), and the absolute cell numbers of CD4+CD44hiKJ1.26+ transferred cells are shown (right panels). Mean values with SDs (n = 4) are shown (**P < 0.01, *P < 0.05). Data are representative of at least two independent experiments. (F) Tgm2 or Mock retrovirus-transduced Ly5.2 Cd30 sufficient or deficient Th1 cells (5 × 10⁶) were transferred into Ly5.1 mice, and these mice were analyzed 1 week later as shown in Supplemental Figure 2E. A representative Ly5.2/CD44 profile of the transferred CD4 T cells in the indicated tissues (left panels) and the absolute cell numbers of CD4+CD44hiLy5.2+ transferred cells (right panels) are shown. Mean values with SDs (n = 4) are shown (**P < 0.01, *P < 0.05). Data are representative of at least two independent experiments.
Figure 3
Figure 3
Failure of memory Th1 and Th17 cell generation in the absence of TG2. (A,B) in vitro-differentiated Th1 (A) or Th17 (B) cells (3 × 10⁷) from Ly5.1 OTII Tg Tgm2+/+ or Tgm2−/− mice were transferred into C57BL/6 (Ly5.2) host mice, and these mice were analyzed 1 month later, as described in Supplemental Figure 3E. Representative CD4/Ly5.1 profiles of the transferred cells in the indicated tissues (upper panels) and the absolute cell numbers of CD4+Ly5.1+ transferred cells are shown (lower panels). Mean values with SDs (n = 3–5) are shown (**P < 0.01, *P < 0.05). Data are representative of at least two independent experiments. (C–E) Thy1.2 splenic CD4 T cells (1 × 10⁶) isolated from OTII Tg Tgm2+/+ or Tgm2−/− mice were transferred into Thy1.1 C57BL/6 mice, and the mice were immunized with 100 μg NP-OVA in CFA, as described in Supplemental Figure 3H. (C) Concentrations of anti-NP-IgG1 and anti-NP-IgG2c antibodies in sera at each time point after the immunization was analyzed by ELISA assays. Mean values with SDs (n = 3) are shown (*P < 0.05). (D,E) Representative Thy1.2/CD44 profiles of the transferred cells in the spleen (left panels) and the absolute cell numbers of CD4+CD44hiThy1.2+ transferred cells (right panels) 1 week (D) or 3 weeks (E) after cell transfer are shown. Mean values with SDs (n = 4) are shown (*P < 0.05).
Figure 4
Figure 4
Impairment of memory Th17-driven allergic airway inflammation and antibody production in mice with TG2 deficient T cells. (A–E) in vitro-differentiated OTII Tg Tgm2+/+ or Tgm2−/− Th17 cells (1 × 10⁷) were transferred into C57BL/6 mice, and 3 weeks later, the mice were challenged intranasally with OVA for three consecutive days (the protocol described in Supplemental Figure 4A). (A) AHR in response to increasing doses of methacholine was assessed 1 day after the last OVA challenges. Mean values with SDs (n = 6–7) are shown. (B) The number of total infiltrated mononuclear cells (Total), eosinophils (Eos.), neutrophils (Neu.), lymphocytes (Lym.), and macrophages (Mac.) in the BAL fluid. Mean values with SDs (n = 5) are shown. (C) The concentrations of IL-17A, IL-1β, and IL-6 in the BAL fluid measured by a cytometric bead array (CBA). Mean values with SDs (n = 4) are shown. (D) Histological analysis (H&E staining) of the lung. (E) Muc5ac, Muc5b, and Gob5 mRNA expressions in the lung. (F,G) Mice were immunized with 100 μg OVA plus 10 μg LPS twice at an interval of 2 weeks, and the blood samples were taken 4 weeks after the last immunization (F). The splenocytes were stimulated with whole OVA in vitro for 4 h and analyzed the frequencies of CD154+ cells and CD154+IFNγ+ cells (G) (the protocol described in Supplemental Figure 4C) (n = 5–7). Data are representative of at least two independent experiments (**P < 0.01, *P < 0.05).

Similar articles

Cited by

References

    1. Nakayama T, Hirahara K, Onodera A, Endo Y, Hosokawa H, Shinoda K, et al. . Th2 cells in health and disease. Annu Rev Immunol. (2017) 35:53–84. 10.1146/annurev-immunol-051116-052350 - DOI - PubMed
    1. Sansonetti PJ, Di Santo JP. Debugging how bacteria manipulate the immune response. Immunity. (2007) 26:149–61. 10.1016/j.immuni.2007.02.004 - DOI - PubMed
    1. Zhu J, Yamane H, Paul WE. Differentiation of effector CD4 T cell populations (*). Annu Rev Immunol. (2010) 28:445–89. 10.1146/annurev-immunol-030409-101212 - DOI - PMC - PubMed
    1. Sallusto F, Geginat J, Lanzavecchia A. Central memory and effector memory T cell subsets: function, generation, and maintenance. Annu Rev Immunol. (2004) 22:745–63. 10.1146/annurev.immunol.22.012703.104702 - DOI - PubMed
    1. Nakayama T, Yamashita M. Initiation and maintenance of Th2 cell identity. Curr Opin Immunol. (2008) 20:265–71. 10.1016/j.coi.2008.03.011 - DOI - PubMed

Publication types