. 2020 Jul 23:11:1609.
doi: 10.3389/fimmu.2020.01609. eCollection 2020.

Inhibiting Histone Deacetylases in Human Macrophages Promotes Glycolysis, IL-1β, and T Helper Cell Responses to Mycobacterium tuberculosis

Affiliations

Inhibiting Histone Deacetylases in Human Macrophages Promotes Glycolysis, IL-1β, and T Helper Cell Responses to Mycobacterium tuberculosis

Donal J Cox et al. Front Immunol. .

Abstract

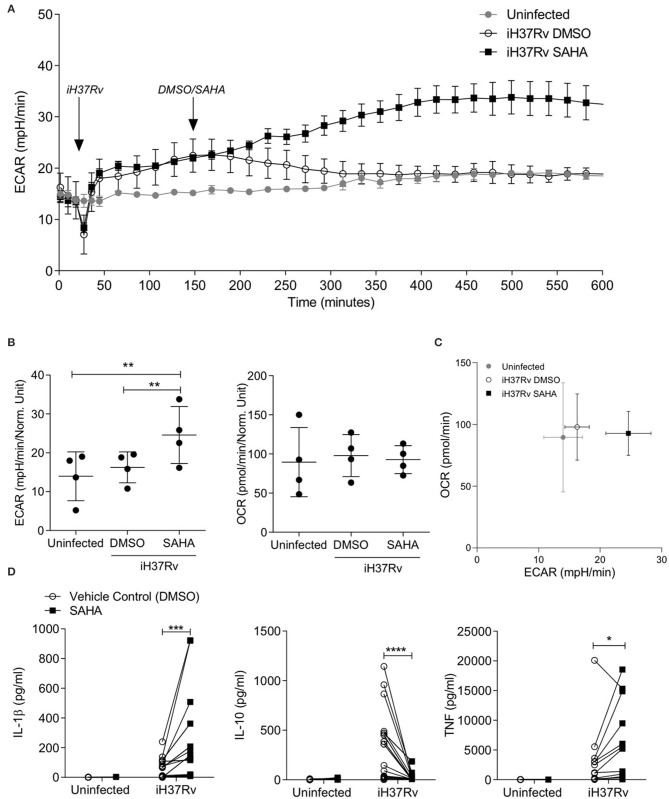
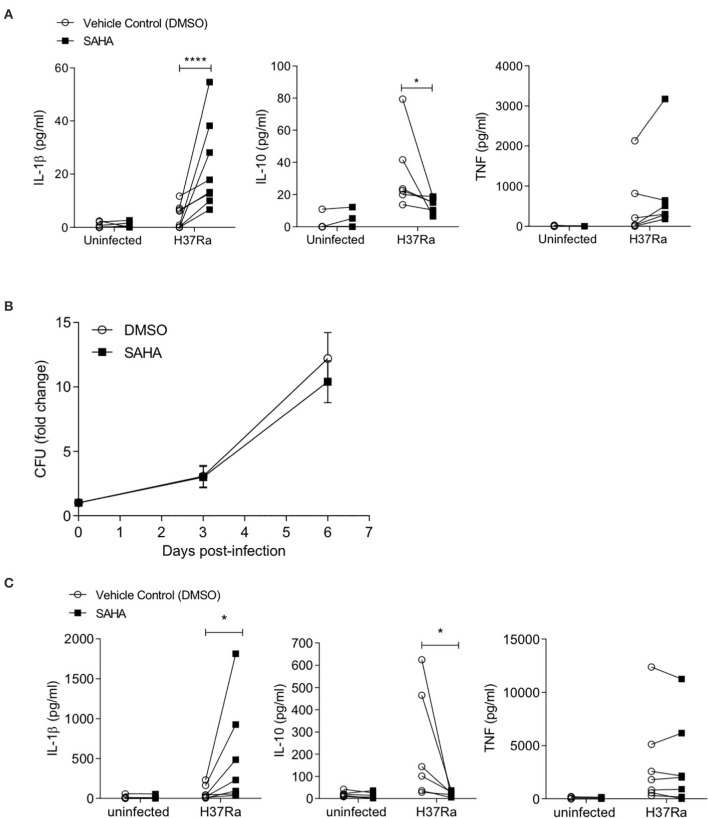
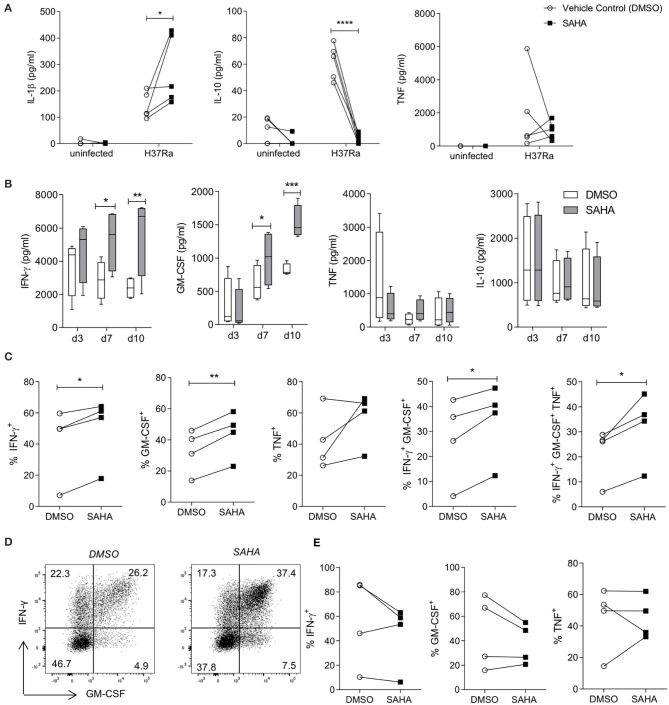
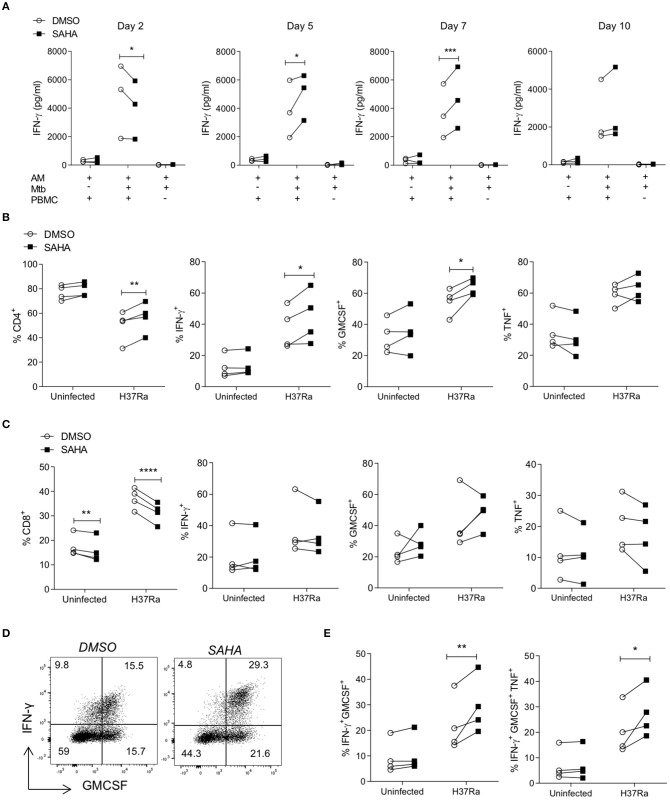
Tuberculosis (TB) is the leading infectious killer in the world. Mycobacterium tuberculosis (Mtb), the bacteria that causes the disease, is phagocytosed by alveolar macrophages (AM) and infiltrating monocyte-derived macrophages (MDM) in the lung. Infected macrophages then upregulate effector functions through epigenetic modifications to make DNA accessible for transcription. The metabolic switch to glycolysis and the production of proinflammatory cytokines are key effector functions, governed by epigenetic changes, that are integral to the ability of the macrophage to mount an effective immune response against Mtb. We hypothesised that suberanilohydroxamic acid (SAHA), an FDA-approved histone deacetylase inhibitor (HDACi), can modulate epigenetic changes upstream of the metabolic switch and support immune responses during Mtb infection. The rate of glycolysis in human MDM, infected with Mtb and treated with SAHA, was tracked in real time on the Seahorse XFe24 Analyzer. SAHA promoted glycolysis early in the response to Mtb. This was associated with significantly increased production of IL-1β and significantly reduced IL-10 in human MDM and AM. Since innate immune function directs downstream adaptive immune responses, we used SAHA-treated Mtb-infected AM or MDM in a co-culture system to stimulate T cells. Mtb-infected macrophages that had previously been treated with SAHA promoted IFN-γ, GM-CSF, and TNF co-production in responding T helper cells but did not affect cytotoxic T cells. These results indicate that SAHA promoted the early switch to glycolysis, increased IL-1β, and reduced IL-10 production in human macrophages infected with Mtb. Moreover, the elevated proinflammatory function of SAHA-treated macrophages resulted in enhanced T helper cell cytokine polyfunctionality. These data provide an in vitro proof-of-concept for the use of HDACi to modulate human immunometabolic processes in macrophages to promote innate and subsequent adaptive proinflammatory responses.

Keywords: HDACi; SAHA; T cell; Vorinostat; glycolysis; human alveolar macrophage; immunomodulation; tuberculosis.


Figures

Figure 1
Figure 1
SAHA supports aerobic glycolysis and modulates cytokine production in human macrophages during early Mtb infection. Monocyte derived macrophages (MDM) were analysed on the Seahorse XFe24 Analyzer. The extracellular acidification rates (ECAR) and oxygen consumption rate (OCR) were recorded approximately every 20 min. After 30 min, the Seahorse Analyzer injected iH37Rv (MOI 1-10) into assigned wells. Two hours later, DMSO or SAHA were injected through the Seahorse Analyzer (at 150 min; as indicated by the arrows). The ECAR and OCR readings were then continually sampled in real time. (A) Representative time-course graph illustrating the ECAR of MDM in real-time response to stimulation with iH37Rv and treatment with SAHA or vehicle control (DMSO); 3 technical replicates ± SD. (B) Collated data (error bars indicate mean ± SD) from n = 4 independent experiments for ECAR and OCR at 500 min. (C) The phenogram illustrates the energetic profile of MDM by plotting ECAR vs. OCR at 500 min (±SD, n = 4). (D) MDM were stimulated with iH37Rv for 24 h and concentrations of IL-1β (n = 18), IL-10 (n = 18), and TNF (n = 12) present in the supernatants were quantified by ELISA. Each paired data point represents the average of technical replicates from a single donor treated with DMSO (empty circles) or SAHA (closed squares). Statistically significant differences between DMSO and SAHA were determined by one-way ANOVA with Tukey's multiple comparison test (B) or two-way ANOVA with Sidak's multiple comparison test (D); *P < 0.05, **P < 0.01, ***P < 0.001, ****P < 0.0001.
Figure 2
Figure 2
SAHA modulates cytokine production in the context of live Mtb H37Ra infection in human healthy control MDM and alveolar macrophages. (A) MDM were infected with Mtb H37Ra (MOI 1-10) in the presence of SAHA or vehicle control (DMSO) for 24 h. The concentrations of IL-1β (n = 8), IL-10 (n = 6), and TNF (n = 8) present in the supernatants were quantified by ELISA. (B) MDM infected with Mtb H37Ra (MOI 1-10) were lysed on day 0 (3 h post-infection), day 3, and day 6. CFU were enumerated on Middlebrook 7H10 agar supplemented with OADC on day 21 post lysis. CFU are presented as fold change from day 0 and data points represent the average ± SD of n = 3 independent experiments. (C) Human AM (n = 7) were infected with H37Ra (MOI 1-10) in the presence of SAHA or DMSO. After 24 h, the concentrations of IL-1β, IL-10, and TNF present in the supernatants were measured by ELISA. Each paired data point represents the average of technical replicates from a single donor treated with DMSO (empty circles) or SAHA (closed squares). Statistically significant differences between DMSO and SAHA were determined by two-way ANOVA with Sidak's multiple comparison test (A,C) or by paired Student's t-test (B); *P < 0.05, ****P < 0.0001.
Figure 3
Figure 3
SAHA-treated MDM enhanced downstream effector CD4 T cell responses to Mtb. MDM differentiated from the PBMC of IGRA positive individuals were infected with H37Ra (MOI 1-10) in the presence of SAHA or vehicle control (DMSO). (A) After 24 h, the concentrations of IL-1β, IL-10 and TNF were quantified by ELISA (n = 5). MDM were washed and co-cultured with CFSE-labelled PBMC from autologous donors. (B) The concentrations of IFN-γ, GM-CSF, TNF, and IL-10 present in the co-cultured supernatants on the indicated days were analysed by ELISA; collated data from n = 4 experiments, error bars indicate ± SD. (C–E) On day 10 post co-culture, PBMC were removed, stimulated with PMA/ionomycin in the presence of brefeldin A, or left unstimulated. Cells were stained with fluorochrome-conjugated antibodies specific for CD3, CD8, IFN-γ, TNF and GM-CSF, and analysed by flow cytometry. (C) Graphs illustrate collated data for the frequencies of cells producing cytokines in the population of CD3+CD8 (CD4+) T helper cells that are proliferating (CFSElo) in response to stimulation with Mtb infected macrophages (n = 4). Cells were gated on the basis of forward and side scatter, doublets were then excluded and the population of proliferating CFSElo cells were gated. The Th cell subpopulation was gated within proliferating cells, then cytokines were examined within these populations. (D) Representative dot plots illustrate co-staining of GM-CSF with IFN-γ from proliferating CD4 (CD3+ CD8) T cells. (E) Cytokine production from proliferating CD8+ T cells was assessed. Statistically significant differences between DSMO and SAHA treated groups were determined by two-way ANOVA with Sidak's multiple comparisons test (A,B) or paired t-test (C,E); *P < 0.05, **P < 0.01, ***P < 0.001.
Figure 4
Figure 4
SAHA treated AM enhanced BCG-primed CD4 Th cell responses to Mtb infection. Human AM were infected with H37Ra (MOI 1-10) in the presence of SAHA or DMSO. After 24 h, AM were washed and co-cultured with CFSE-labelled PBMC from a BCG-vaccinated healthy donor (IGRA negative) who responds to PPD antigens in vitro. Uninfected AM co-cultured with PBMC and Mtb-infected AM not co-cultured with PBMC were assayed in parallel as controls. (A) The concentrations of IFN-γ present in the supernatants on the indicated days were analysed by ELISA (n = 3). On day 10 post co-culture, PBMC were removed, stimulated with PMA/ionomycin in the presence of brefeldin A, or left unstimulated. (B,C) Cells were stained with fluorochrome-conjugated antibodies specific for CD3, CD4, CD8, IFN-γ, TNF and GM-CSF, and analysed by flow cytometry. Cells were gated on the basis of forward and side scatter, doublets were then excluded and the population of proliferating CFSElo cells were gated. The CD4 and CD8 cell subpopulations were gated within proliferating cells, then cytokines were examined within these populations. Graphs illustrated collated data (n = 4) from unstimulated samples for the frequencies of proliferating cells expressing CD4 (B; left) or CD8 (C; left) and cytokine production from stimulated samples within the population of proliferating (CFSElo) CD3+ CD8 (CD4+) T helper cells (B) and CD3+ CD8+ cytotoxic T cells (C). (D) Representative dot plots illustrate co-staining of IFN-γ and GM-CSF within the CFSElo CD3+ CD8 Th cell gate. (E) Collated data shows the frequencies of IFN-γ+ GM-CSF+ double-positive and IFN-γ+ GM-CSF+ TNF+ triple-positive cells in the CD4 Th cell population that are proliferating. Statistically significant differences between DSMO and SAHA treated groups were determined by two-way ANOVA with Sidak's multiple comparisons test; *P < 0.05, **P < 0.01, ***P < 0.001, ****P < 0.0001.

References

    1. WHO Global Tuberculosis Report 2019. Geneva: WHO; (2019).
    1. Mekonnen HS, Azagew AW. Non-adherence to anti-tuberculosis treatment, reasons and associated factors among TB patients attending at gondar town health centers, Northwest Ethiopia. BMC Res Notes. (2018) 11:691. 10.1186/s13104-018-3789-4 - DOI - PMC - PubMed
    1. Moores RC, Brilha S, Schutgens F, Elkington PT, Friedland JS. Epigenetic regulation of matrix metalloproteinase-1 and−3 expression in Mycobacterium tuberculosis infection. Front Immunol. (2017) 8:602. 10.3389/fimmu.2017.00602 - DOI - PMC - PubMed
    1. Kathirvel M, Mahadevan S. The role of epigenetics in tuberculosis infection. Epigenomics. (2016) 8:537–49. 10.2217/epi.16.1 - DOI - PubMed
    1. Koeken V, Verrall AJ, Netea MG, Hill PC, van Crevel R. Trained innate immunity and resistance to Mycobacterium tuberculosis infection. Clin Microbiol Infect. (2019) 25:1468–72. 10.1016/j.cmi.2019.02.015 - DOI - PubMed

Publication types

MeSH terms

LinkOut - more resources