

Innovative Soil Management and Micro-Climate Modulation for Saving Water in Peach Orchards
- PMID: 32793253
- PMCID: PMC7387510
- DOI: 10.3389/fpls.2020.01052
Innovative Soil Management and Micro-Climate Modulation for Saving Water in Peach Orchards
Abstract
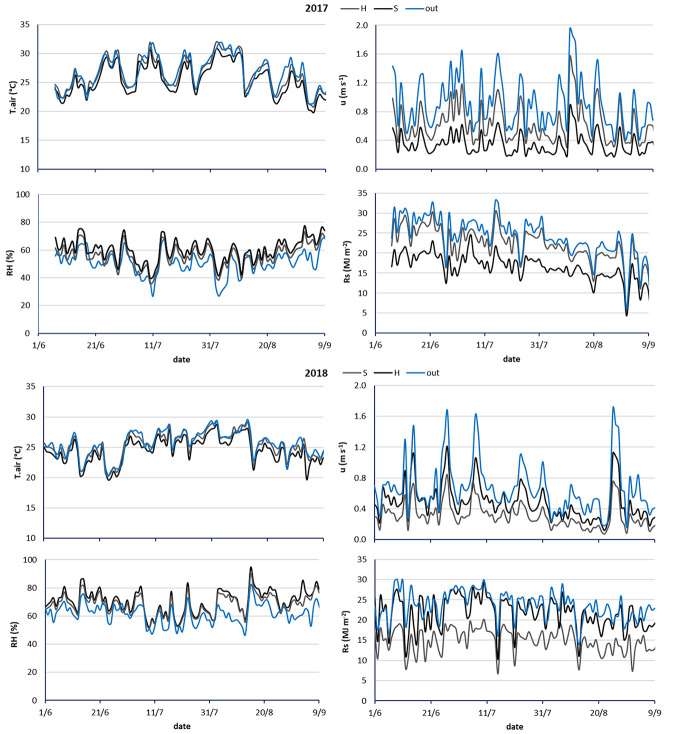
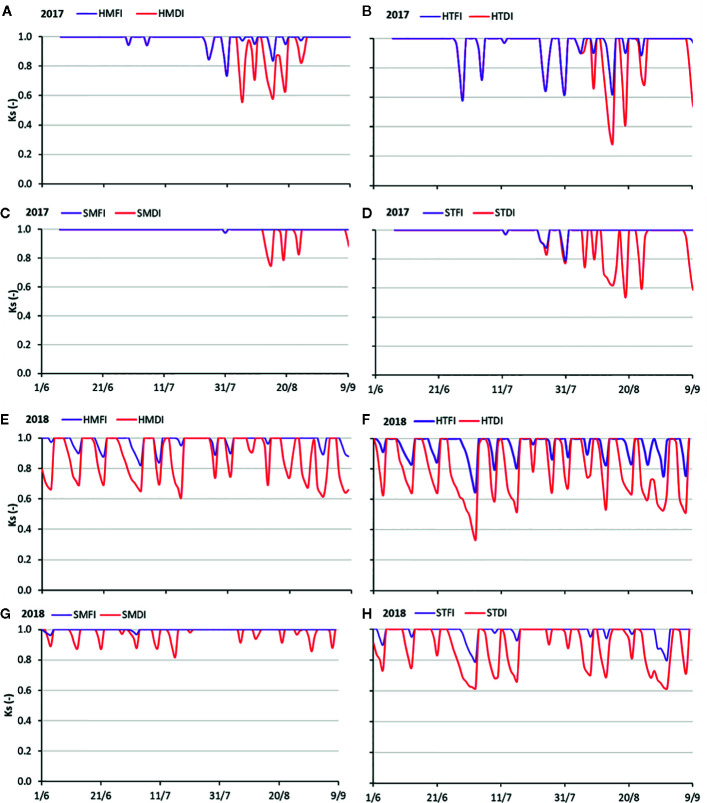
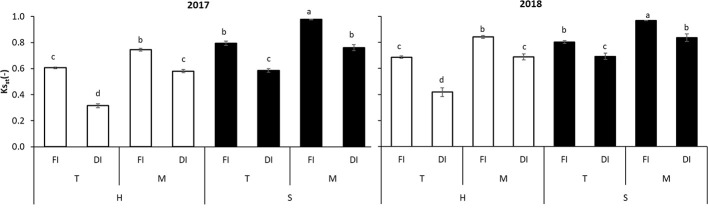
Microclimatic and soil management studies emphasize that roofing above the canopy or soil mulching contributes to reduce water losses from horticultural cropping systems and, at the same time, to increase water use efficiency. The aim of this 2-year on-farm study, carried out on a late ripening peach (cv. California) orchard, was to investigate the combined effect of water supply (full or deficit irrigation, DI), incoming light (hail or shading net), and soil management (tilling or mulching) on: microclimate; fruit growth; yield; irrigation water use productivity (WPI); and soil water stress coefficient (Ks). Shading hail net reduced air temperature (-1°C), wind speed (-57%), solar radiation (-32%), while increased relative air humidity (+9.5%). Compared to the control treatment (hail net coverage, soil tillage, and full irrigation), the innovative management (DI + shading hail net + mulching) reduced seasonal volumes of irrigation water (-25%) and increased both final yield (+36%) and WPI (+53%). Saving water resources without losing yield is an achievable goal by peach orchards growing under the Mediterranean climate if the DI agro-technique is adopted conjointly with shading hail net and soil mulching.
Keywords: deficit irrigation; irrigation water productivity; mulching; shading hail net; soil stress coefficient.
Copyright © 2020 Campi, Gaeta, Mastrorilli and Losciale.
Figures


References
-
- Abou Kheira A. A., Atta N. M. M. (2009). Response of Jatropa curcas L. to water deficit: yield, water use efficiency and oliseed characteristics. Biomass Bioenergy 33, 1343–1350. 10.1016/j.biombioe.2008.05.015 - DOI
-
- Abouatallah A., Salghi R., El Fadl A., Hammouti B., Zarrouk A., Atraoui A., et al. (2012). Shading hail-nets usefulness for water saving on Citrus orchards under different irrigation doses. Curr. World Environ. 7, 13–22. 10.12944/CWE.7.1.03 - DOI
-
- Allen R. G., Pereira L. S., Raes D., Smith M. (1998). Crop evapotranspiration. Guide-lines for computing crop water requirements, FAO Irrigation and Drainage Paper No. 56. (Rome, Italy: FAO; ).
-
- Allen M. R., Coninck H. D., Dube O. P., Hoegh-Guldberg O., Jacob D., Jiang K., et al. (2018). “Technical Summary,” in Global warming of 1.5°C : An IPCC Special Report on the impacts of global warming of 1.5°C above pre-industrial levels and related global greenhouse gas emission pathways, in the context of strengthening the global response to the threat of climate change, sustainable development, and efforts to eradicate poverty. Eds. Masson-Delmotte V., Zhai P., Pörtner H. O., Roberts D., Skea J., Shukla P. R., Pirani A., Moufouma-Okia W., Péan C., Pidcock R., Connors S., Matthews J. B. R., Chen Y., Zhou X., Gomis M., II, Lonnoy E., Maycock T., Tignor M., Waterfield T. (Intergovernmental Panel on Climate Change; ), 27–46.
-
- Ballester C., Castel J., Jiménez-Bello M. A., Castel J. R., Intrigliolo D. S. (2013). Thermographic measurement of canopy temperature is a useful tool for predicting water deficit effects on fruit weight in citrus trees. Agric. Water Manage. 122, 1–6. 10.1016/j.agwat.2013.02.005 - DOI
LinkOut - more resources
Full Text Sources