

Increased Dose to Organs in Urinary Tract Associates With Measures of Genitourinary Toxicity in Pooled Voxel-Based Analysis of 3 Randomized Phase III Trials
- PMID: 32793485
- PMCID: PMC7387667
- DOI: 10.3389/fonc.2020.01174
Increased Dose to Organs in Urinary Tract Associates With Measures of Genitourinary Toxicity in Pooled Voxel-Based Analysis of 3 Randomized Phase III Trials
Abstract
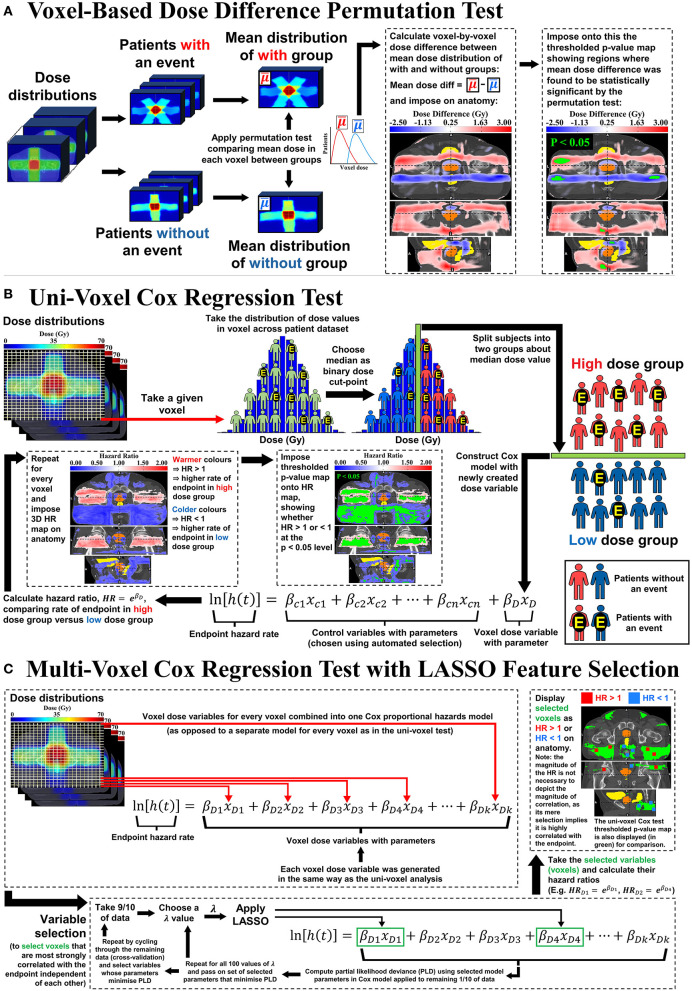
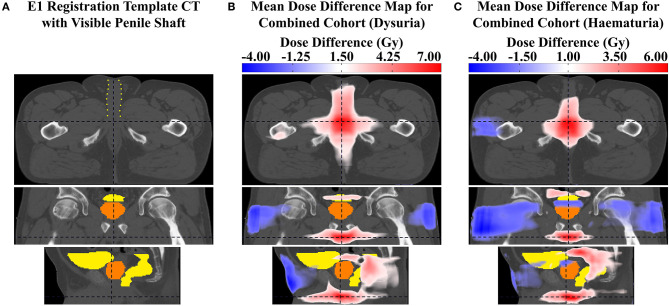
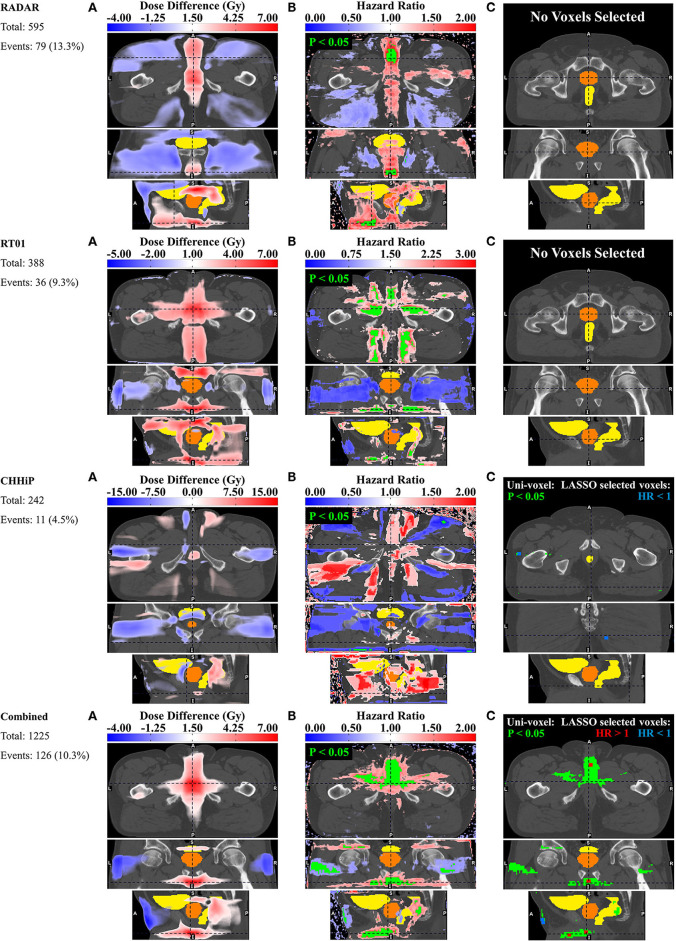
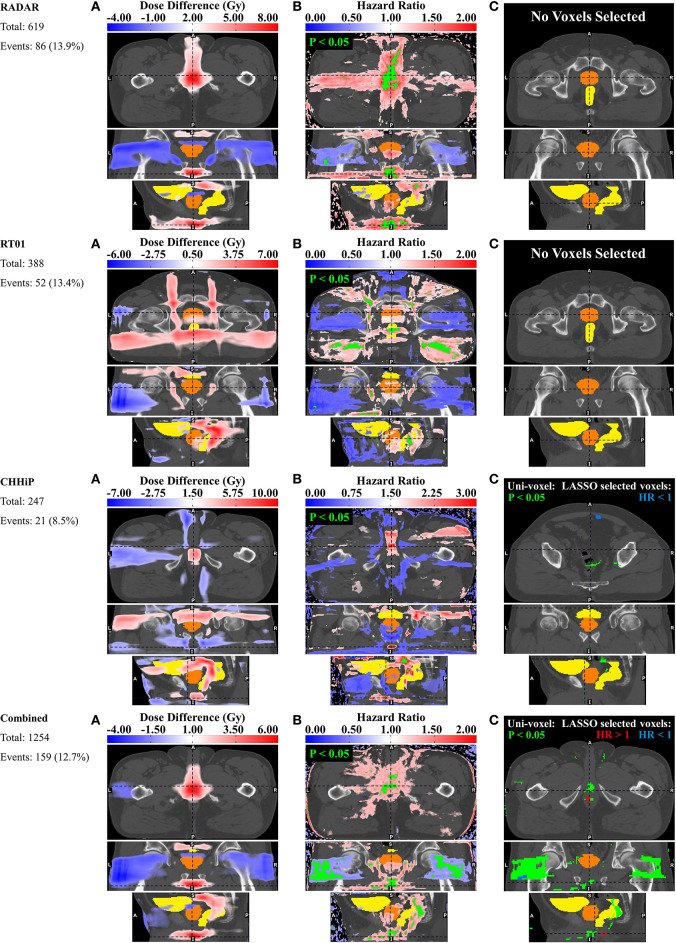
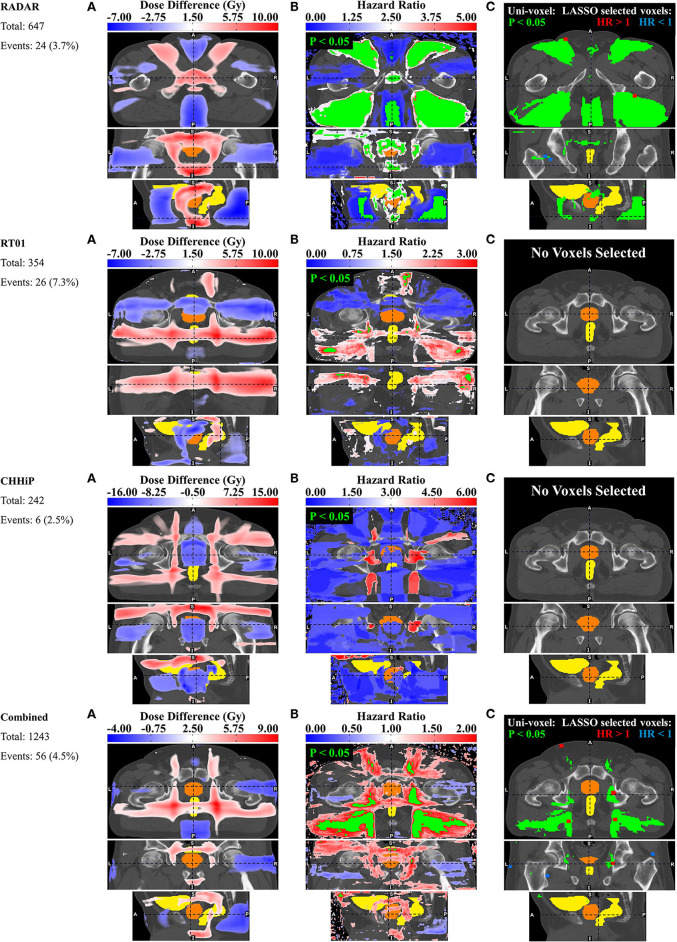
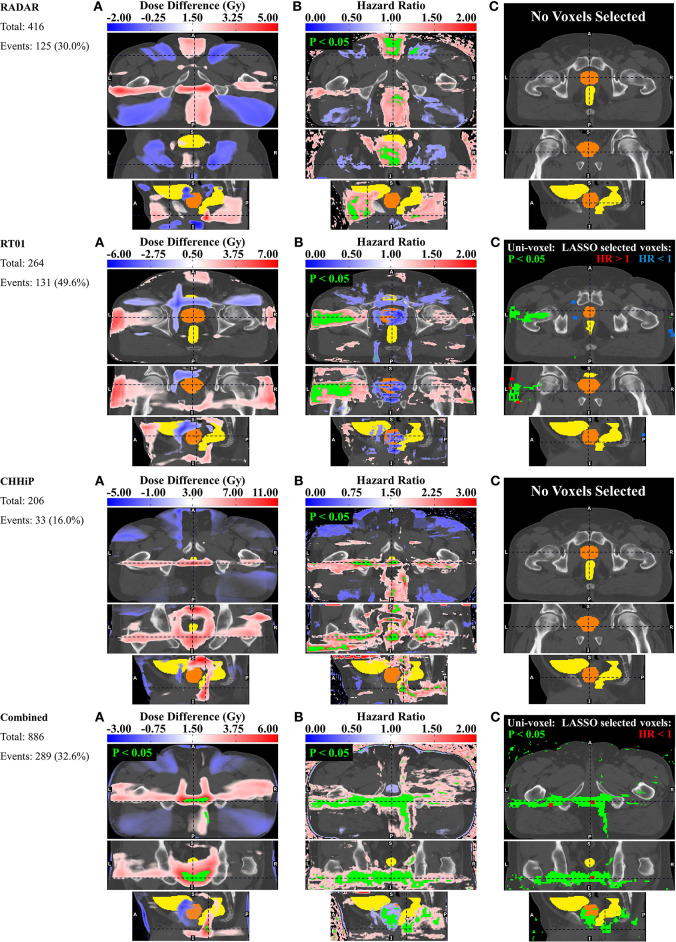
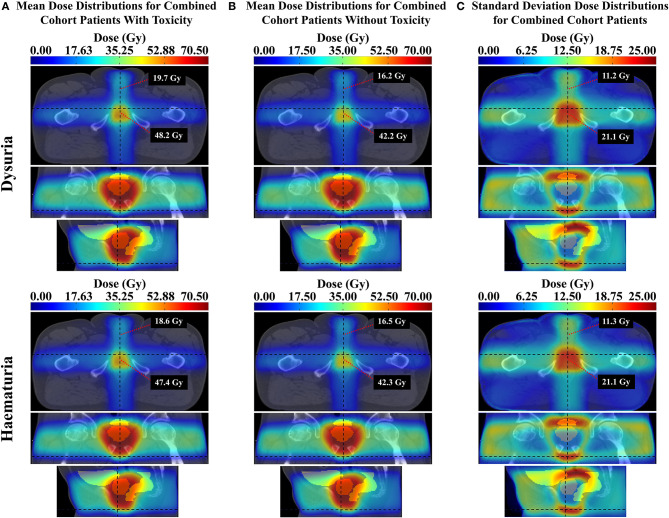
Purpose: Dose information from organ sub-regions has been shown to be more predictive of genitourinary toxicity than whole organ dose volume histogram information. This study aimed to identify anatomically-localized regions where 3D dose is associated with genitourinary toxicities in healthy tissues throughout the pelvic anatomy. Methods and Materials: Dose distributions for up to 656 patients of the Trans-Tasman Radiation Oncology Group 03.04 RADAR trial were deformably registered onto a single exemplar CT dataset. Voxel- based multiple comparison permutation dose difference testing, Cox regression modeling and LASSO feature selection were used to identify regions where 3D dose-increase was associated with late grade ≥ 2 genitourinary dysuria, incontinence and frequency, and late grade ≥ 1 haematuria. This was externally validated by registering dose distributions from the RT01 (up to n = 388) and CHHiP (up to n = 247) trials onto the same exemplar and repeating the voxel-based tests on each of these data sets. All three datasets were then combined, and the tests repeated. Results: Voxel-based Cox regression and multiple comparison permutation dose difference testing revealed regions where increased dose was correlated with genitourinary toxicity. Increased dose in the vicinity of the membranous and spongy urethra was associated with dysuria for all datasets. Haematuria was similarly correlated with increased dose at the membranous and spongy urethra, for the RADAR, CHHiP, and combined datasets. Some evidence was found for the association between incontinence and increased dose at the internal and external urethral sphincter for RADAR and the internal sphincter alone for the combined dataset. Incontinence was also strongly correlated with dose from posterior oblique beams. Patients with fields extending inferiorly and posteriorly to the CTV, adjacent to the membranous and spongy urethra, were found to experience increased frequency. Conclusions: Anatomically-localized dose-toxicity relationships were determined for late genitourinary symptoms in the urethra and urinary sphincters. Low-intermediate doses to the extraprostatic urethra were associated with risk of late dysuria and haematuria, while dose to the urinary sphincters was associated with incontinence.
Keywords: dose-toxicity relationships; external beam radiotherapy; prostate cancer; urinary toxicity; voxel-based analysis.
Copyright © 2020 Marcello, Denham, Kennedy, Haworth, Steigler, Greer, Holloway, Dowling, Jameson, Roach, Joseph, Gulliford, Dearnaley, Sydes, Hall and Ebert.
Figures
Similar articles
-
Relationships between rectal and perirectal doses and rectal bleeding or tenesmus in pooled voxel-based analysis of 3 randomised phase III trials.Radiother Oncol. 2020 Sep;150:281-292. doi: 10.1016/j.radonc.2020.07.048. Epub 2020 Jul 31. Radiother Oncol. 2020. PMID: 32745667 Clinical Trial.
-
Reduced Dose Posterior to Prostate Correlates With Increased PSA Progression in Voxel-Based Analysis of 3 Randomized Phase 3 Trials.Int J Radiat Oncol Biol Phys. 2020 Dec 1;108(5):1304-1318. doi: 10.1016/j.ijrobp.2020.07.030. Epub 2020 Jul 30. Int J Radiat Oncol Biol Phys. 2020. PMID: 32739320 Clinical Trial.
-
Rectal and Urethro-Vesical Subregions for Toxicity Prediction After Prostate Cancer Radiation Therapy: Validation of Voxel-Based Models in an Independent Population.Int J Radiat Oncol Biol Phys. 2020 Dec 1;108(5):1189-1195. doi: 10.1016/j.ijrobp.2020.07.019. Epub 2020 Jul 13. Int J Radiat Oncol Biol Phys. 2020. PMID: 32673785 Clinical Trial.
-
Dose-escalated radiotherapy for clinically localized and locally advanced prostate cancer.Cochrane Database Syst Rev. 2023 Mar 8;3(3):CD012817. doi: 10.1002/14651858.CD012817.pub2. Cochrane Database Syst Rev. 2023. PMID: 36884035 Free PMC article. Review.
-
Pelvic Complications After Prostate Cancer Radiation Therapy and Their Management: An International Collaborative Narrative Review.Eur Urol. 2019 Mar;75(3):464-476. doi: 10.1016/j.eururo.2018.12.003. Epub 2018 Dec 17. Eur Urol. 2019. PMID: 30573316
Cited by
-
Predictors for late genitourinary toxicity in men receiving radiotherapy for high-risk prostate cancer using planned and accumulated dose.Phys Imaging Radiat Oncol. 2023 Feb 2;25:100421. doi: 10.1016/j.phro.2023.100421. eCollection 2023 Jan. Phys Imaging Radiat Oncol. 2023. PMID: 36817981 Free PMC article.
-
Selective sparing of bladder and rectum sub-regions in radiotherapy of prostate cancer combining knowledge-based automatic planning and multicriteria optimization.Phys Imaging Radiat Oncol. 2023 Aug 28;28:100488. doi: 10.1016/j.phro.2023.100488. eCollection 2023 Oct. Phys Imaging Radiat Oncol. 2023. PMID: 37694264 Free PMC article.
-
Bladder surface dose modeling in prostate cancer radiotherapy: An analysis of motion-induced variations and the cumulative dose across the treatment.Med Phys. 2021 Dec;48(12):8024-8036. doi: 10.1002/mp.15326. Epub 2021 Nov 16. Med Phys. 2021. PMID: 34734414 Free PMC article.
-
State of the art and future challenges of urethra-sparing stereotactic body radiotherapy for prostate cancer: a systematic review of literature.World J Urol. 2023 Nov;41(11):3287-3299. doi: 10.1007/s00345-023-04579-6. Epub 2023 Sep 5. World J Urol. 2023. PMID: 37668718 Free PMC article.
-
Stereotactic body radiation therapy for prostate cancer: a study comparing 3-year genitourinary toxicity between CyberKnife and volumetric-modulated arc therapy by propensity score analysis.Radiat Oncol. 2023 Feb 23;18(1):39. doi: 10.1186/s13014-023-02233-4. Radiat Oncol. 2023. PMID: 36823674 Free PMC article.
References
-
- Zelefsky MJ, Levin EJ, Hunt M, Yamada Y, Shippy AM, Jackson A, et al. . Incidence of late rectal and urinary toxicities after three-dimensional conformal radiotherapy and intensity-modulated radiotherapy for localized prostate cancer. Int J Radiat Oncol Biol Phys. (2008) 70:1124–9. 10.1016/j.ijrobp.2007.11.044 - DOI - PubMed
-
- Rancati T, Cozzarini C, Improta I, Palorini F, Garibaldi E, Franco P, et al. Multivariable models predicting specific patient-reported acute urinary symptoms after radiation therapy for prostate cancer: results of a cohort study. Int J Radiat Oncol Biol Phys. (2015) 93:E240–1. 10.1016/j.ijrobp.2015.07.1153 - DOI
-
- Yahya N, Ebert MA, Bulsara M, Haworth A, Kennedy A, Joseph DJ, et al. . Dosimetry, clinical factors and medication intake influencing urinary symptoms after prostate radiotherapy: an analysis of data from the RADAR prostate radiotherapy trial. Radiother Oncol. (2015) 116:112–8. 10.1016/j.radonc.2015.06.011 - DOI - PubMed
Grants and funding
LinkOut - more resources
Full Text Sources