

Stegomyia Indices and Risk of Dengue Transmission: A Lack of Correlation
- PMID: 32793541
- PMCID: PMC7393615
- DOI: 10.3389/fpubh.2020.00328
Stegomyia Indices and Risk of Dengue Transmission: A Lack of Correlation
Abstract
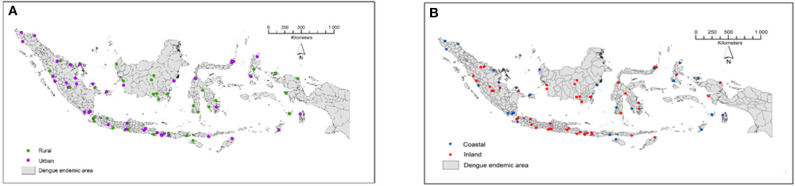
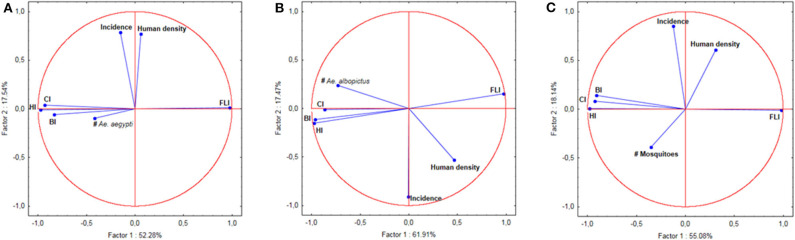
Dengue is present in 128 countries worldwide and is still expanding. There is currently no treatment or universally approved vaccine available. Therefore, prevention and control of mosquito vectors remain the most efficient ways of managing the risk of dengue outbreaks. The Stegomyia indices have been developed as quantitative indicators of the risk of dengue outbreaks. However, conflictual data are circulating about their reliability. We report in this article the first extensive study on Stegomyia indices, covering 78 locations of differing environmental and socio-economic conditions, climate, and population density across Indonesia, from West Sumatra to Papua. A total of 65,876 mosquito larvae and pupae were collected for the study. A correlation was found between incidence and human population density. No correlation was found between the incidence of dengue and the Stegomyia indices.
Keywords: Aedes aegypti; Aedes albopictus; Stegomyia indices; dengue; incidence; mosquito-borne disease.
Copyright © 2020 Garjito, Hidajat, Kinansi, Setyaningsih, Anggraeni, Mujiyanto, Trapsilowati, Jastal, Ristiyanto, Satoto, Gavotte, Manguin and Frutos.
Figures
References
-
- WHO Global Strategy for Dengue Prevention and Control 2012–2020. Geneva: World Health Organization; (2012). Available online at: https://www.who.int/denguecontrol/9789241504034/en/
-
- Ausvetplan Disease Strategy Japanese Encephalitis. Agriculture and Resource Management Council of Australia and New Zealand; (1998). p. 1–41. Available online at: http://www.international-food-safety.com/pdf/ausvet-japanese.pdf
Publication types
MeSH terms
LinkOut - more resources
Full Text Sources
Medical