

Histone deacetylase inhibition enhances the therapeutic effects of methotrexate on primary central nervous system lymphoma
- PMID: 32793886
- PMCID: PMC7415262
- DOI: 10.1093/noajnl/vdaa084
Histone deacetylase inhibition enhances the therapeutic effects of methotrexate on primary central nervous system lymphoma
Abstract
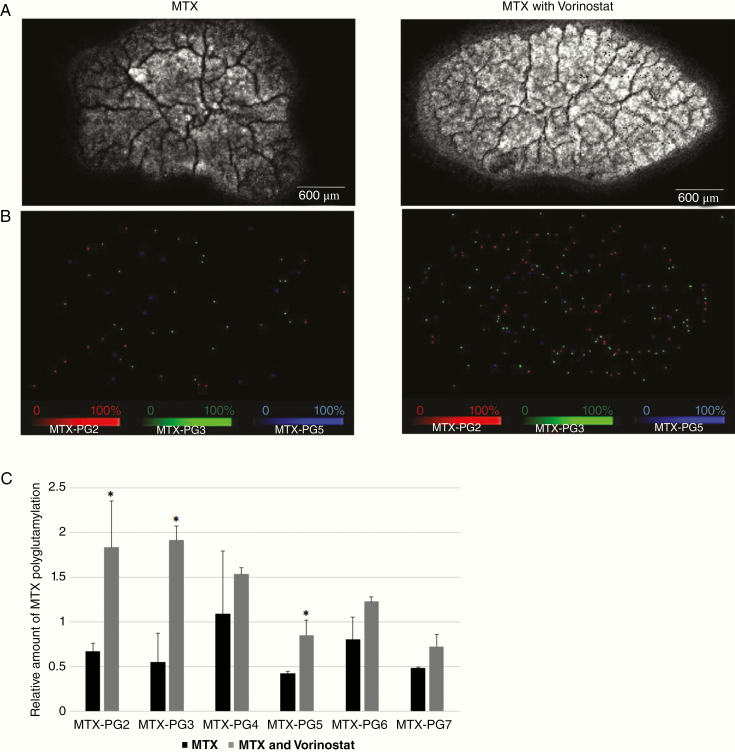
Background: Polyglutamylation is a reversible protein modification that commonly occurs in tumor cells. Methotrexate (MTX) in tumor cells is polyglutamylated and strongly binds to dihydrofolate reductase (DHFR) without competitive inhibition by leucovorin. Therefore, tumor cells with high polyglutamylation levels are supposed to be selectively killed, whereas normal cells with lower polyglutamylation are rescued by leucovorin. This study investigated the combined effects of MTX plus histone deacetylase inhibitors (HDACIs), which upregulate MTX polyglutamylation, in primary central nervous system lymphoma (PCNSL).
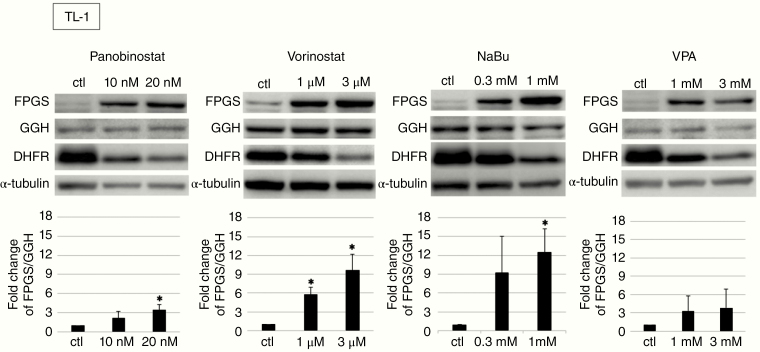
Methods: We evaluated cell viability after MTX treatment and leucovorin rescue and compared the expression of folylpolyglutamate synthetase (FPGS), γ-glutamyl hydrolase (GGH), and DHFR in 2 human PCNSL-derived cell lines (HKBML and TK) and a human Burkitt lymphoma cell line (TL-1). Combination treatments were created using 4 HDACIs: panobinostat, vorinostat, sodium butyrate, and valproic acid. The expression of DHFR was examined as well as ratios of FPGS/GGH expression. The combined effects of MTX plus HDACIs were evaluated using a cell viability assay, mass spectroscopy imaging, and subcutaneous and intracranial xenograft models.
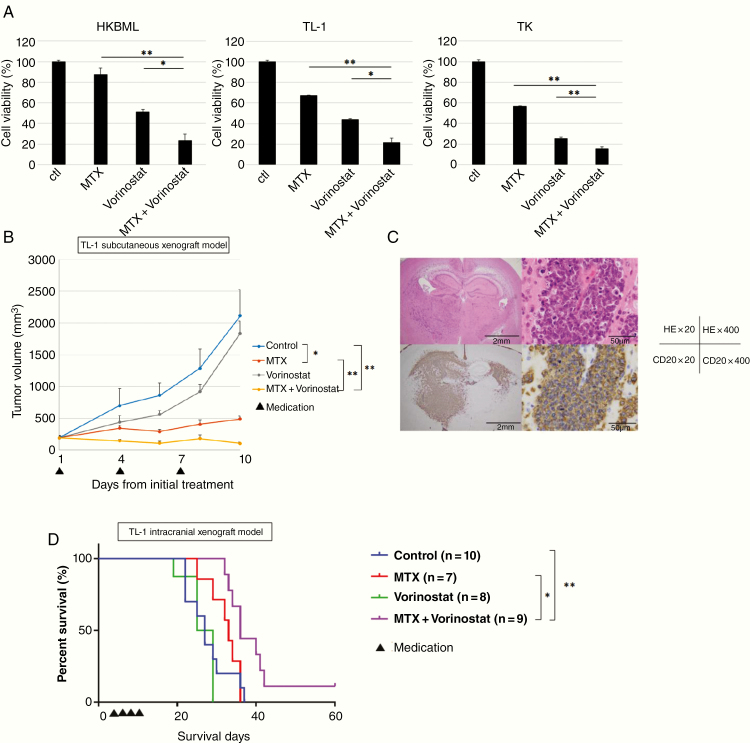
Results: HDACIs upregulated the ratio of FPGS/GGH expression resulting in increased polyglutamylation of MTX, but also downregulated expression of the target molecule of MTX: DHFR. The combination of MTX and vorinostat decreased cell viability in vitro (P < .05) and tumor volumes in a subcutaneous model (P < .0001), and prolonged survival in an intracranial model (P < .01), relative to controls.
Conclusion: HDACIs enhanced the therapeutic effect of MTX through increased polyglutamylation of MTX and concomitant downregulation of DHFR expression.
Keywords: histone deacetylase inhibitor; leucovorin; methotrexate; polyglutamylation; primary central nervous system lymphoma.
© The Author(s) 2020. Published by Oxford University Press, the Society for Neuro-Oncology and the European Association of Neuro-Oncology.
Figures

Similar articles
-
Clinical significance of polyglutamylation in primary central nervous system lymphoma.Acta Neuropathol Commun. 2018 Feb 23;6(1):15. doi: 10.1186/s40478-018-0522-4. Acta Neuropathol Commun. 2018. PMID: 29475458 Free PMC article.
-
Histone deacetylase inhibitors induce FPGS mRNA expression and intracellular accumulation of long-chain methotrexate polyglutamates in childhood acute lymphoblastic leukemia: implications for combination therapy.Leukemia. 2010 Mar;24(3):552-62. doi: 10.1038/leu.2009.282. Epub 2010 Jan 14. Leukemia. 2010. PMID: 20072153
-
Cell-type-specific sensitivity of bortezomib in the methotrexate-resistant primary central nervous system lymphoma cells.Int J Clin Oncol. 2019 Sep;24(9):1020-1029. doi: 10.1007/s10147-019-01451-9. Epub 2019 Apr 16. Int J Clin Oncol. 2019. PMID: 30993483
-
Biochemical factors in the selectivity of leucovorin rescue: selective inhibition of leucovorin reactivation of dihydrofolate reductase and leucovorin utilization in purine and pyrimidine biosynthesis by methotrexate and dihydrofolate polyglutamates.NCI Monogr. 1987;(5):17-26. NCI Monogr. 1987. PMID: 2448654 Review.
-
Molecular mechanisms of resistance to antifolates, a review.Acta Biochim Pol. 1995;42(4):457-64. Acta Biochim Pol. 1995. PMID: 8852336 Review.
Cited by
-
Marine-Derived Secondary Metabolites as Promising Epigenetic Bio-Compounds for Anticancer Therapy.Mar Drugs. 2020 Dec 31;19(1):15. doi: 10.3390/md19010015. Mar Drugs. 2020. PMID: 33396307 Free PMC article. Review.
-
Relapsed Primary Central Nervous System Lymphoma: Current Advances.Front Oncol. 2021 Apr 29;11:649789. doi: 10.3389/fonc.2021.649789. eCollection 2021. Front Oncol. 2021. PMID: 33996566 Free PMC article. Review.
-
Current treatment strategies targeting histone deacetylase inhibitors in acute lymphocytic leukemia: a systematic review.Front Oncol. 2024 Feb 21;14:1324859. doi: 10.3389/fonc.2024.1324859. eCollection 2024. Front Oncol. 2024. PMID: 38450195 Free PMC article. Review.
-
Dual PI3K/HDAC Inhibitor BEBT-908 Exhibits Potent Efficacy as Monotherapy for Primary Central Nervous System Lymphoma.Target Oncol. 2023 Nov;18(6):941-952. doi: 10.1007/s11523-023-01006-z. Epub 2023 Oct 19. Target Oncol. 2023. PMID: 37855991
-
Histone Deacetylase (HDAC) Inhibitors as a Novel Therapeutic Option Against Fibrotic and Inflammatory Diseases.Biomolecules. 2024 Dec 15;14(12):1605. doi: 10.3390/biom14121605. Biomolecules. 2024. PMID: 39766311 Free PMC article. Review.
References
-
- Fukumura K, Kawazu M, Kojima S, et al. . Genomic characterization of primary central nervous system lymphoma. Acta Neuropathol. 2016;131(6):865–875. - PubMed
-
- Nakamura T, Yamashita S, Fukumura K, et al. . Genome-wide DNA methylation profiling identifies primary central nervous system lymphoma as a distinct entity different from systemic diffuse large B-cell lymphoma. Acta Neuropathol. 2017;133(2):321–324. - PubMed
-
- Korfel A, Schlegel U. Diagnosis and treatment of primary CNS lymphoma. Nat Rev Neurol. 2013;9(6):317–327. - PubMed
-
- Gabbai AA, Hochberg FH, Linggood RM, Bashir R, Hotleman K. High-dose methotrexate for non-AIDS primary central nervous system lymphoma. Report of 13 cases. J Neurosurg. 1989;70(2):190–194. - PubMed
-
- Hiraga S, Arita N, Ohnishi T, et al. . Rapid infusion of high-dose methotrexate resulting in enhanced penetration into cerebrospinal fluid and intensified tumor response in primary central nervous system lymphomas. J Neurosurg. 1999;91(2):221–230. - PubMed
LinkOut - more resources
Full Text Sources
Research Materials
Miscellaneous