. 2020 Jul;1(1):96-111.
doi: 10.1158/0008-5472.BCD-19-0041.

Mutational landscape and patterns of clonal evolution in relapsed pediatric acute lymphoblastic leukemia

Affiliations

Mutational landscape and patterns of clonal evolution in relapsed pediatric acute lymphoblastic leukemia

Esmé Waanders et al. Blood Cancer Discov. 2020 Jul.

Abstract

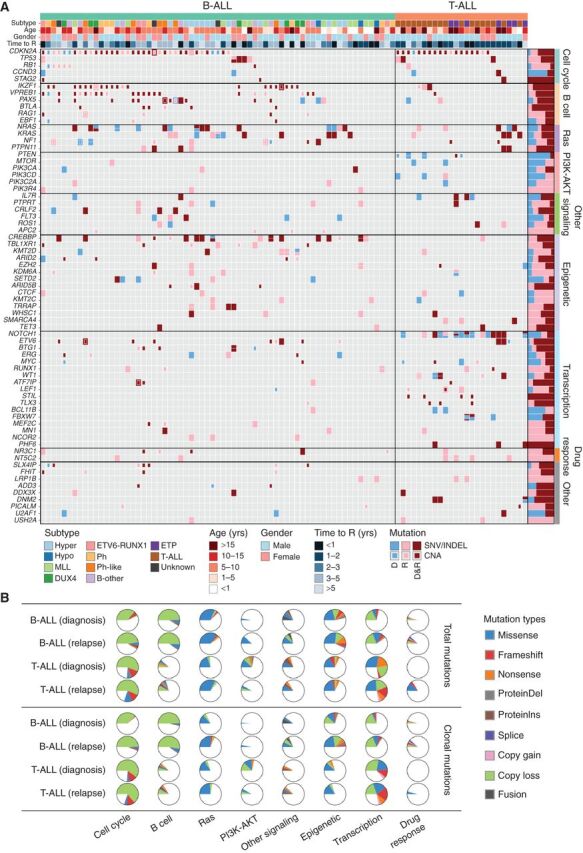
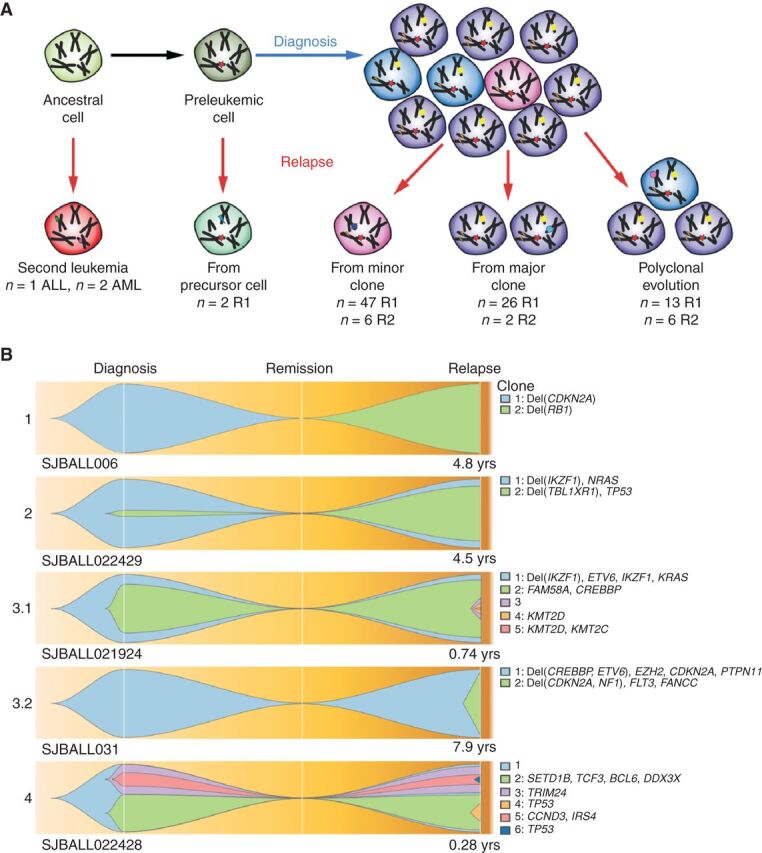
Relapse of acute lymphoblastic leukemia (ALL) remains a leading cause of childhood death. Prior studies have shown clonal mutations at relapse often arise from relapse-fated subclones that exist at diagnosis. However, the genomic landscape, evolutionary trajectories and mutational mechanisms driving relapse are incompletely understood. In an analysis of 92 cases of relapsed childhood ALL, incorporating multimodal DNA and RNA sequencing, deep digital mutational tracking and xenografting to formally define clonal structure, we identify 50 significant targets of mutation with distinct patterns of mutational acquisition or enrichment. CREBBP, NOTCH1, and Ras signaling mutations rose from diagnosis subclones, whereas variants in NCOR2, USH2A and NT5C2 were exclusively observed at relapse. Evolutionary modeling and xenografting demonstrated that relapse-fated clones were minor (50%), major (27%) or multiclonal (18%) at diagnosis. Putative second leukemias, including those with lineage shift, were shown to most commonly represent relapse from an ancestral clone rather than a truly independent second primary leukemia. A subset of leukemias prone to repeated relapse exhibited hypermutation driven by at least three distinct mutational processes, resulting in heightened neoepitope burden and potential vulnerability to immunotherapy. Finally, relapse-driving sequence mutations were detected prior to relapse using deep digital PCR at levels comparable to orthogonal approaches to monitor levels of measurable residual disease. These results provide a genomic framework to anticipate and circumvent relapse by earlier detection and targeting of relapse-fated clones.

Keywords: acute lymphoblastic leukemia; clonal evolution; genomics; hypermutation; neoepitopes; relapse.


Conflict of interest statement

Conflict of interest disclosure: Charles Mullighan: Commercial Research Grant (1. Entity: Abbvie; Relationship: self; Type: Major ($10,000 or more). 2. Entity: Loxo Oncology; Relationship: self; Type: Major ($10,000 or more). 3. Entity: Pfizer, Relationship: self; Type: Major ($10,000 or more)). Honoraria from Speakers Bureau (1. Entity: Amgen; Relationship: self; Type: Minor ($10,000 or less). 2. Pfizer; Relationship: self; Type: Minor ($10,000 or less). Scientific Advisory Board (Entity: Illumina; Relationship: self; Type: Minor ($10,000 or less)); Mary V. Relling, Commercial Research Grant (Entity: Servier Pharmaceuticals; Relationship: self; Type: Major ($10,000 or more)); Paul G. Thomas, Honoraria from Speakers Bureau (1. Entity: Illumina; Relationship: self; Type: Minor ($10,000 or less); 2. Entity: PACT Pharma; Relationship: Myself; Type: Minor ($10,000 or less)).

Figures

Figure 1. Somatic mutation spectrum in ALL at diagnosis and relapse. A, Nonsilent mutations in recurrently affected (≥3 cases) key genes (COSMIC Cancer Gene Census or reported leukemia relevant genes) in diagnosis (D) and first available relapse (R) sample per case. The B-ALL cases are grouped into well-defined disease subtypes, which include hyperdiploid (Hyper), hypodiploid (Hypo), KMT2A (MLL)-rearranged, DUX4-rearranged (DUX4), ETV6-RUNX1, BCR-ABL1 (Ph), Ph-like, and a group of other B-ALL subtypes including B-other, PAX5 P80R, and iAMP21 ALL. Mutations in the form of SNV/indels and focal CNAs are shown as rectangles with different sizes. Mutations observed only in D, only in R or shared by D and R are shown in blue, pink, and dark red colors, respectively. The prevalence for each gene mutation is shown in bar graph on the right. B, Distribution of recurrent mutations in key pathways. Top, all recurrent mutations; bottom, the clonal (MAF ≥ 30%) nonsilent mutations. Samples are divided into B-ALL (n = 67) and T-ALL (n = 25) and the mutation ratio in diagnosis and relapse stages is shown. Detailed mutation types are indicated by different colors.
Figure 1.
Somatic mutation spectrum in ALL at diagnosis and relapse. A, Nonsilent mutations in recurrently affected (≥3 cases) key genes (COSMIC Cancer Gene Census or reported leukemia relevant genes) in diagnosis (D) and first available relapse (R) sample per case. The B-ALL cases are grouped into well-defined disease subtypes, which include hyperdiploid (Hyper), hypodiploid (Hypo), KMT2A (MLL)-rearranged, DUX4-rearranged (DUX4), ETV6-RUNX1, BCR-ABL1 (Ph), Ph-like, and a group of other B-ALL subtypes including B-other, PAX5 P80R, and iAMP21 ALL. Mutations in the form of SNV/indels and focal CNAs are shown as rectangles with different sizes. Mutations observed only in D, only in R or shared by D and R are shown in blue, pink, and dark red colors, respectively. The prevalence for each gene mutation is shown in bar graph on the right. B, Distribution of recurrent mutations in key pathways. Top, all recurrent mutations; bottom, the clonal (MAF ≥ 30%) nonsilent mutations. Samples are divided into B-ALL (n = 67) and T-ALL (n = 25) and the mutation ratio in diagnosis and relapse stages is shown. Detailed mutation types are indicated by different colors.
Figure 2. Patterns of relapse in ALL. A, Schematic overview of mechanisms of clonal evolution. Three patients developed a second primary tumor that was not clonally related to the previous tumor occurrence. Two patients developed a tumor that shared only one founding fusion between diagnosis and relapse, indicating the disease relapsed from a preleukemic cell. Further relapses arose through evolution from a minor clone, a major clone, or multiple clones. B, Fish plots of the clonal evolution models inferred from somatic mutations detected in diagnosis and relapse samples. MAF of the somatic mutations was used by the sciClone R package (14) to infer potential clonal clusters (shown in different colors) and visualized by Fishplot (ref. 13; see Methods). Four major clonal evolution models were observed: 1, relapse sample is a second primary leukemia with no somatic mutations shared with diagnosis; 2, a minor clone (somatic mutations' median MAF of the clone is less than 30%) in diagnosis develops into the major clone in relapse; 3, a major clone (somatic mutations' median MAF of the clone is greater than 30%) is preserved from diagnosis to relapse (3.1) or emerges as a major clone at relapse (3.2); 4, multiple subclones in diagnosis develop as multiple subclones in relapse. For each exemplary case, the time from diagnosis to relapse is indicated. Focal deletions and nonsilent somatic mutations on cancer genes (according to the COSMIC Cancer Gene Census and well-known leukemia relevant genes) for each inferred clone are shown on the right side.
Figure 2.
Patterns of relapse in ALL. A, Schematic overview of mechanisms of clonal evolution. Three patients developed a second primary tumor that was not clonally related to the previous tumor occurrence. Two patients developed a tumor that shared only one founding fusion between diagnosis and relapse, indicating the disease relapsed from a preleukemic cell. Further relapses arose through evolution from a minor clone, a major clone, or multiple clones. B, Fish plots of the clonal evolution models inferred from somatic mutations detected in diagnosis and relapse samples. MAF of the somatic mutations was used by the sciClone R package (14) to infer potential clonal clusters (shown in different colors) and visualized by Fishplot (ref. ; see Methods). Four major clonal evolution models were observed: 1, relapse sample is a second primary leukemia with no somatic mutations shared with diagnosis; 2, a minor clone (somatic mutations' median MAF of the clone is less than 30%) in diagnosis develops into the major clone in relapse; 3, a major clone (somatic mutations' median MAF of the clone is greater than 30%) is preserved from diagnosis to relapse (3.1) or emerges as a major clone at relapse (3.2); 4, multiple subclones in diagnosis develop as multiple subclones in relapse. For each exemplary case, the time from diagnosis to relapse is indicated. Focal deletions and nonsilent somatic mutations on cancer genes (according to the COSMIC Cancer Gene Census and well-known leukemia relevant genes) for each inferred clone are shown on the right side.
Figure 3. CNAs and MEF2D-BLC9 rearrangements in patient SJBALL006. Signal intensity from Affymetrix SNP6.0 microarrays was normalized to log2 ratio (>0 indicate copy gain; <0 indicate copy loss) and shown in the University of California, Santa Cruz Genome Browser in large (A) and focal scale (B) to show the distinct alteration patterns between diagnosis and “relapse” (second diagnosis) samples. Constitutional copy number gains were observed in the germline sample. C, RNA-seq depth on exons of BCL9 gene. The sequencing depth was scaled from 0- to 270-fold for both diagnosis samples. The uptick of expression of exon 9 and 10 was observed for first and second diagnosis samples, respectively, indicating different rearrangement breakpoints on BCL9, which was consistent with fusions called from RNA-seq. The RNA-seq library for the first diagnosis sample was total RNA, so the intronic region was covered by sequencing reads. D, Schematic visualization of MEF2D-BCL9 chimeric protein structure. Two fusion isoforms have been reported as the most recurrent MEF2D-BCL9 rearrangements (30).
Figure 3.
CNAs and MEF2D-BLC9 rearrangements in patient SJBALL006. Signal intensity from Affymetrix SNP6.0 microarrays was normalized to log2 ratio (>0 indicate copy gain; <0 indicate copy loss) and shown in the University of California, Santa Cruz Genome Browser in large (A) and focal scale (B) to show the distinct alteration patterns between diagnosis and “relapse” (second diagnosis) samples. Constitutional copy number gains were observed in the germline sample. C, RNA-seq depth on exons of BCL9 gene. The sequencing depth was scaled from 0- to 270-fold for both diagnosis samples. The uptick of expression of exon 9 and 10 was observed for first and second diagnosis samples, respectively, indicating different rearrangement breakpoints on BCL9, which was consistent with fusions called from RNA-seq. The RNA-seq library for the first diagnosis sample was total RNA, so the intronic region was covered by sequencing reads. D, Schematic visualization of MEF2D-BCL9 chimeric protein structure. Two fusion isoforms have been reported as the most recurrent MEF2D-BCL9 rearrangements (30).
Figure 4. Integration of mutational landscape and xenografts resolves clonal structure in ALL. A, Somatic mutation spectrum of diagnosis (D), first relapse (R1), and xenografted leukemia samples. Leukemic cells from D (D.*.#) and R1 (R.*.#) from patient SJBALL036 were xenografted in mice and collected from bone marrow (*.BM.#), central nervous system (*.CNS.#), and spleen (*.SP.#). Cancer genes with nonsilent mutations are highlighted in red. FS, frameshift; NS, nonsense; SP, canonical splice site; proteinInDel, protein insertion/deletion. B, Delineation of clonal model from xenografted samples. MAF of SNV/indels were analyzed by sciClone (14) to infer clonal clusters. On the basis of the MAF in D and R1, clone 2.1 and 2.2 were indistinguishable. Xenograft data shows that clone 2.1 rises as a major clone (MAF = 0.5) in relapse alone or together with clone 2.2, indicating that 2.1 is the parental clone of 2.2. In addition, xenograft data showed variability in MAFs between clones 3 and 4, indicating that clones 3 and 4 were two distinct subclones. The clones are color-coded in the schema as in A. The number of somatic mutations in each clone is shown in parentheses. C, Fishplot of the leukemia evolution model. The top plot shows the original evolution model based on D and R1, and the bottom plot is the refined evolution model after incorporating the information from xenografted samples. The time (T) at diagnosis is defined as 0 and the first relapse was observed 4 years later. Nonsilent mutations and focal deletions (Del) affecting cancer genes are highlighted for each clone.
Figure 4.
Integration of mutational landscape and xenografts resolves clonal structure in ALL. A, Somatic mutation spectrum of diagnosis (D), first relapse (R1), and xenografted leukemia samples. Leukemic cells from D (D.*.#) and R1 (R.*.#) from patient SJBALL036 were xenografted in mice and collected from bone marrow (*.BM.#), central nervous system (*.CNS.#), and spleen (*.SP.#). Cancer genes with nonsilent mutations are highlighted in red. FS, frameshift; NS, nonsense; SP, canonical splice site; proteinInDel, protein insertion/deletion. B, Delineation of clonal model from xenografted samples. MAF of SNV/indels were analyzed by sciClone (14) to infer clonal clusters. On the basis of the MAF in D and R1, clone 2.1 and 2.2 were indistinguishable. Xenograft data shows that clone 2.1 rises as a major clone (MAF = 0.5) in relapse alone or together with clone 2.2, indicating that 2.1 is the parental clone of 2.2. In addition, xenograft data showed variability in MAFs between clones 3 and 4, indicating that clones 3 and 4 were two distinct subclones. The clones are color-coded in the schema as in A. The number of somatic mutations in each clone is shown in parentheses. C, Fishplot of the leukemia evolution model. The top plot shows the original evolution model based on D and R1, and the bottom plot is the refined evolution model after incorporating the information from xenografted samples. The time (T) at diagnosis is defined as 0 and the first relapse was observed 4 years later. Nonsilent mutations and focal deletions (Del) affecting cancer genes are highlighted for each clone.
Figure 5. ddPCR reveals mutations at low levels in intermediate complete remission samples. MAF of the indicated variants was determined in bone marrow (circle) and peripheral blood (triangle) samples for 5 patients. The time to diagnosis is scaled on the x-axis, with the treatment blocks indicated in black (induction), red (consolidation), blue (maintenance), and orange (relapse treatment). SJBALL192, SJHYPER127, and SJTALL001 relapsed during maintenance treatment. Detection limits are indicated with a red horizontal line and shaded background. Detection limits in gray were extrapolated from the other assays (i.e., not experimentally determined). The MAF at relapse of WHSC1 in SJHYPER127 was determined in our capture validation analysis as no DNA was available for ddPCR. The y-axis is in logarithmic scale.
Figure 5.
ddPCR reveals mutations at low levels in intermediate complete remission samples. MAF of the indicated variants was determined in bone marrow (circle) and peripheral blood (triangle) samples for 5 patients. The time to diagnosis is scaled on the x-axis, with the treatment blocks indicated in black (induction), red (consolidation), blue (maintenance), and orange (relapse treatment). SJBALL192, SJHYPER127, and SJTALL001 relapsed during maintenance treatment. Detection limits are indicated with a red horizontal line and shaded background. Detection limits in gray were extrapolated from the other assays (i.e., not experimentally determined). The MAF at relapse of WHSC1 in SJHYPER127 was determined in our capture validation analysis as no DNA was available for ddPCR. The y-axis is in logarithmic scale.
Figure 6. Mutational signature analysis of hypermutated relapses identifies multiple distinct mutational processes in hypermutation. A, Four mutational signatures identified in hypermutated ALL. Relative contribution of the different mutation types in their trinucleotide context, and cosine similarity values to reported COSMIC signatures are shown. B, Cosine similarity heatmap showing the hierarchical clustering of de novo signatures identified in this study with 30 known SBS signatures, including those associated with AID/APOBEC (orange bar), spontaneous deamination of meC (red bar), and mismatch repair (blue bar). C, Absolute contribution of each of the four signatures to the acquired mutations in 17 hypermutated relapse samples from 13 patients. Samples are grouped on the basis of the most prominent contributing signature. D, Average number and size of acquired indels in samples assigned to each group (top) and the number of repetitive subunits surrounding an inserted or deleted subunit (bottom). A value of 0 indicates that the indel is not located within a simple repeat. E, Total number of mutations (acquired and preserved) assigned with >95% confidence to signature A in the tumors of SJETV010, binned based on the mutation allele frequency (MAF). F, Density of C>T transitions in CpGs inside and outside gene bodies of two hypermutated relapses (SJETV010R2 and SJHYPER022R1) with high contribution of signature A mutations (top and middle) and healthy colon organoids with high contribution of SBS1 mutations (average of 3 organoids; bottom). G, Bar plots showing number of C>T transitions in CpGs on the transcribed and nontranscribed strand in relation to gene expression (top) and density of C>T transition in CpGs (bottom) in genes with no, low (<median) and high (≥median) expression (*, P < 0.05).
Figure 6.
Mutational signature analysis of hypermutated relapses identifies multiple distinct mutational processes in hypermutation. A, Four mutational signatures identified in hypermutated ALL. Relative contribution of the different mutation types in their trinucleotide context, and cosine similarity values to reported COSMIC signatures are shown. B, Cosine similarity heatmap showing the hierarchical clustering of de novo signatures identified in this study with 30 known SBS signatures, including those associated with AID/APOBEC (orange bar), spontaneous deamination of meC (red bar), and mismatch repair (blue bar). C, Absolute contribution of each of the four signatures to the acquired mutations in 17 hypermutated relapse samples from 13 patients. Samples are grouped on the basis of the most prominent contributing signature. D, Average number and size of acquired indels in samples assigned to each group (top) and the number of repetitive subunits surrounding an inserted or deleted subunit (bottom). A value of 0 indicates that the indel is not located within a simple repeat. E, Total number of mutations (acquired and preserved) assigned with >95% confidence to signature A in the tumors of SJETV010, binned based on the mutation allele frequency (MAF). F, Density of C>T transitions in CpGs inside and outside gene bodies of two hypermutated relapses (SJETV010R2 and SJHYPER022R1) with high contribution of signature A mutations (top and middle) and healthy colon organoids with high contribution of SBS1 mutations (average of 3 organoids; bottom). G, Bar plots showing number of C>T transitions in CpGs on the transcribed and nontranscribed strand in relation to gene expression (top) and density of C>T transition in CpGs (bottom) in genes with no, low (<median) and high (≥median) expression (*, P < 0.05).

Comment in

References

    1. Hunger SP, Mullighan CG. Acute lymphoblastic leukemia in children. N Engl J Med 2015;373:1541–52. - PubMed
    1. Nguyen K, Devidas M, Cheng SC, La M, Raetz EA, Carroll WL, et al. Factors influencing survival after relapse from acute lymphoblastic leukemia: a Children's Oncology Group study. Leukemia 2008;22:2142–50. - PMC - PubMed
    1. Iacobucci I, Mullighan CG. Genetic basis of acute lymphoblastic leukemia. J Clin Oncol 2017;35:975–83. - PMC - PubMed
    1. Ma X, Edmonson M, Yergeau D, Muzny DM, Hampton OA, Rusch M, et al. Rise and fall of subclones from diagnosis to relapse in pediatric B-acute lymphoblastic leukaemia. Nat Commun 2015;6:6604. - PMC - PubMed
    1. Schwartzman O, Savino AM, Gombert M, Palmi C, Cario G, Schrappe M, et al. Suppressors and activators of JAK-STAT signaling at diagnosis and relapse of acute lymphoblastic leukemia in Down syndrome. Proc Natl Acad Sci U S A 2017;114:E4030–9. - PMC - PubMed

Publication types