[Preprint]. 2020 Aug 3:2020.08.03.235242.
doi: 10.1101/2020.08.03.235242.

Robotic High-Throughput Biomanufacturing and Functional Differentiation of Human Pluripotent Stem Cells

Affiliations

Robotic High-Throughput Biomanufacturing and Functional Differentiation of Human Pluripotent Stem Cells

Carlos A Tristan et al. bioRxiv. .

Update in

Abstract

Efficient translation of human induced pluripotent stem cells (hiPSCs) depends on implementing scalable cell manufacturing strategies that ensure optimal self-renewal and functional differentiation. Currently, manual culture of hiPSCs is highly variable and labor-intensive posing significant challenges for high-throughput applications. Here, we established a robotic platform and automated all essential steps of hiPSC culture and differentiation under chemically defined conditions. This streamlined approach allowed rapid and standardized manufacturing of billions of hiPSCs that can be produced in parallel from up to 90 different patient-and disease-specific cell lines. Moreover, we established automated multi-lineage differentiation to generate primary embryonic germ layers and more mature phenotypes such as neurons, cardiomyocytes, and hepatocytes. To validate our approach, we carefully compared robotic and manual cell culture and performed molecular and functional cell characterizations (e.g. bulk culture and single-cell transcriptomics, mass cytometry, metabolism, electrophysiology, Zika virus experiments) in order to benchmark industrial-scale cell culture operations towards building an integrated platform for efficient cell manufacturing for disease modeling, drug screening, and cell therapy. Combining stem cell-based models and non-stop robotic cell culture may become a powerful strategy to increase scientific rigor and productivity, which are particularly important during public health emergencies (e.g. opioid crisis, COVID-19 pandemic).


Conflict of interest statement

COMPETING INTERESTS

The authors declare no competing interests.

Figures

Figure 1:
Figure 1:. Overview of the Automated CompacT SelecT System
Photomontage depicting the various features and components of CTST including flask incubator, plate incubator, storage of large volumes of media, cell counting, viability analysis, microscopic imaging, and a sterile HEPA-filtered cabinet housing a robotic arm, pipettes, and a chilling unit.
Figure 2:
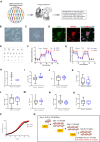
Figure 2:. Characterization of hiPSCs Cultured by CTST
(A) Automated cell culture used has several characteristics and advantages as summarized in the boxed area. (B) Representative overview of pluripotent cells growing in densely packed colonies (magnification, 5x). (C) Colony with hiPSCs showing the typical morphological features of human pluripotent cells (magnification, 20x). (D) Immunocytochemistry showing that the vast majority of cells express pluripotency-associated markers OCT4 and NANOG (magnification, 5x). (E) Long-term culture of hiPSCs and maintenance of normal karyotypes. (F) Agilent Seahorse XF Glycolysis Stress Test profile shows the extracellular acidification rate (ECAR) representing key parameters of glycolytic function in hESCs and hiPSCs maintained by CSTS. Serial injections of metabolic modulators (glucose, oligomycin, 2-deoxyglucose [2-DG]) were performed at indicated time points. (G) The Agilent Seahorse XF Mitochondrial Stress Test profile shows the oxygen consumption rate (OCR) representing key parameters of mitochondrial function in hESCs and hiPSCs maintained by CSTS. Serial injections of metabolic modulators (oligomycin, FCCP and Rotenone/Antimycin A (Ret/AA)) were performed at indicated time points. (H) Comparison of media change intervals during automated and manual cell culture. (I-O) The supernatant of cultures maintained either manually or robotically was analyzed by using the Vi-Cell MetaFLEX Bioanalyte Analyzer (Beckman). Box plots show the variation of fresh and spent media. See also Figure S3. (P) Confluency measurement allows precise monitoring of cell growth and image-based passaging at defined timepoints. (Q) Automated cell expansion strategy showing that massive cell numbers can be produced in only 12 days. The CEPT cocktail was used at every passage for 24 h to optimize cell viability.
Figure 3:
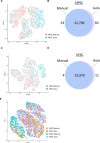
Figure 3:. Single-Cell RNA-seq and Comparison of Manual and Automated Cell Culture
(A) t-SNA plot illustrating that hiPSCs maintained either manually or robotically show a high degree of transcriptomic similarity. (B) Venn diagram showing the overlap of expressed genes. (C) Cultures with hESCs maintained either manually or robotically show a high degree of transcriptomic similarity. (D) Venn diagram showing the overlap of expressed genes. (E) Direct comparison of hiPSCs and hESCs cultured under four different conditions.
Figure 4:
Figure 4:. Mass Cytometry of hiPSCs and hESCs and Comparison of Manual and Automated Cell Culture
(A) UMAP plots showing subpopulations of cells within each group organized into 8 clusters identified by FlowSOM and ConsensusClusterPlus algorithms. Cluster 6 was prominent in hiPSCs (LiPSC-GR1.1) when cultured manually and its representation was mitigated by automated culture. Core pluripotency markers OCT4, NANOG, and SOX2 were expressed at similar levels across clusters. However, surface antigen CD24 was expressed at a considerably higher level in cluster 6 in hiPSCs cultured manually (red arrow). (B) Heatmaps comparing protein expression levels for each analyzed marker in individual clusters and the abundance of the clusters within the hiPSC populations (LiPSC-GR1.1) cultured manually or by automation. While manual culture led to a large proportion of CD24-negative cells (66%), only a small fraction of cells lacked CD24 expression (11%) during automated cell culture. (C) Heatmaps of protein expression levels and cluster abundances in hESCs (WA09) after manual and automated cell culture. The abundance of the major cluster 3 was similar in both culture conditions and CD24-negative cluster 6 was represented at a negligible level.
Figure 5:
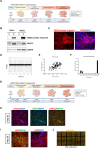
Figure 5:. Controlled Multi-Lineage Differentiation of hPSCs by CTST
(A) Western blot analysis of cultures before (OCT4) and after differentiation into ectoderm (PAX6), mesoderm (Brachyury), and endoderm (SOX17). Tubulin was used as a loading control. (B) Immunocytochemical analysis of cultures differentiated by CTST (magnification, 20x). (C) Single-cell analysis (RNA-seq) of pluripotent and differentiated cultures. (D) Heatmap showing the highly expressed genes for pluripotent and differentiated cultures. (E) Direct comparison of undifferentiated and differentiated hESCs and hiPSCs show that gene expression signatures are highly similar.
Figure 6:
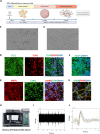
Figure 6:. Robotic Scalable Neuronal Differentiation
(A) Overview of neuronal differentiation strategy compatible with automation. (B) Phase-contrast image showing a typical neuronal culture (day 30; magnification 20x). (C) Neuronal cells develop highly dense network of neurites upon further maturation (day 50; magnification 40x). (D) Immunocytochemical analysis showing cortical neurons expressing TUJ1 and CUX1 (magnification, 20x). (E) Immunocytochemical analysis demonstrating the presence of cortical neurons expressing MAP2 and CTIP2 (magnification, 20x). (F) Majority of cells express vGLUT1, a marker for excitatory neurons (magnification, 20x). (G) Example of neuronal cells showing immunoreactivity for the inhibitory neurotransmitter GABA (magnification, 63x) (H) Robotic MEA platform used for high-throughput electrophysiology and functional cell characterization. (I) Spontaneous activity of hiPSC-derived neurons after 6 weeks of differentiation as measured by MEA. (J) Overlay plot of 10 spikes detected from one channel of a representative MEA recording to demonstrate similarity between spikes detected.
Figure 7:
Figure 7:. Characterization of Cardiomyocytes and Hepatocytes Derived by Automated Cell Culture
(A) Overview of automated cardiomyocyte differentiation protocol. (B) Western blot experiment showing efficient induction of cardiac troponin and transcription factor NKX2.5 in undifferentiated (abbreviated as U) and differentiated (abbreviated as D) hESCs and hiPSCs. GAPDH was used as a loading control. (C) Immunocytochemical analysis of cardiomyocytes expressing cardiac troponin (magnification, 20x). (D) MEA field potential recording of spontaneous cardiac activity at day 14 post differentiation. (E) Poincaré plot demonstrating minimal beat-to-beat variance. (F) Field potential duration distribution. (G) Overview of automated stepwise hepatocyte differentiation (H) Immunocytochemistry at day 10 shows that large numbers of cells express the appropriate transcription factors such as FOXA2 and HNF4A (magnification, 20x). (I) By day 20, differentiated cells express alpha-fetoprotein (AFP) and HNF4A (magnification, 20x). (J) Immunostaining showing that iPSC-derived hepatocytes robotically differentiated in a 384-well plate express albumin. Representative example and overview of 18 whole wells containing hepatocytes (magnification, 5x).

References

    1. Aijaz A., Li M., Smith D., Khong D., Leblon C., Fenton O.S., Olabisi R.M., Libutti S., Tischfield J., Maus M. V., et al. (2018). Biomanufacturing for clinically advanced cell therapies. Nat. Biomed. Eng. 2, 362–376. - PMC - PubMed
    1. Archibald P.R.T., Chandra A., Thomas D., Chose O., Massouridès E., Laâbi Y., and Williams D.J. (2016). Comparability of automated human induced pluripotent stem cell culture: a pilot study. Bioprocess Biosyst. Eng. 39, 1847–1858. - PMC - PubMed
    1. Baer A., and Kehn-Hall K. (2014). Viral concentration determination through plaque assays: Using traditional and novel overlay systems. J. Vis. Exp. 1–10. - PMC - PubMed
    1. Barbaric I., Biga V., Gokhale P.J., Jones M., Stavish D., Glen A., Coca D., and Andrews P.W. (2014). Time-lapse analysis of human embryonic stem cells reveals multiple bottlenecks restricting colony formation and their relief upon culture adaptation. Stem Cell Reports 3, 142–155. - PMC - PubMed
    1. Cahan P., and Daley G.Q. (2013). Origins and implications of pluripotent stem cell variability and heterogeneity. - PMC - PubMed

Publication types