[Preprint]. 2020 Sep 17:2020.07.31.20165647.
doi: 10.1101/2020.07.31.20165647.

Magnitude and Dynamics of the T-Cell Response to SARS-CoV-2 Infection at Both Individual and Population Levels

Affiliations

Magnitude and Dynamics of the T-Cell Response to SARS-CoV-2 Infection at Both Individual and Population Levels

Thomas M Snyder et al. medRxiv. .

Update in

  • Magnitude and dynamics of the T-cell response to SARS-CoV-2 infection at both individual and population levels.
    Snyder TM, Gittelman RM, Klinger M, May DH, Osborne EJ, Taniguchi R, Jabran Zahid H, Kaplan IM, Dines JN, Noakes MT, Pandya R, Chen X, Elasady S, Svejnoha E, Ebert P, Pesesky MW, De Almeida P, O'Donnell H, DeGottardi Q, Keitany G, Lu J, Vong A, Elyanow R, Fields P, Al-Asadi H, Greissl J, Baldo L, Semprini S, Cerchione C, Nicolini F, Mazza M, Delmonte OM, Dobbs K, Laguna-Goya R, Carreño-Tarragona G, Barrio S, Imberti L, Sottini A, Quiros-Roldan E, Rossi C, Biondi A, Bettini LR, D'Angio M, Bonfanti P, Tompkins MF, Alba C, Dalgard C, Sambri V, Martinelli G, Goldman JD, Heath JR, Su HC, Notarangelo LD, Paz-Artal E, Martinez-Lopez J, Howie B, Carlson JM, Robins HS. Snyder TM, et al. Front Immunol. 2025 Jan 7;15:1488860. doi: 10.3389/fimmu.2024.1488860. eCollection 2024. Front Immunol. 2025. PMID: 39840037 Free PMC article.

Abstract

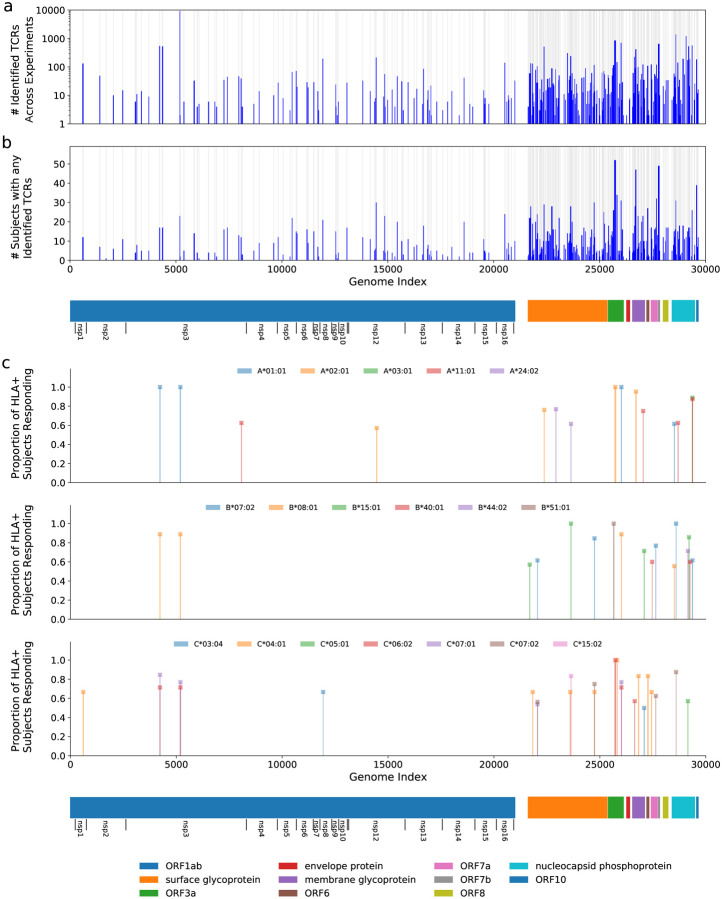
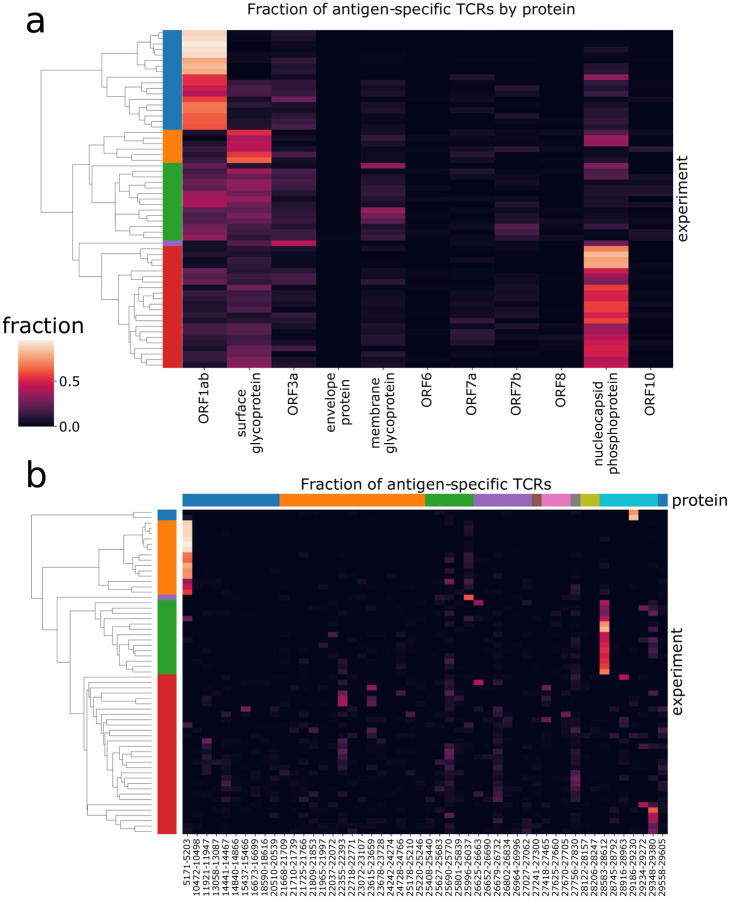
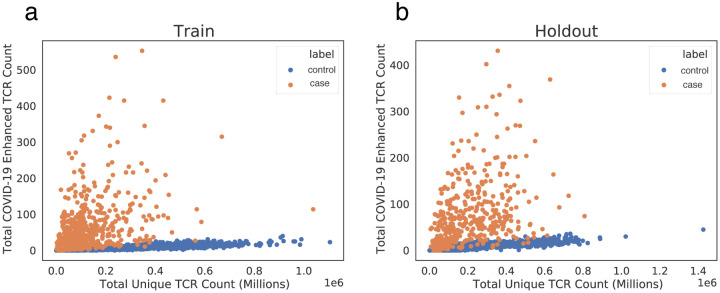
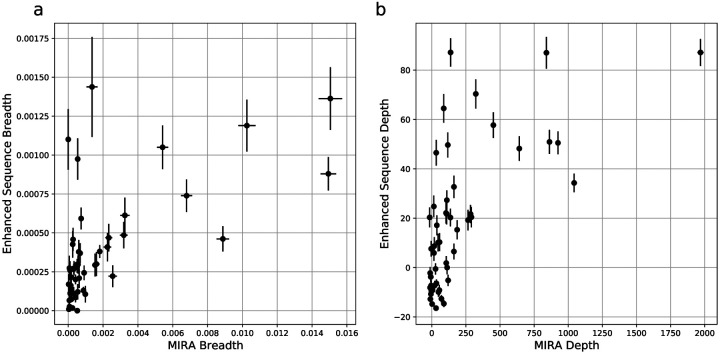
T cells are involved in the early identification and clearance of viral infections and also support the development of antibodies by B cells. This central role for T cells makes them a desirable target for assessing the immune response to SARS-CoV-2 infection. Here, we combined two high-throughput immune profiling methods to create a quantitative picture of the T-cell response to SARS-CoV-2. First, at the individual level, we deeply characterized 3 acutely infected and 58 recovered COVID-19 subjects by experimentally mapping their CD8 T-cell response through antigen stimulation to 545 Human Leukocyte Antigen (HLA) class I presented viral peptides (class II data in a forthcoming study). Then, at the population level, we performed T-cell repertoire sequencing on 1,815 samples (from 1,521 COVID-19 subjects) as well as 3,500 controls to identify shared "public" T-cell receptors (TCRs) associated with SARS-CoV-2 infection from both CD8 and CD4 T cells. Collectively, our data reveal that CD8 T-cell responses are often driven by a few immunodominant, HLA-restricted epitopes. As expected, the T-cell response to SARS-CoV-2 peaks about one to two weeks after infection and is detectable for at least several months after recovery. As an application of these data, we trained a classifier to diagnose SARS-CoV-2 infection based solely on TCR sequencing from blood samples, and observed, at 99.8% specificity, high early sensitivity soon after diagnosis (Day 3-7 = 85.1% [95% CI = 79.9-89.7]; Day 8-14 = 94.8% [90.7-98.4]) as well as lasting sensitivity after recovery (Day 29+/convalescent = 95.4% [92.1-98.3]). These results demonstrate an approach to reliably assess the adaptive immune response both soon after viral antigenic exposure (before antibodies are typically detectable) as well as at later time points. This blood-based molecular approach to characterizing the cellular immune response has applications in clinical diagnostics as well as in vaccine development and monitoring.


Figures

Figure 1:
Figure 1:. Magnitude and immunodominance of T-cell response to hundreds of potential SARS-CoV-2 antigens.
Panel (a) shows the count of identified TCRs across experiments at each antigen position in the viral genome, and Panel (b) shows a similar representation for the count of subjects that had at least 1 TCR identified in the data at that antigen position. The blue bars represent these counts while the gray background indicates the areas covered by the tested antigens. Panel (c) shows the proportion of individuals with a given HLA that respond to a given antigen, restricting to immunodominant antigens. For this figure, we define response to mean a MIRA experiment using a subject who expresses the given HLA and for which the number of identified TCRs are more than 2-fold higher than the median number observed for experiments with donors who do not express the HLA. Only HLAs that are observed in at least ≥5 donors are considered, and only HLA-antigen pairs with at least 50% response rates and significant median-fold enrichment are shown. Note that no correction was made for HLA linkage disequilibrium. Detailed data and significance tests are available in Table S2. The eleven open reading frames from the virus are indicated below the plots including extra notation for the sixteen nonstructural proteins (nsp) encoded by ORF1ab.
Figure 2:
Figure 2:. Patterns of antigen-TCR reactivity reveal immunodominance of some antigens.
These two panels show clustergram plots of the (a) protein-level and (b) antigen-level signals across subjects. Each of the rows in the plot represents a distinct subject from the MIRA experiments; the left side label shows coloration for the top five subject clusters. In panel (a), the columns represent the 11 viral proteins in viral genome order. In panel (b), the columns represent the 50 antigens having the most donors with 1 or more TCRs reacting to them. They are sorted in viral genome order and colored by protein at the top. (Note that clustering is done independently for each panel to show the five farthest-separated clusters, and subject sets will vary by color across panels.)
Figure 3:
Figure 3:. Public enhanced sequences associated with SARS-CoV-2 infection distinguish cases from controls.
Panels (a) and (b) show the number of TCRβ DNA sequences in a subject that encode a SARS-CoV-2 enhanced sequence versus the total number of unique TCRβ DNA sequences sampled from that subject for a large number of cases and controls. Panel (a) represents the training set to identify this initial enhanced sequences list (DLS and NIH/NIAID cohorts), and panel (b) represents a hold-out set with no overlap with the training set (ISB, H12O and BWNW cohorts). Both panels show a similar number and separation of enhanced sequences in cases versus controls.
Figure 4:
Figure 4:. Clonal breadth and depth of the SARS-CoV-2 specific T-cell response can be estimated from MIRA-based profiling and from public enhanced sequences.
Panel (a) is focused on breadth and shows a scatterplot of the relative fraction of the unique TCRβ DNA sequences in the repertoire that are assigned as MIRA or enhanced sequence TCRs. Panel (b) is focused on depth and shows a scatterplot of the summed logarithm of productive template counts across all SARS-CoV-2 associated clones from the two approaches, normalized by subtracting the logarithm of total template counts across all clones. In both panels, error bars on x and y represent the standard deviation.
Figure 5:
Figure 5:. Breadth and depth of the immune response during SARS-CoV-2 infection and after recovery.
Panels (a) and (b) represent, by time from diagnosis by a viral RT-PCR test, the clonal breadth (relative number of enhanced sequences observed) (a) and depth (a measure of frequency based on the summed logarithm of productive template counts normalized by subtracting the logarithm of total template counts) (b).

References

    1. Ahmed SF, Quadeer AA, McKay MR. 2020. Viruses 12(3):254 Preliminary Identification of Potential Vaccine Targets for the COVID-19 Coronavirus (SARS-CoV-2) Based on SARS-CoV Immunological Studies. - PMC - PubMed
    1. Altmann DM and Boyton RJ. 2020. Sci. Immunol. 10.1126/sciimmunol.abd6160 SARS-CoV-2 T cell immunity: Specificity, function, durability, and role in protection. - DOI - PubMed
    1. Andreatta M, Nielsen M. 2016. Bioinformatics 32(4);511–7. Gapped sequence alignment using artificial neural networks: application to the MHC class I system. - PMC - PubMed
    1. Cao X. 2020. Nature Reviews Immunology 20:269–270. COVID-19: immunopathology and its implications for therapy. - PMC - PubMed
    1. Carlson CS, Emerson RO, Sherwood AM, Desmarais C, Chung M, Parsons JM, Steen MS, LaMadrid-Herrmannsfeldt MA, Williamson D, Livingston RJ, Wu E, Wood BL, Rieder MJ, Robins HS. 2013. Nature Communications 4:2680 Using synthetic templates to design an unbiased multiplex PCR assay. - PubMed

Publication types