. 2020 Oct 20;142(16):1545-1561.
doi: 10.1161/CIRCULATIONAHA.120.045750. Epub 2020 Aug 14.

A Notch3-Marked Subpopulation of Vascular Smooth Muscle Cells Is the Cell of Origin for Occlusive Pulmonary Vascular Lesions

Affiliations

A Notch3-Marked Subpopulation of Vascular Smooth Muscle Cells Is the Cell of Origin for Occlusive Pulmonary Vascular Lesions

Lea C Steffes et al. Circulation. .

Abstract

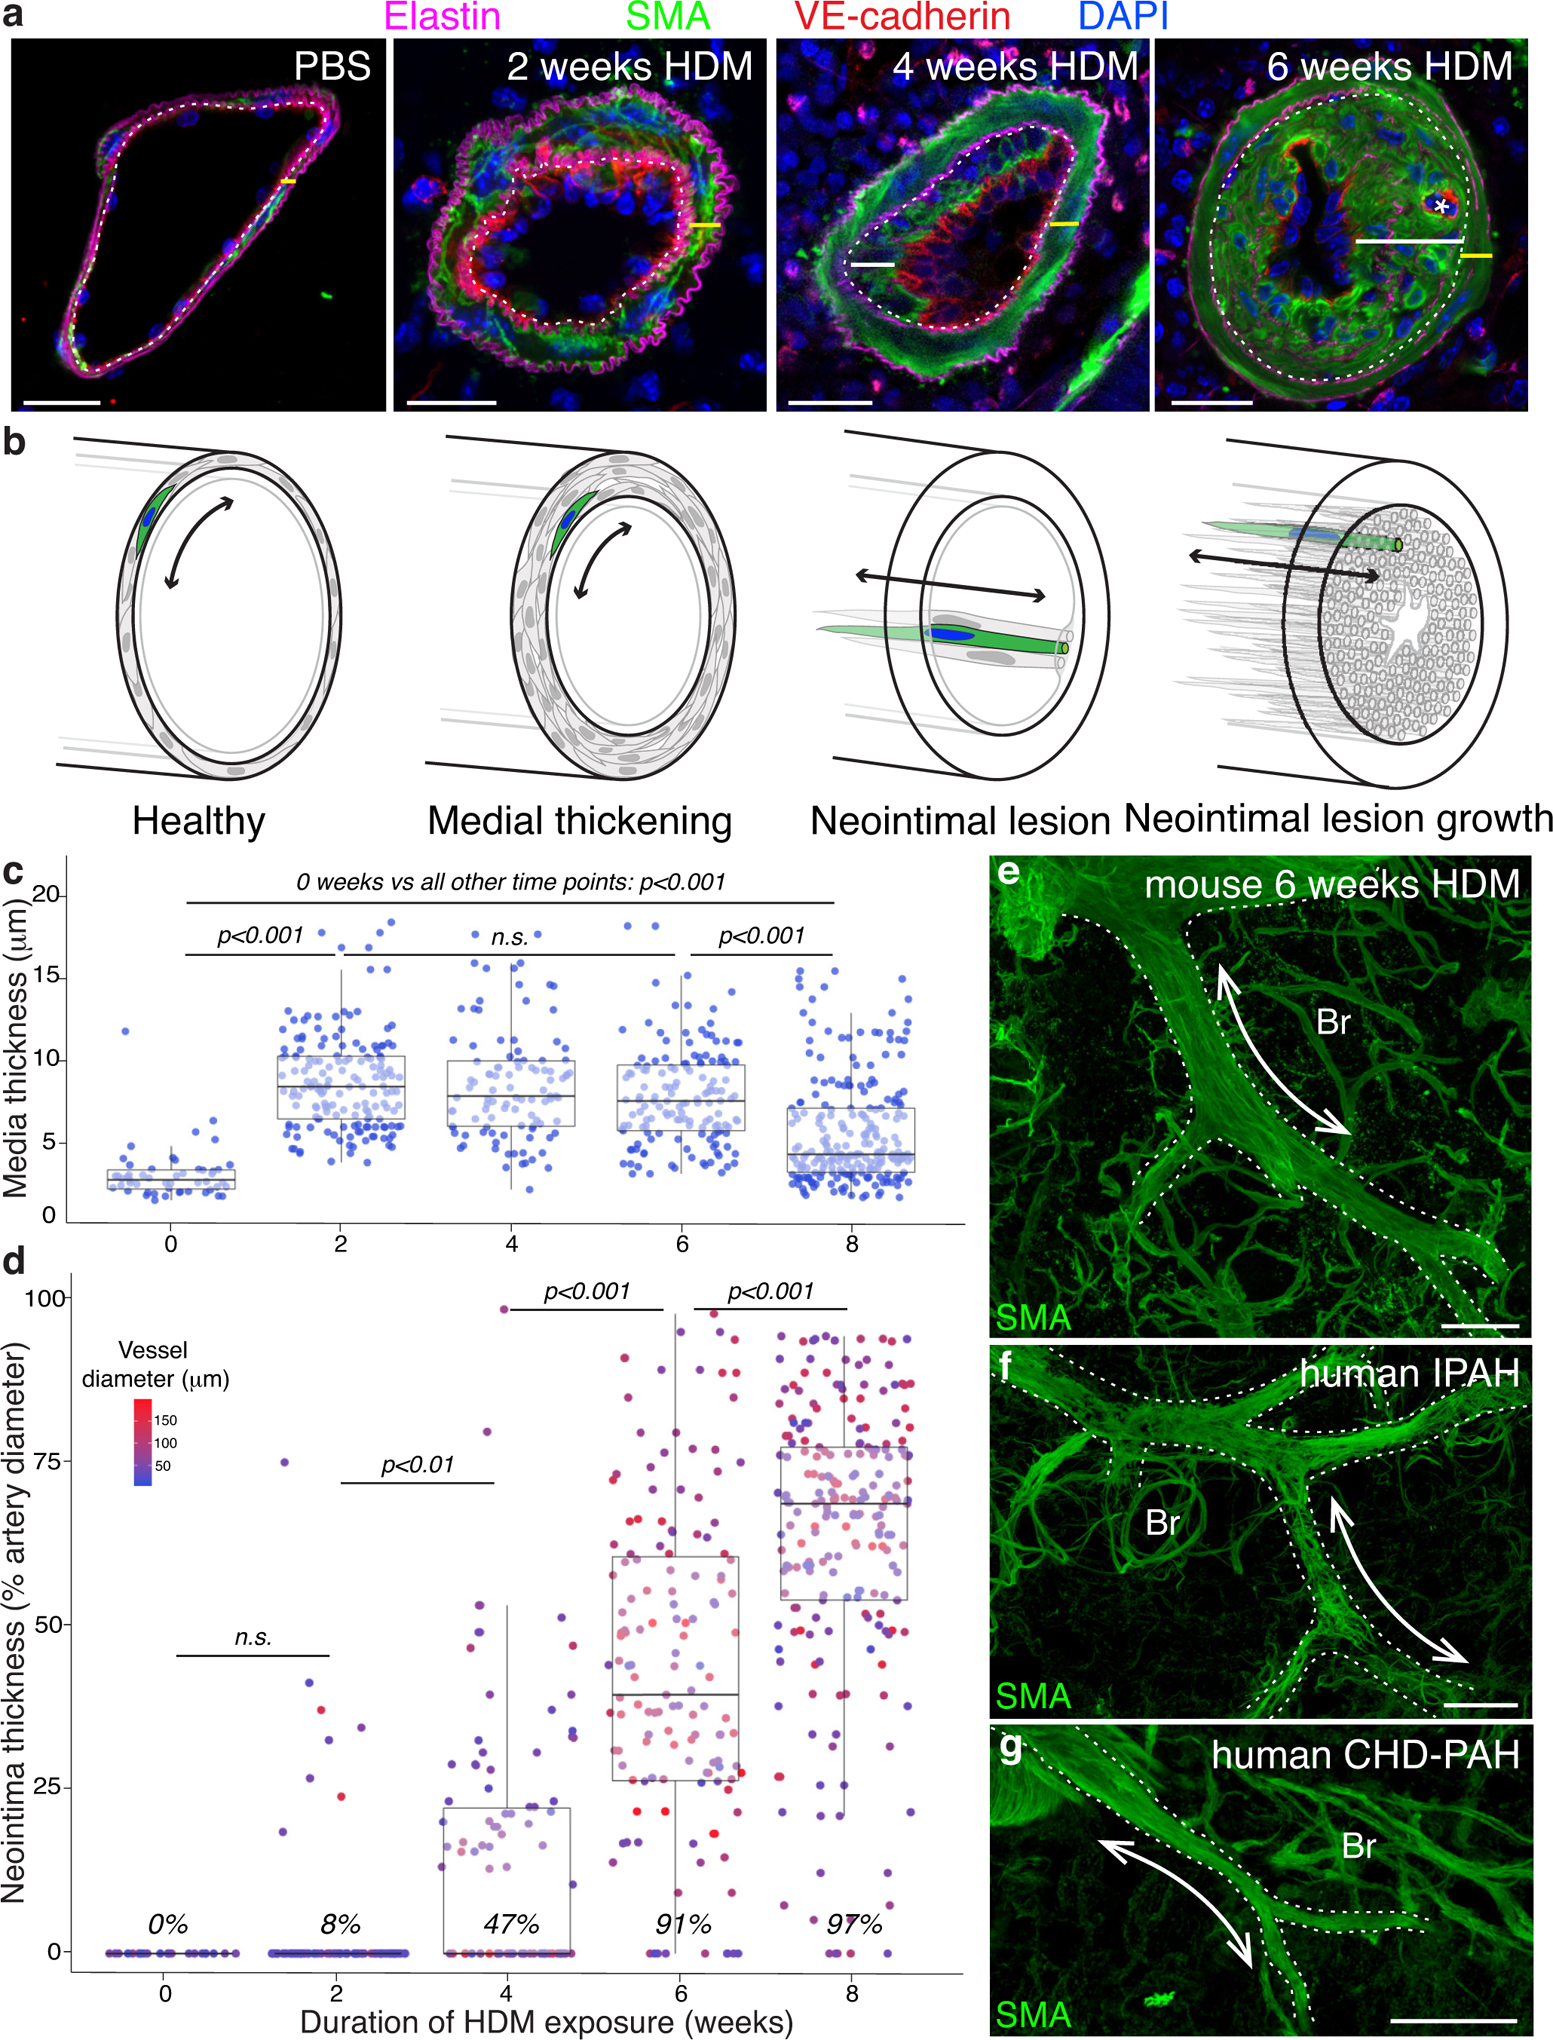
Background: Pulmonary arterial hypertension (PAH) is a fatal disease characterized by profound vascular remodeling in which pulmonary arteries narrow because of medial thickening and occlusion by neointimal lesions, resulting in elevated pulmonary vascular resistance and right heart failure. Therapies targeting the neointima would represent a significant advance in PAH treatment; however, our understanding of the cellular events driving neointima formation, and the molecular pathways that control them, remains limited.

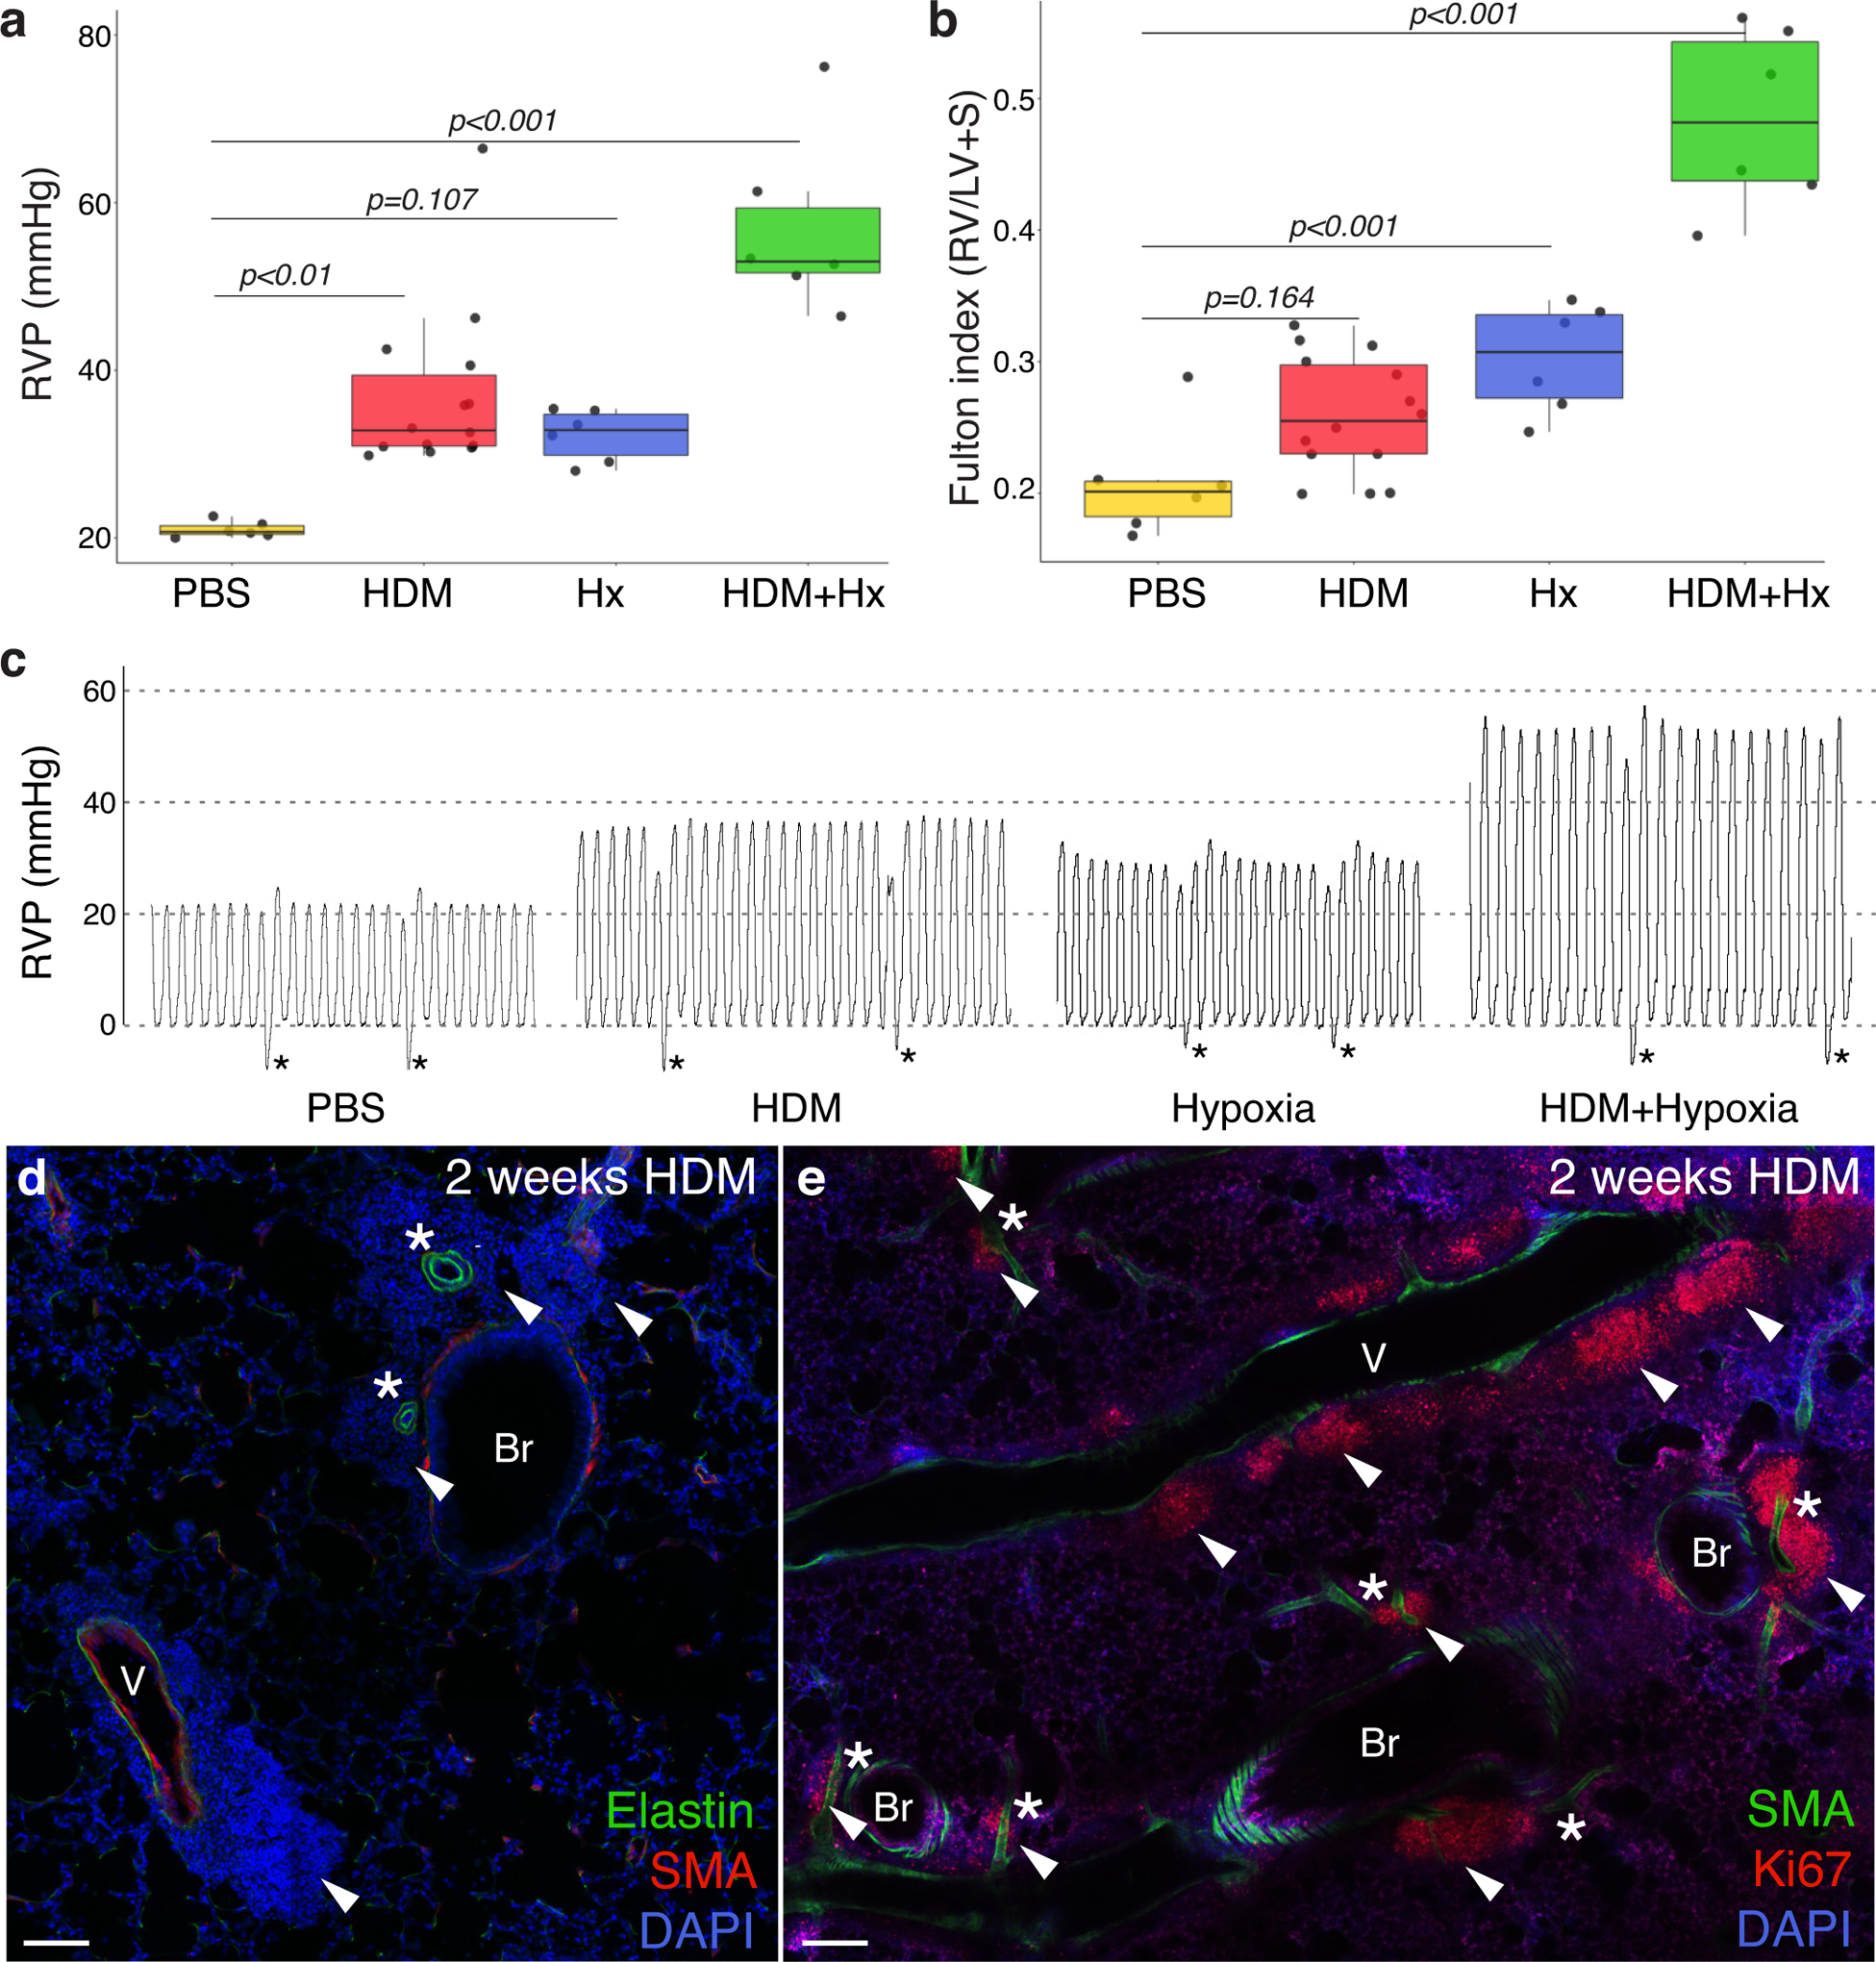
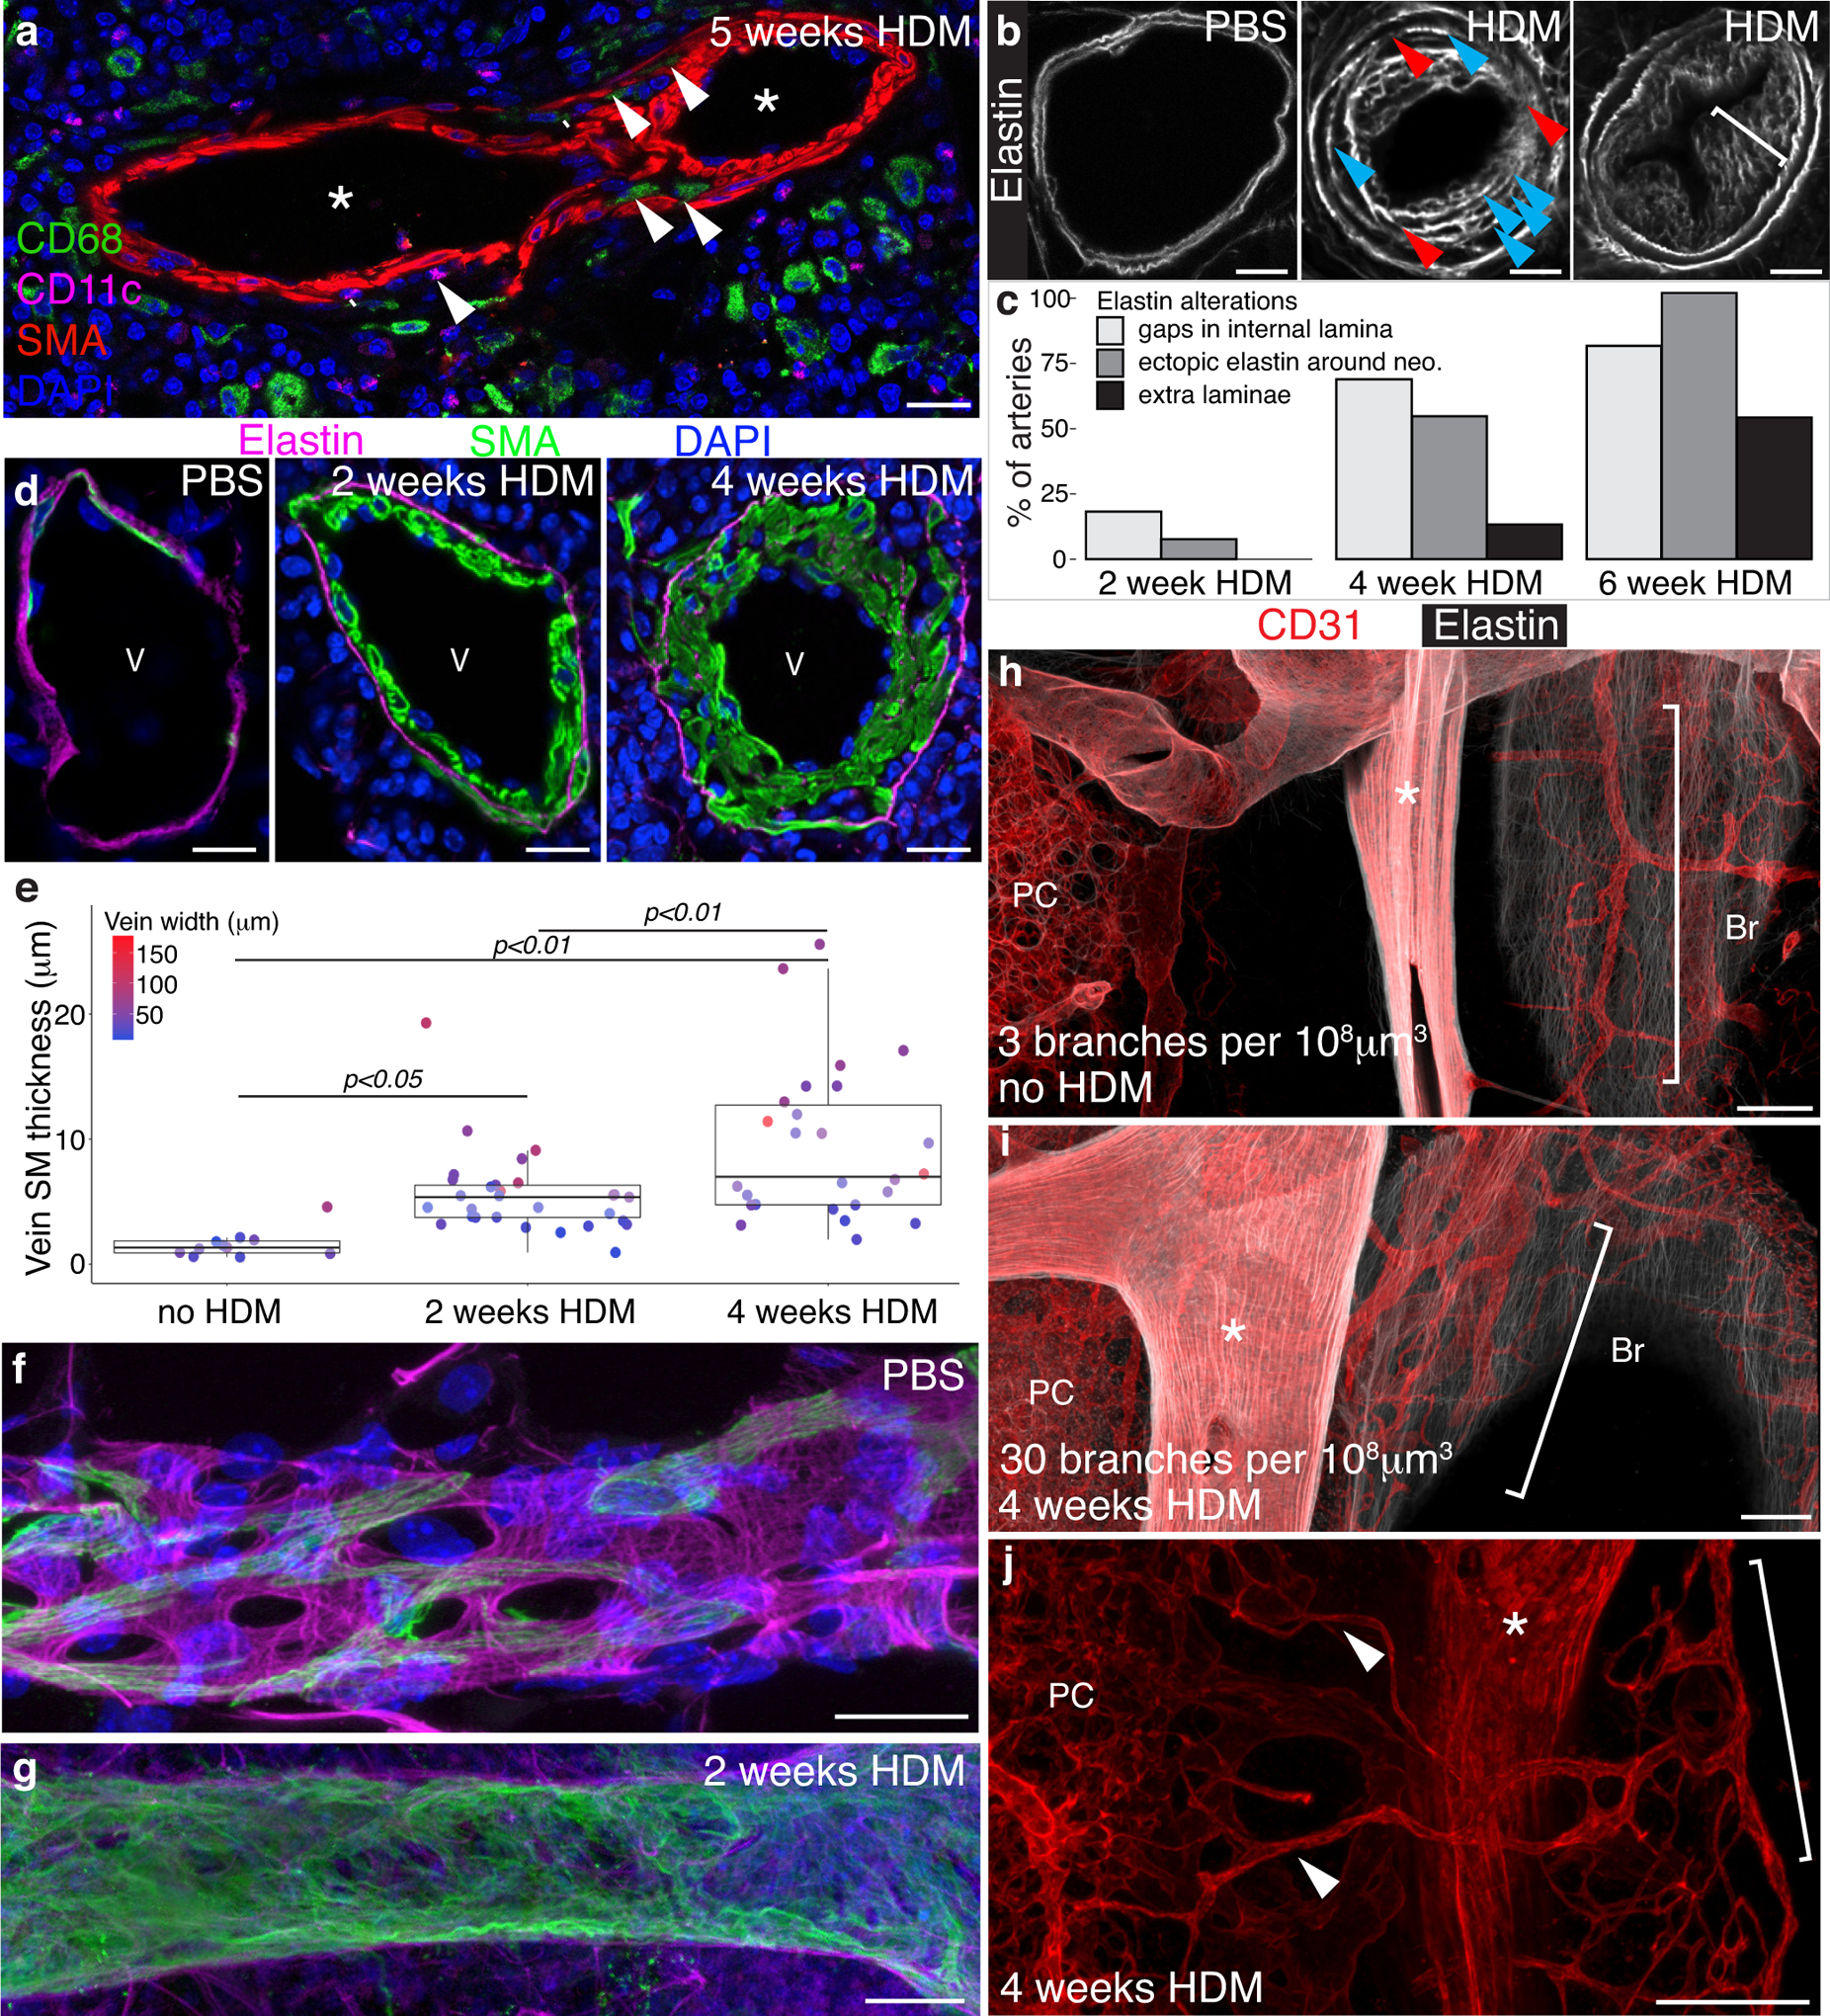
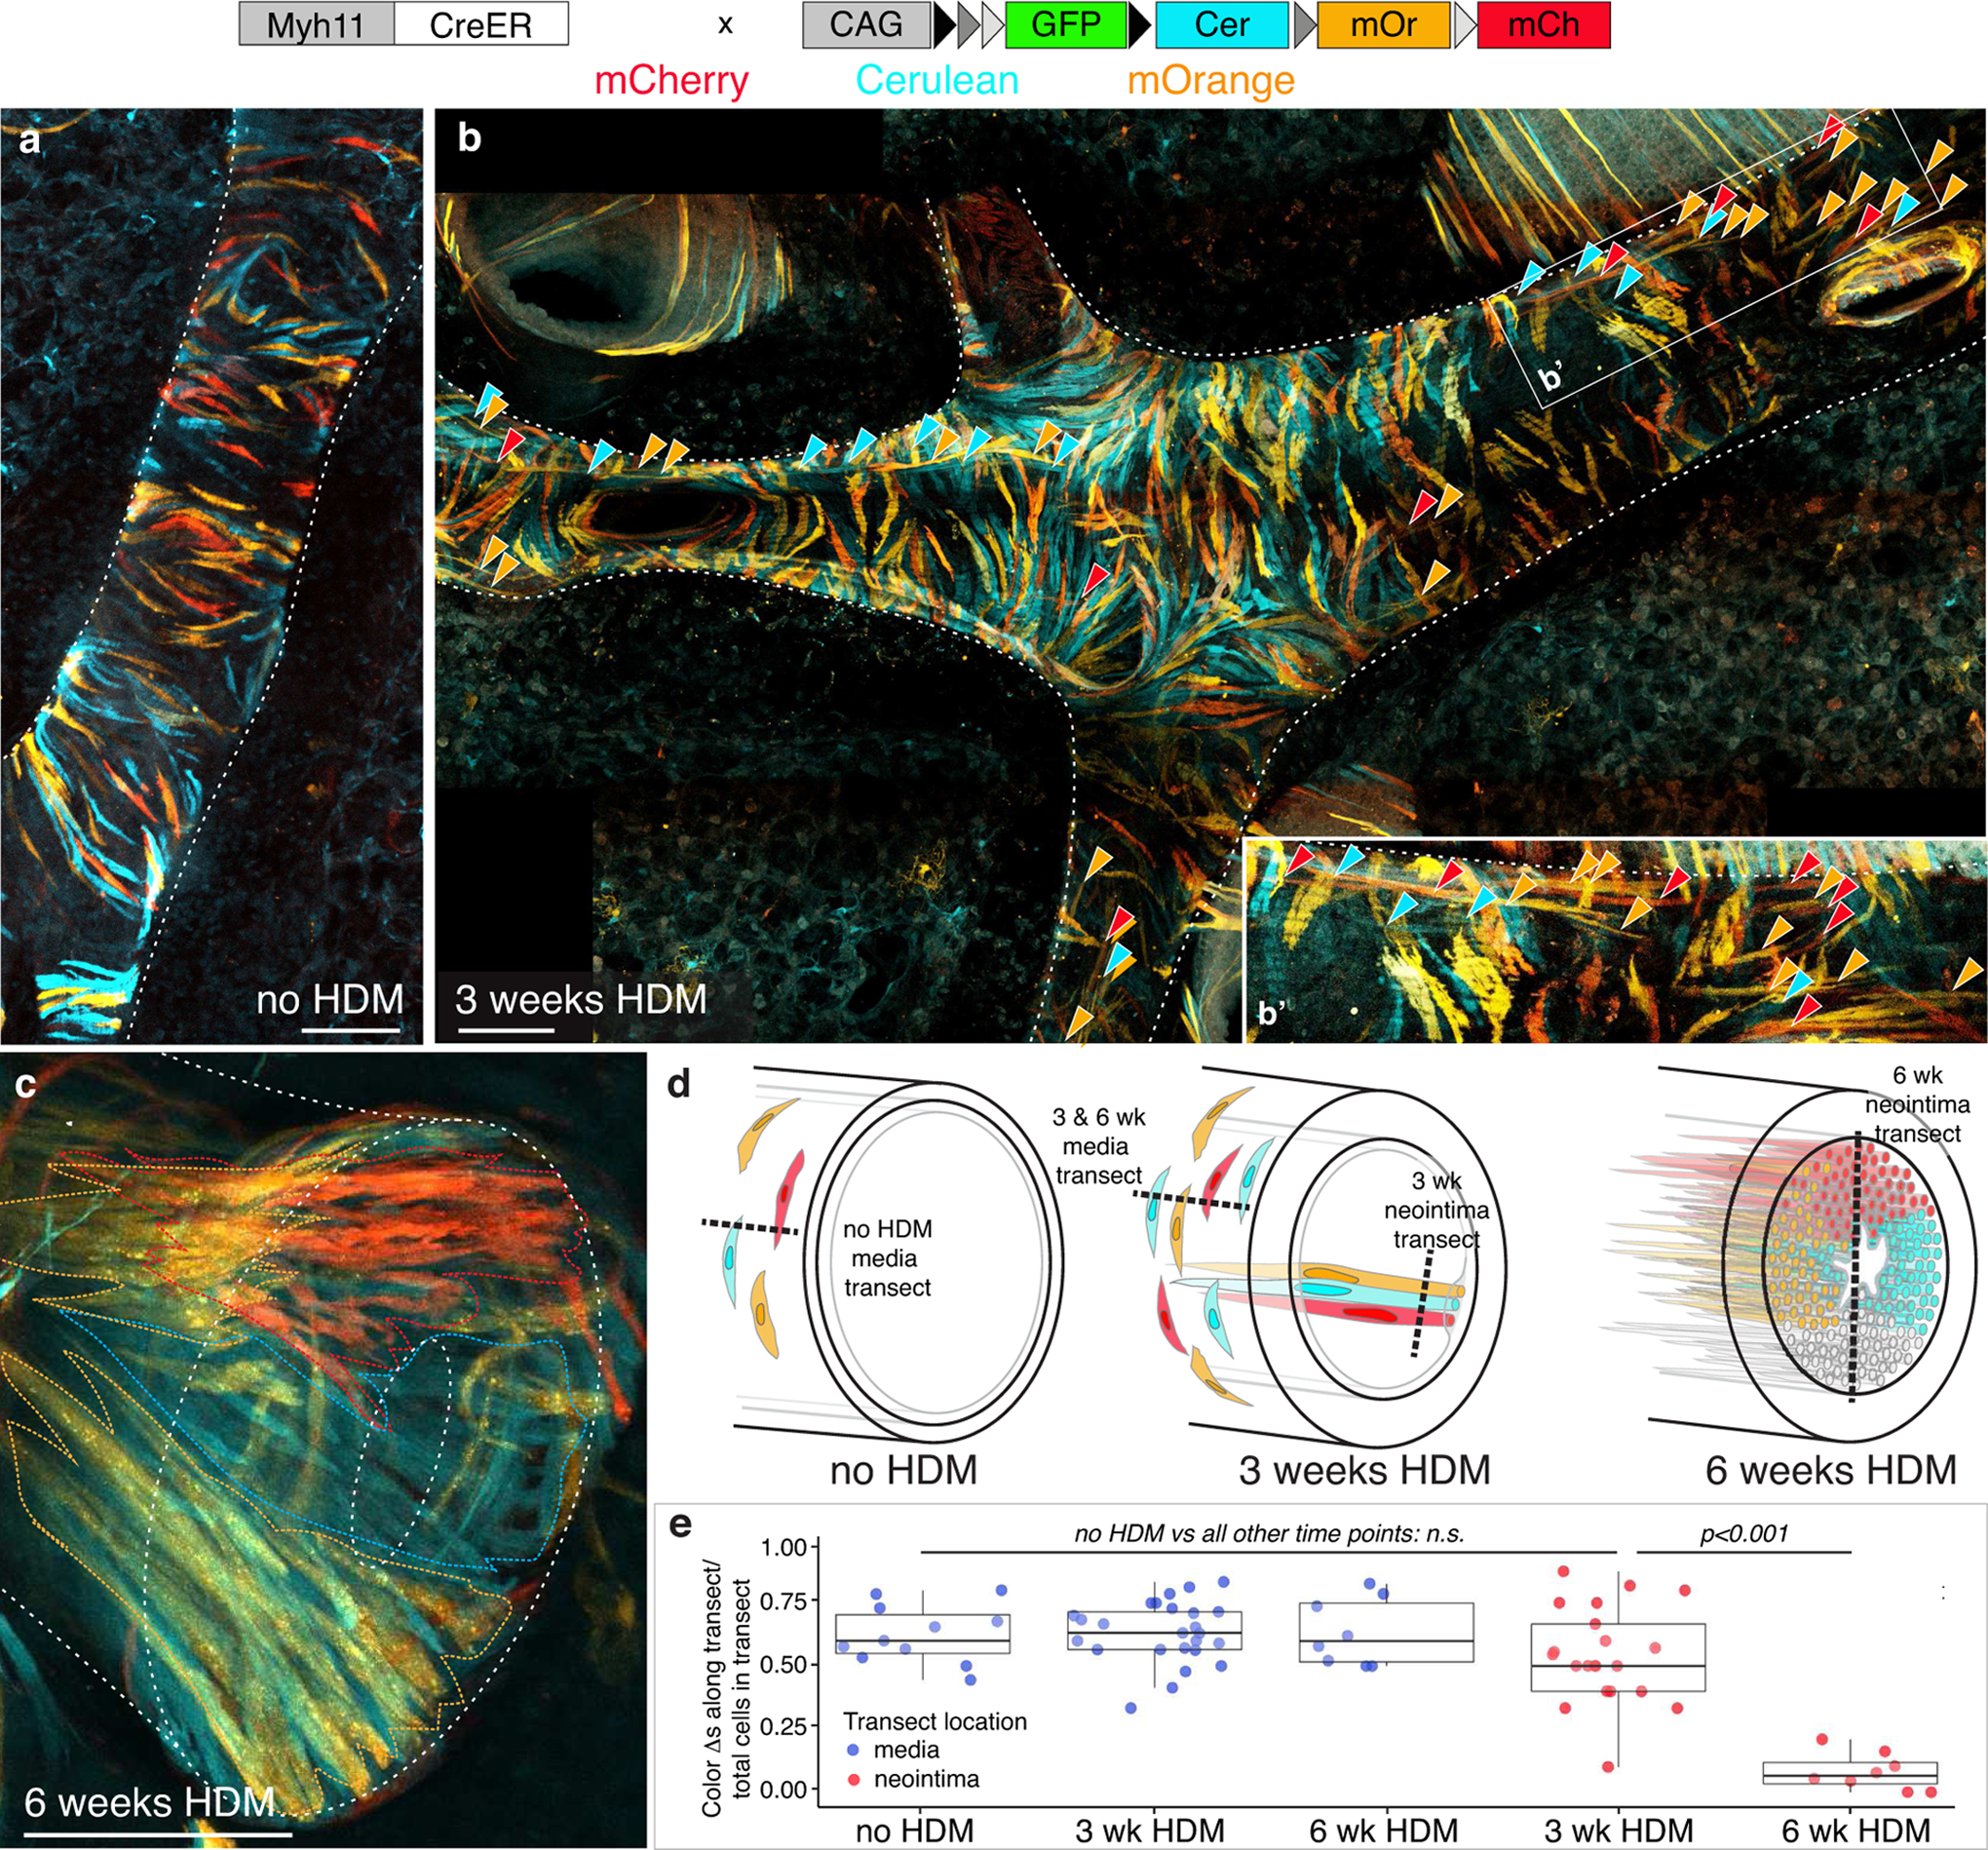
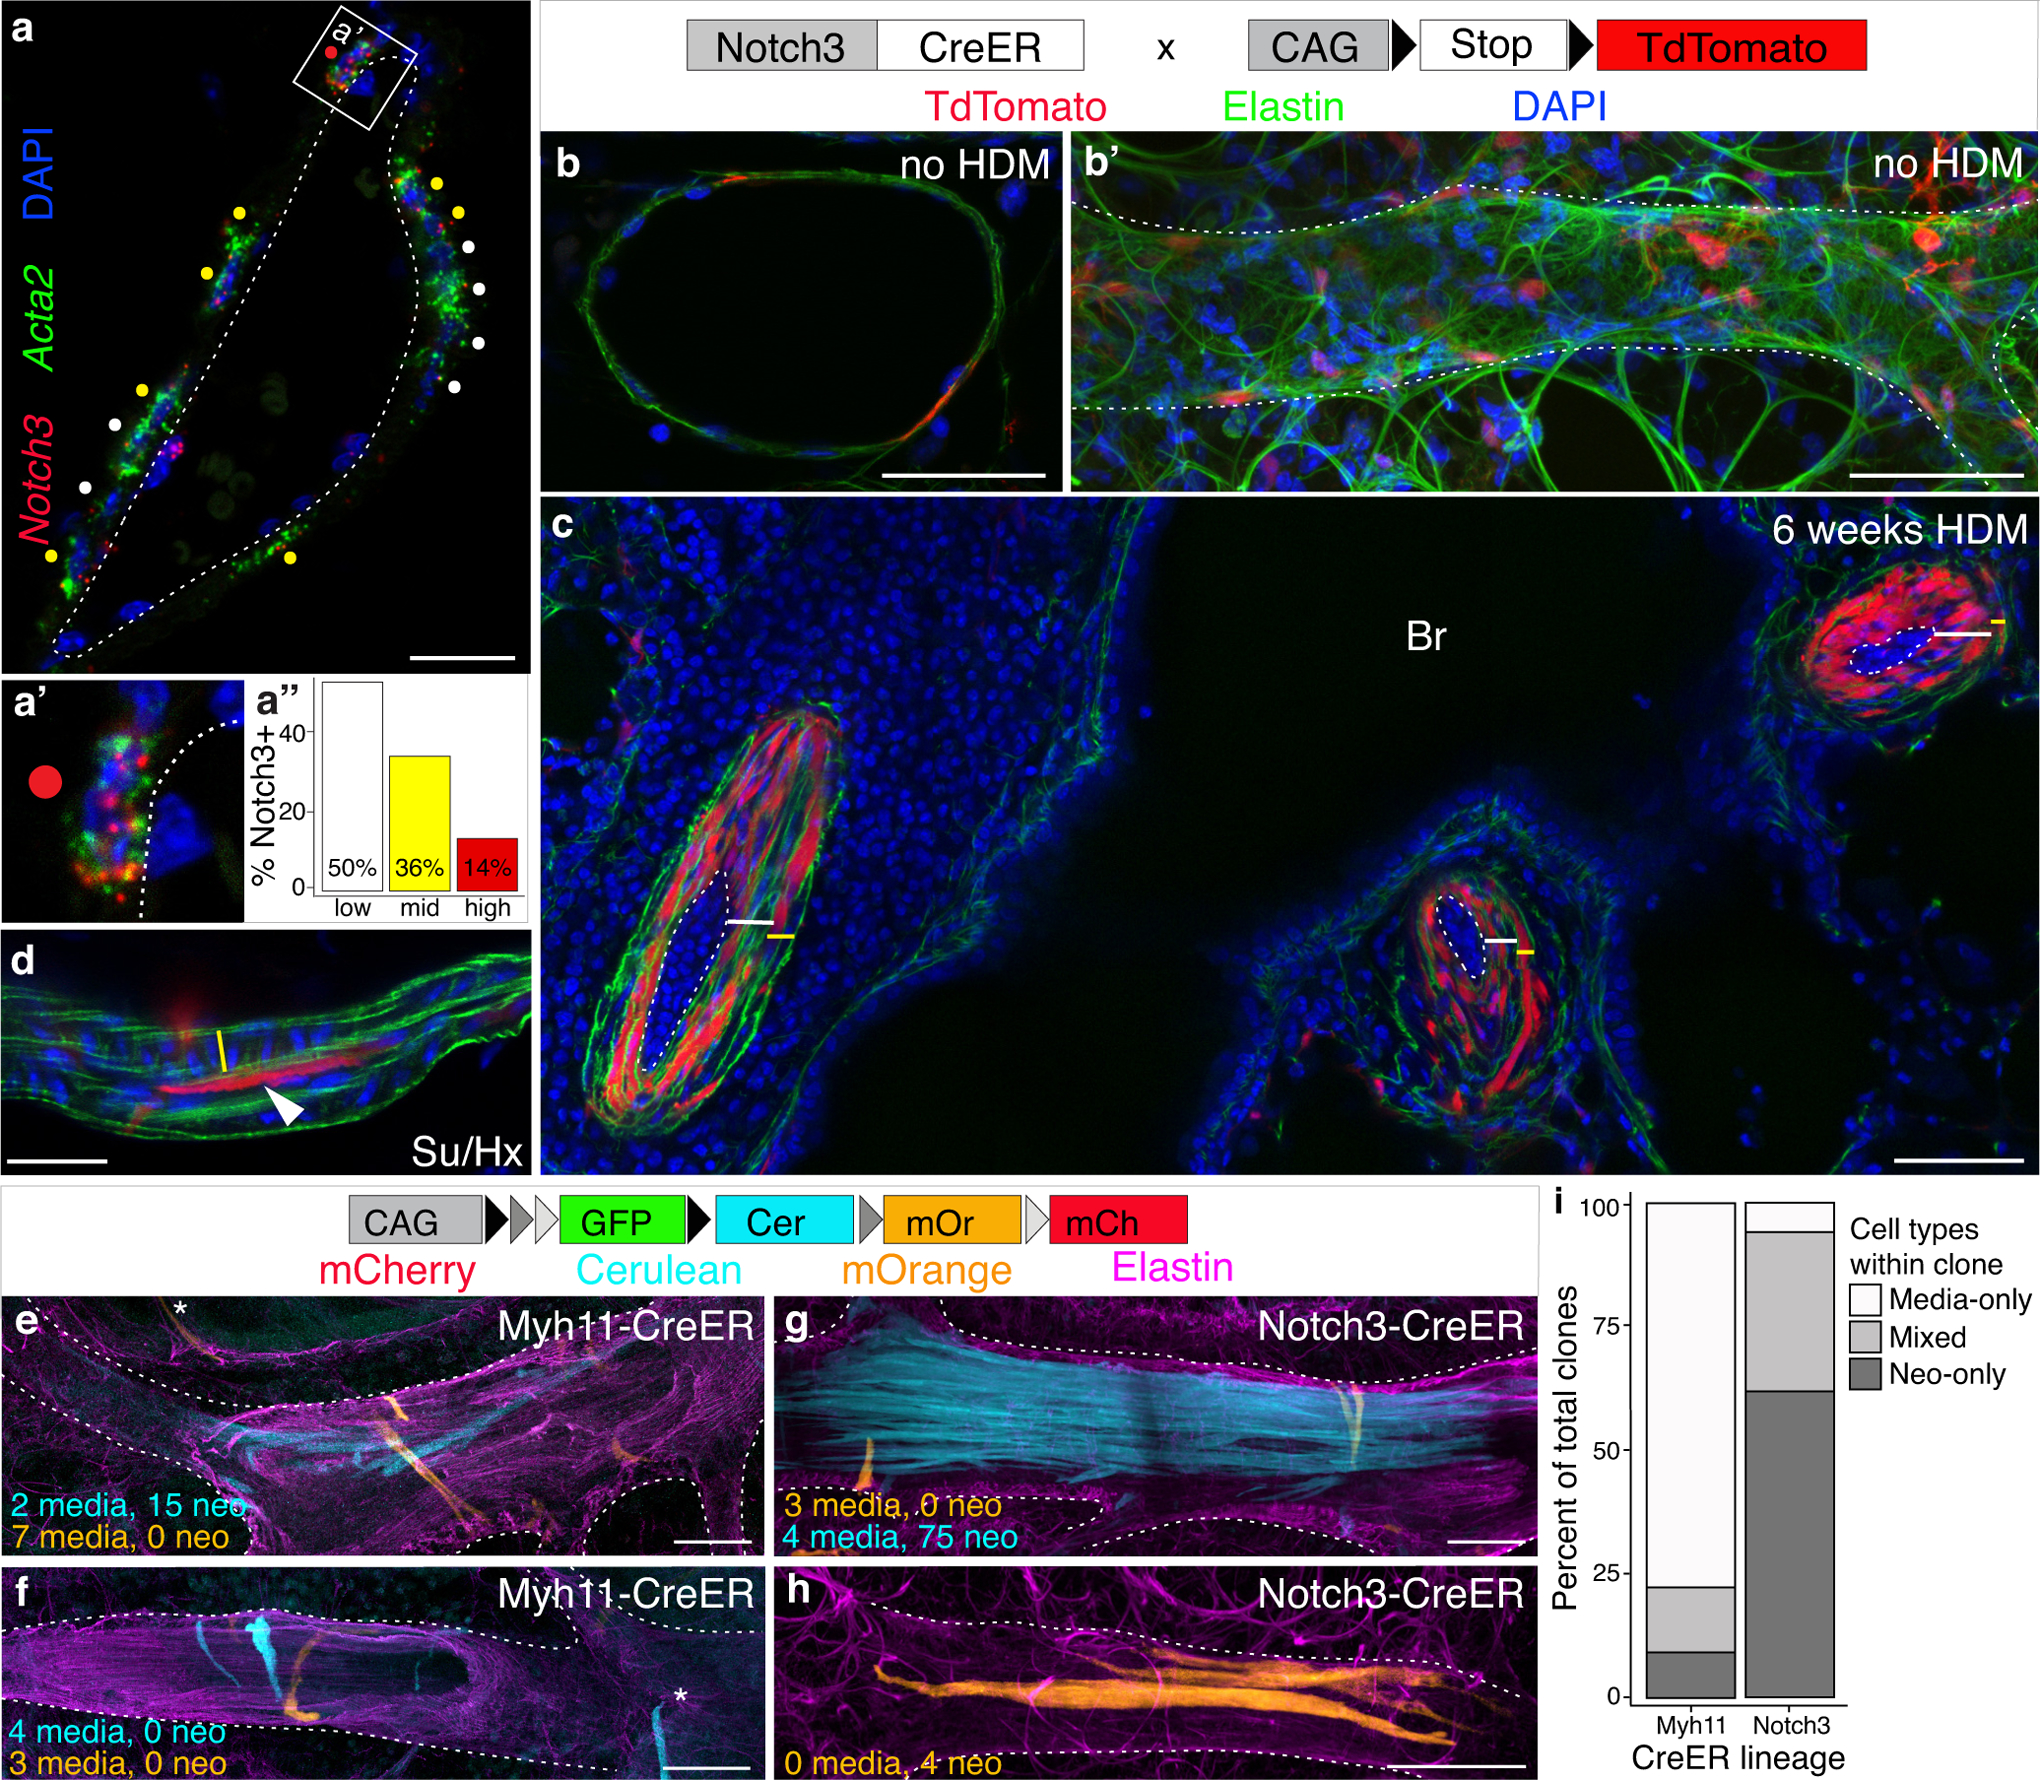
Methods: We comprehensively map the stepwise remodeling of pulmonary arteries in a robust, chronic inflammatory mouse model of pulmonary hypertension. This model demonstrates pathological features of the human disease, including increased right ventricular pressures, medial thickening, neointimal lesion formation, elastin breakdown, increased anastomosis within the bronchial circulation, and perivascular inflammation. Using genetic lineage tracing, clonal analysis, multiplexed in situ hybridization, immunostaining, deep confocal imaging, and staged pharmacological inhibition, we define the cell behaviors underlying each stage of vascular remodeling and identify a pathway required for neointima formation.

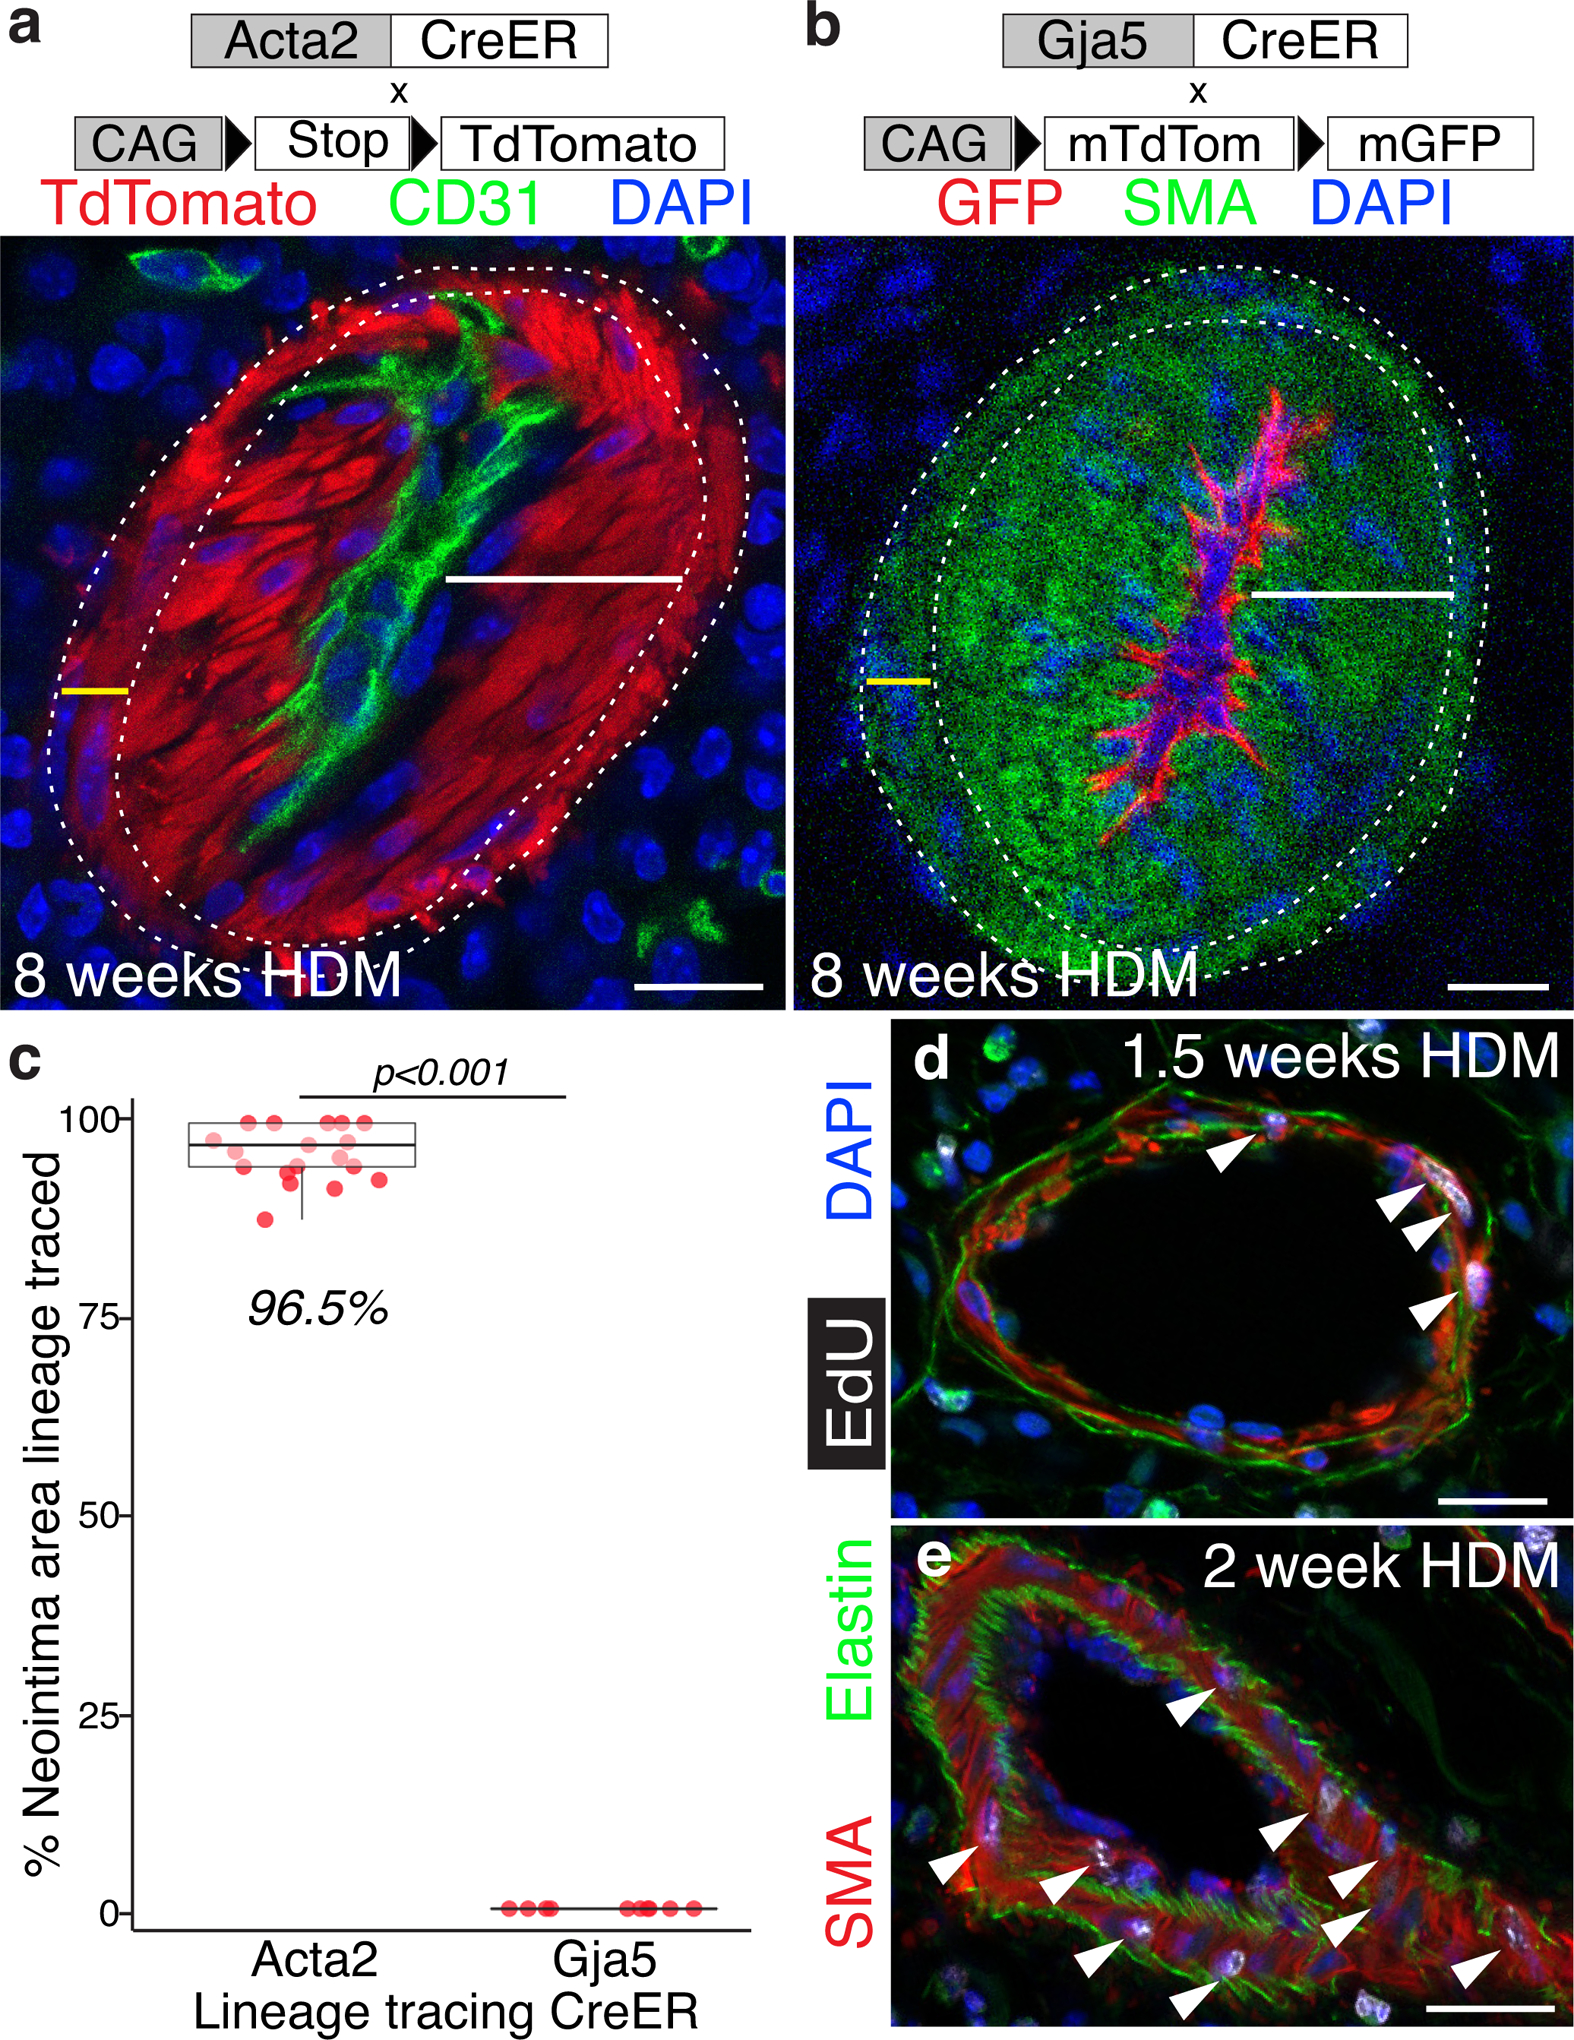
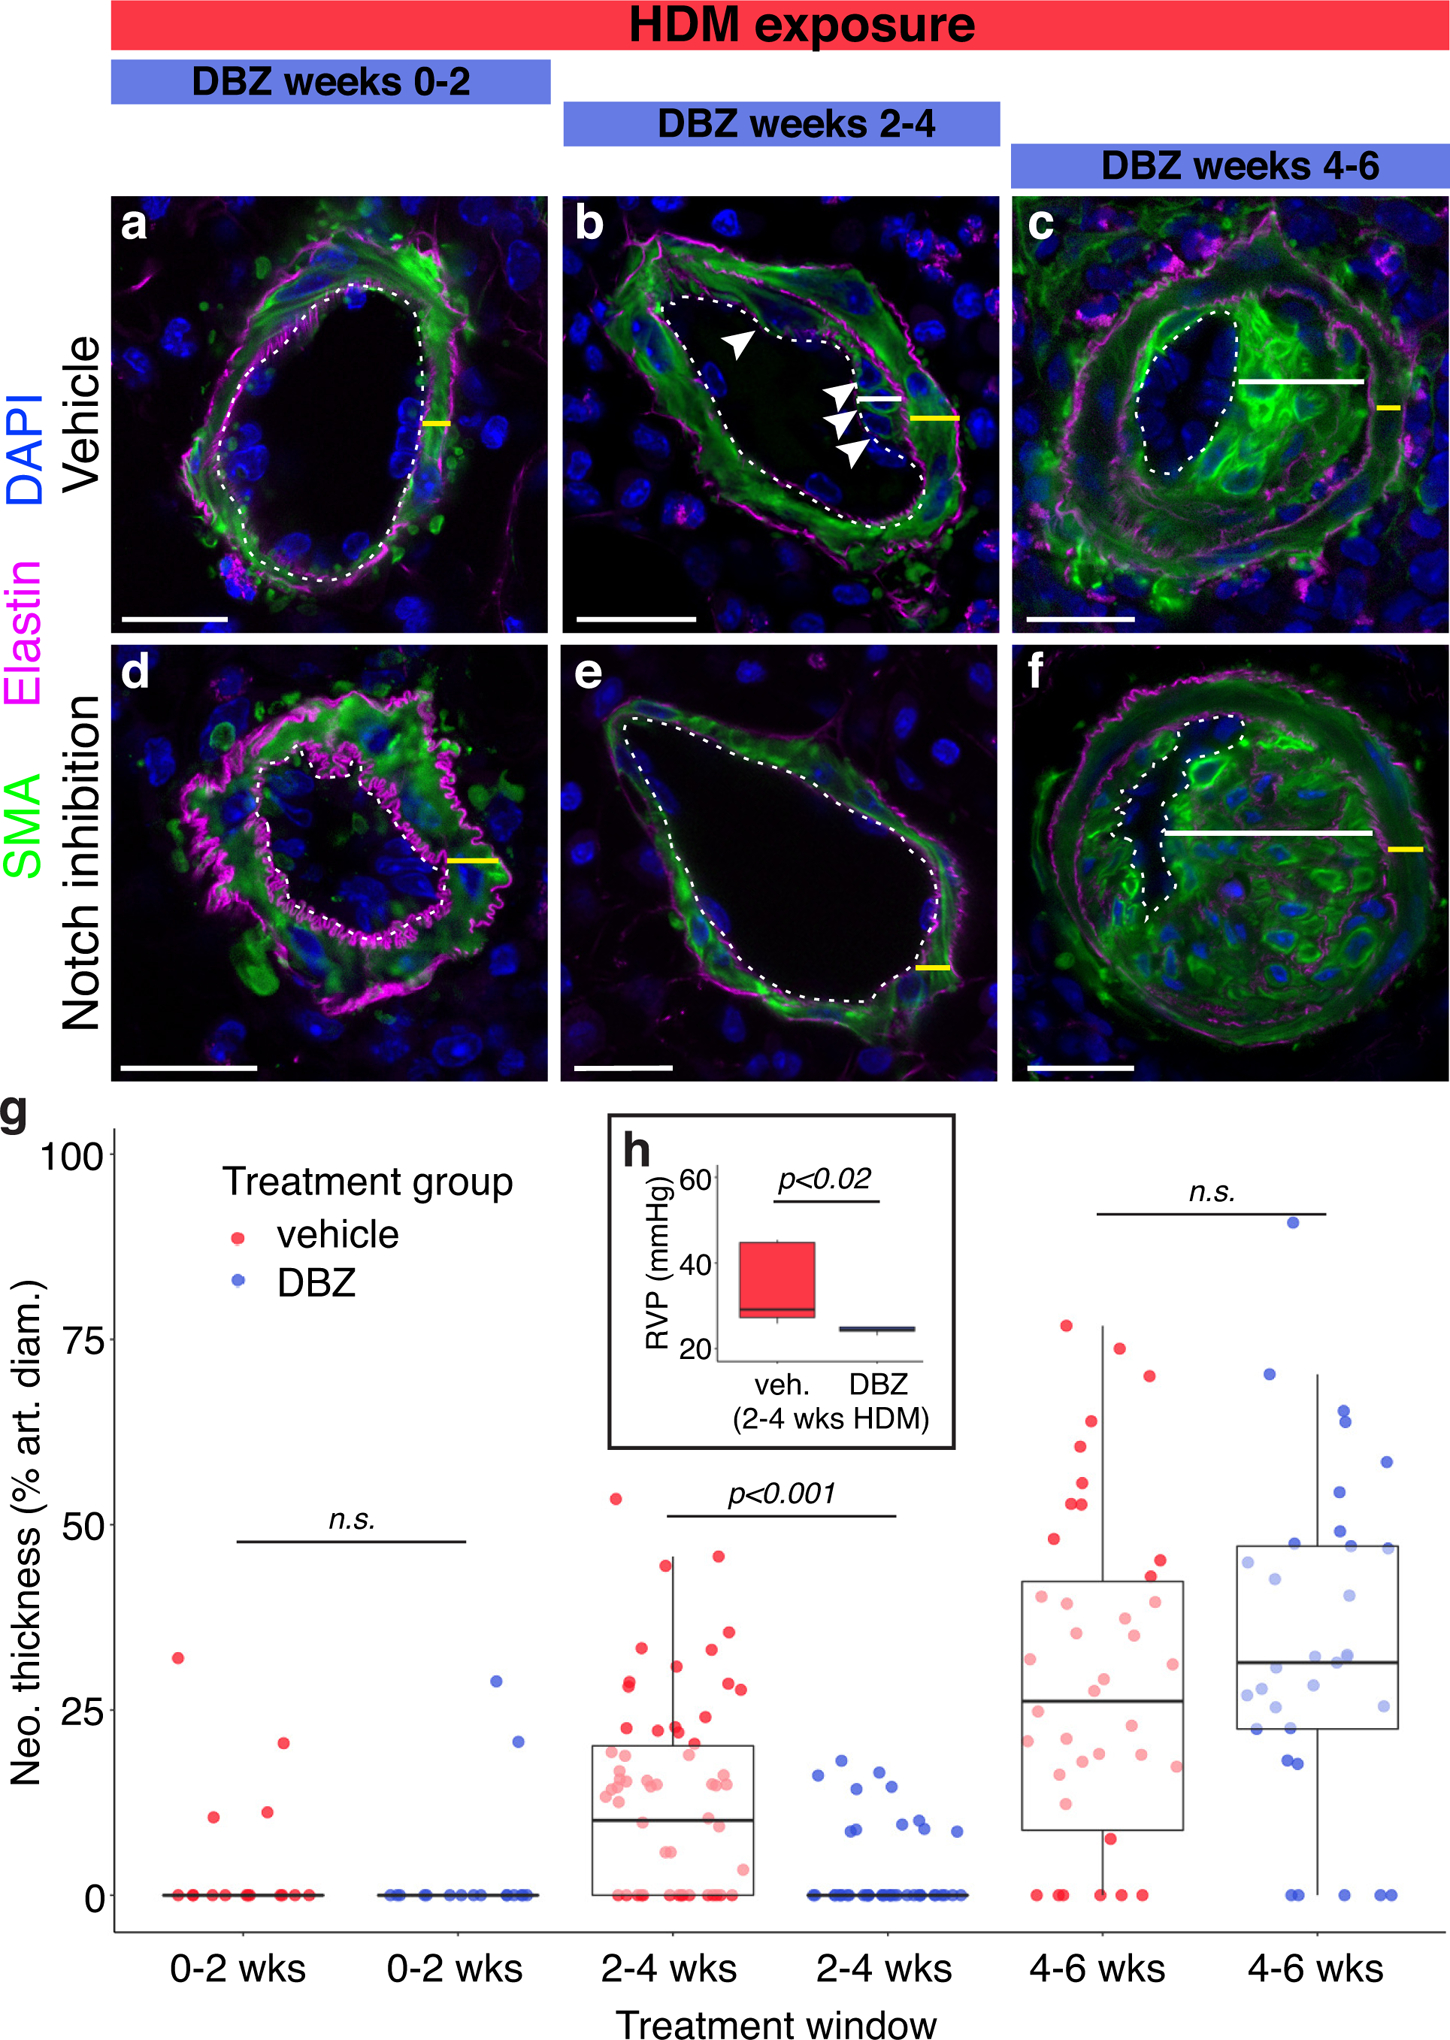
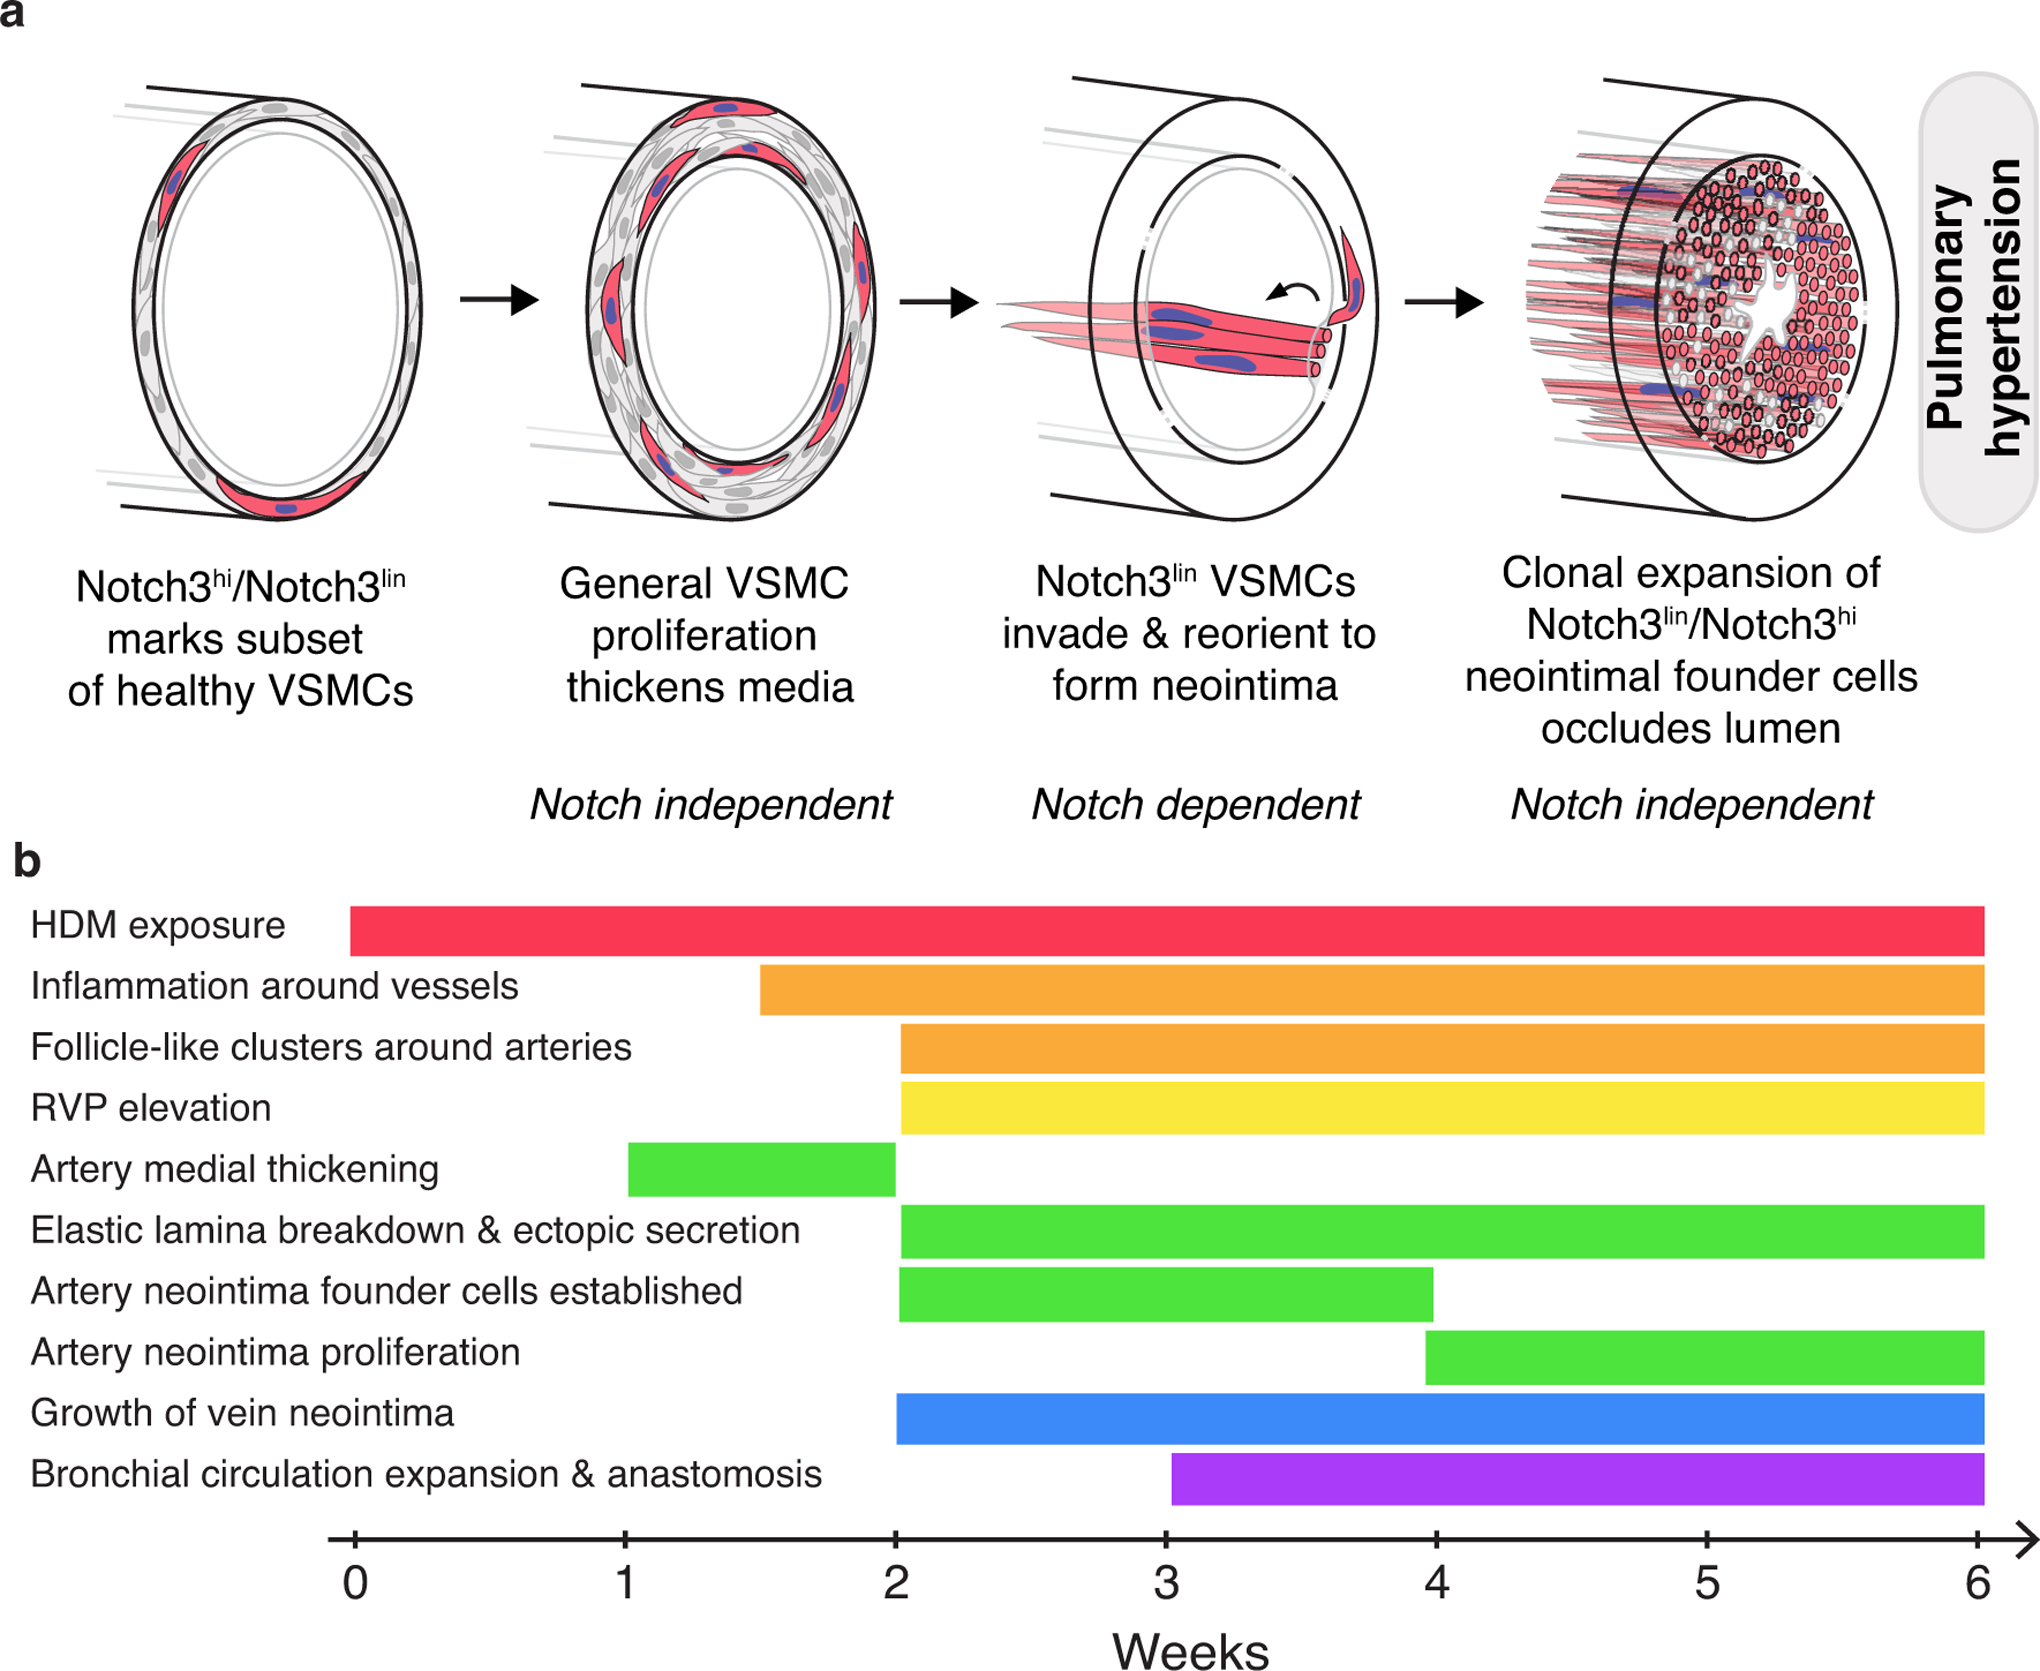
Results: Neointima arises from smooth muscle cells (SMCs) and not endothelium. Medial SMCs proliferate broadly to thicken the media, after which a small number of SMCs are selected to establish the neointima. These neointimal founder cells subsequently undergoing massive clonal expansion to form occlusive neointimal lesions. The normal pulmonary artery SMC population is heterogeneous, and we identify a Notch3-marked minority subset of SMCs as the major neointimal cell of origin. Notch signaling is specifically required for the selection of neointimal founder cells, and Notch inhibition significantly improves pulmonary artery pressure in animals with pulmonary hypertension.

Conclusions: This work describes the first nongenetically driven murine model of pulmonary hypertension (PH) that generates robust and diffuse occlusive neointimal lesions across the pulmonary vascular bed and does so in a stereotyped timeframe. We uncover distinct cellular and molecular mechanisms underlying medial thickening and neointima formation and highlight novel transcriptional, behavioral, and pathogenic heterogeneity within pulmonary artery SMCs. In this model, inflammation is sufficient to generate characteristic vascular pathologies and physiological measures of human PAH. We hope that identifying the molecular cues regulating each stage of vascular remodeling will open new avenues for therapeutic advancements in the treatment of PAH.

Keywords: cell lineage; clones; inflammation; neointima; pulmonary hypertension; vascular smooth muscle cells.


Figures

Figure 1:
Figure 1:. Chronic inflammation causes pulmonary hypertension in mice.
a, Right ventricular pulse pressure (RVP) elevation in mice exposed to 6 weeks of house dust mite (HDM) extract in PBS. Control animals were treated with intranasal PBS for the same duration. RVP was significantly elevated in HDM-exposed animals when compared to control (PBS). Hx, hypoxia. b, Right ventricular hypertrophy, expressed as the ratio of the mass of the right ventricle to that of the left ventricle plus septum (Fulton Index), was observed in all three exposure groups, though HDM-exposed animals fall short of significance. Comparisons in a & b were assessed by one-way ANOVA, showing a significant difference in RVP [F(3, 28)=19.95, p=4.05×10⁻⁷] and Fulton index [F(3,28)=38.67 p=4.32×10⁻¹⁰] across groups. Tukey’s HSD post-hoc test was carried out to derive the reported between-group comparison p-values. Normality checks and Levene’s test for homogeneity of variance were carried out and the assumptions were met. Dots, individual animal measurements. (a & b, PBS n=6 mice, HDM n=14 mice, Hx n=6 mice, HDM+Hx n=6 mice) c, Representative traces from a pressure catheter inserted into the right ventricle of anesthetized animals from each treatment group. Difference between pressure minimum and maximum averaged for three peaks to calculate RVP value for each animal. Peaks immediately before and after a breath (asterisk) were excluded when calculating RVP. d, Regions of DAPI-positive inflammatory cells (arrowheads) are prominent around pulmonary arteries (asterisks) and veins (v) following HDM exposure in immunostained lung sections. Br, bronchi. Representative confocal images shown from >20 mice examined. e, Clusters of actively proliferating inflammatory cells (arrowheads) marked by nuclear Ki67 staining organize a sustained local inflammatory response throughout HDM exposure and are found along arteries, veins and bronchi. Clusters around arteries and veins marked with arrowheads. Representative images shown, n=4 mice. Scale bar d & e, 100μm.
Figure 2:
Figure 2:. Chronic inflammation results in reproducible progressive artery remodeling in mice, including neointima formation and expansion, that closely mimics human disease.
a, Immunostained sections of pulmonary arteries demonstrate progressive remodeling following HDM exposure. The medial layer (yellow bar) located between the internal (dotted line) and external elastic laminae (elastin, magenta) comprising smooth muscle α-actin (SMA, green) expressing cells expands, with an increase in thickness and cell number (2 weeks HDM). SMA positive neointimal cells (white bar) appear between the internal elastic lamina and the endothelium (VE-cadherin, red, 4 weeks HDM) and grow over the next two weeks to fully occlude the vascular lumen (6 weeks HDM). Occasional neointimal “recanalization” is observed as small secondary endothelial tubes (asterisk) grow through the lesion (6 weeks HDM). DAPI, blue. Representative images shown from >25 animals evaluated for each timepoint. Scale bar, 20μm. b, Schematics depicting circumferential orientation of smooth muscle cells between elastin layers (black lines) in the media of both control arteries (“Healthy”) and those with thickened media (“Medial thickening”), and longitudinal orientation of neointima cells between internal elastin layer and endothelial cell layer (grey line; “Neointimal lesion” and “Neointimal lesion growth”). Double-headed arrows depict orientation of cells. c & d, Pulmonary artery remodeling following HDM exposure follows a reproducible time course, with medial thickening (c) occurring solely between weeks 1 and 2. Neointima (d) first appears between weeks 2 and 4 and expands thereafter until by 8 weeks neointima occupies 75% of artery diameter, and 97% of arteries contain neointimal lesions. During the period when neointima first appears (weeks 2–4), no significant difference in vessel diameter between arteries with neointima and those without was observed (p=0.92). Due to homogeneity of variance assumptions not being met for standard ANOVA analysis, a one-way Welch’s ANOVA was performed showing a significant difference in medial thickness [F(4,707)=51.08, p <0.001] and neointima thickness [F(4,707)=204.28, p<0.001] between groups. A Games-Howell nonparametric post-hoc test was used for between group comparisons, with p-values reported as above for both c & d. Dots, individual vessel measurements. Number of animals evaluated for quantification at each timepoint: 0wk n=3, 2wk n=3, 4wk n=3, 6wk n=5, 8wk n=2. Dot color in d indicates vessel diameter. Percent of scored vessels with neointimal lesions in italics. e, Longitudinally oriented SMA-positive neointimal cells run along the length of the artery in mouse neointimal lesions following 6 weeks of HDM exposure, shown in a confocal z-stack projection of an immunostained vibratome section. Representative image from >20 mice evaluated. Scale bar, 100μm. f & g, Human PAH neointimal lesions (representative images from n=2 patients with idiopathic PAH, f, or congenital heart disease-PAH, g) shown in confocal z-stack projections of immunostained vibratome sections, are also composed of long thin SMA-positive cells aligned parallel to the longitudinal axis of the arteries. e-g, Dotted lines outline arteries; Br, bronchus; Scale bar f & g, 200μm.
Figure 3:
Figure 3:. PH mice demonstrate numerous pathologic features of human IPAH.
a, Following 2 weeks of HDM exposure, inflammatory cells including CD68+ macrophages and CD11c+ dendritic cells surround arteries and are found within the walls of remodeling arteries (arrowheads). Representative image shown, 5 mice evaluated. b, Lesions from HDM-exposed mice show irregularities of the elastin layers including degradation of the internal elastin layer, with numerous apparent thinnings or gaps (red arrowheads), formation of supernumerary laminae (blue arrowheads), a phenomenon termed “onion skinning” in human PAH, and ectopic elastin deposition surrounding neointimal cells throughout the lesions (white bracket). Representative images shown from >50 mice evaluated. c, Temporal progression of the elastin changes illustrated in b (n=4 mice). Following HDM exposure veins develop neointima, similar to the “arterialization” of veins reported in PAH. Control veins (d & f) have a single elastin layer (magenta) with a sparse covering of smooth muscle cells (SMA, green) on both the external and lumenal sides. After two weeks of HDM exposure, the inner face of the elastin layer is lined with long thin SMA-positive cells roughly aligned with the long axis of the vein, as observed in neointima formation in arteries. As with the artery neointima, vein neointima expands significantly over the following weeks (d & e). Dots in e, individual vein measurements from n=4 mice. Dot color indicates vessel width. Due to homogeneity of variance assumptions not being met for standard ANOVA analysis, a one-way Welch’s ANOVA was performed showing a significant difference in vein smooth muscle layer thickness [F(2,63)=12.75, p<0.001] between groups. A Games-Howell nonparametric post-hoc test was used for between-group comparisons. f, Confocal z-stack projection of a control vein demonstrating a porous elastin layer (magenta) with sparse smooth muscle cells (SMA, green) wrapping healthy vein. g, Confocal z-stack projection of a vein from a mouse exposed to HDM daily for 2 weeks demonstrates near complete muscularization of the vein by smooth muscle cells (SMA, green). b, d, f & g Representative images shown from >20 mice evaluated. Scale bars in a, b, d, f & g, 20μm. h-j, In mice the bronchial circulation (brackets), which brings oxygenated blood to the tissues of the lung, wraps large airways (Br) and veins, and is found between arteries (asterisks) and airways. h, In healthy animals, connections between the bronchial and pulmonary circulations (PC) are rare. i & j, In HDM exposed animals, similar to human PAH, the bronchial vessels become more extensively branched (30 branches per 108 μm3 in HDM vs. 3 branches per 108 μm3 in PBS controls) and anastomosis (arrowheads, j) with pulmonary capillaries is observed. Images representative of 6 PBS control mice and 5 HDM treated mice shown. Scale bars h-j, 100μm.
Figure 4:
Figure 4:. Smooth muscle not endothelium generates expanded media and neointima following HDM exposure.
a, Following 8 weeks HDM exposure both the expanded media (yellow bar, between dotted lines) and neointima (white bar) are labeled by genetic lineage trace of pre-existing Acta2-CreER-expressing SMCs (marked by heritable expression of tdTomato, red) demonstrating that smooth muscle cells are the cell of origin for the expanded media and neointima. b, Genetic lineage tracing demonstrates that Gja5-CreER-marked pre-existing endothelial cells (which express GFP following Cre-mediated recombination, red) contribute to neither the media nor the neointima (SMA, green), but rather remain in the endothelium. a & b Position of elastic laminae is indicated by dotted lines. n=5 Acta2-CreER mice and n=2 Gja5-CreER mice with >1000 vessel cross-sections reviewed per genotype, distributed across all lobes of the lung. c, Percent neointima lineage labeled with Acta2-CreER or Gja5-CreER following 8 weeks of HDM exposure. Dots, individual vessel measurements. Median value indicated in italics. A Welch two-sample t-test found a significant difference between Acta2- and Gja5-CreER groups [t(20)=123.86, p< 2.2×10⁻¹⁶, d=38.2]. Quantification completed on 2 mice/genotype. d & e, Daily EdU administration during the first two weeks of HDM exposure shows cell division among VSMCs in media (arrowheads) demonstrating that the media thickens through proliferation. EdU incorporation into nuclei of proliferating cells shown in white. Note higher number of EdU marked cells at 2 weeks. n=2 mice. See Figure V in the Supplement for PBS controls and additional time points. Scale bar, 20μm.
Figure 5:
Figure 5:. Distinct cell behaviors underlie medial expansion and neointimal lesion formation.
a, In healthy mice, a single dose of tamoxifen to Myh11-CreER; Rainbow animals resulted in randomly distributed labeling of SMCs within the media such that an individual labeled cell will heritably express either Cerulean, mOrange, or mCherry. Medial SMCs are oriented orthogonal to axis of artery. 2 animals examined. Scale bar, 50μm. b, Following 3 weeks HDM the distribution of colors remains random in the thickened media, suggesting many or all VSMCs divide a small number of times to expand the media. >100 arteries from 2 animals examined. Early neointima cells (arrowheads, highlighted in inset, b’), oriented parallel to axis of artery, are visible beneath media cells. Early neointima clusters are composed of a small number of cells of different colors. >200 clusters scored from 2 animals. Scale bar, 100μm. c, In contrast to the random distribution of colors in the media, single color bundles of neointima cells (oriented parallel to the axis of the artery) are seen after expansion of neointimal lesions, indicating that lesion growth occurs by local proliferation of a small number of neointima founder cells. >100 arteries from 2 animals examined. Colored dotted lines indicate boundaries of single-color bundles of neointima cells. Scale bar, 50μm. a-c, Representative projections of confocal z-stack of cleared vibratome sections. mCherry, red; mOrange, orange; Cerulean, cyan. White dotted lines outline arteries and lumens for cross-sectional images. d, Schematics illustrating cell dynamics among VSMCs and their progeny during artery remodeling. Random color distribution of labeled cells prior to HDM exposure (“no HDM”) is maintained in medial layer following medial thickening (“3 weeks HDM”) suggesting many or all medial cells proliferate to expand the media. Small clusters of longitudinally oriented neointimal cells are seen following 3 weeks of HDM exposure with subsequent clonal expansion of a small number of neointimal founder cells following 6 weeks of HDM as demonstrated by large single-color bundles in the neointima. e, The shift from a random distribution of cell labels in media (blue dots) and early neointima (red dots, 3 wk HDM) to bundles of single color neointima after 6 weeks HDM exposure (red dots, 6 wk HDM) is represented by counting the number of color changes between neighboring cells along transect lines (schematized as dashed lines in d) through either media or neointima. n= 2 mice per timepoint. Dots, individual transect measurements. Comparison assessed by one-way ANOVA which showed a significant difference in color change/transect [F(4,68)=25.58, p=5.95×10⁻¹³] across groups. Tukey’s HSD post-hoc tests were carried out to derive the reported between group comparison p-values. Normality checks and Levene’s test for homogeneity of variance were carried out and the assumptions were met. See Figure VI in the Supplement for further information on experimental design.
Figure 6:
Figure 6:. Notch3-expressing subset of vascular smooth muscle cells are the cell of origin for neointima.
a, Quantitative multiplexed fluorescent in situ hybridization (QM-FISH) for Acta2 (green) and Notch3 (red) mRNA reveals a Notch3-expressing VSMC sub-population around healthy pulmonary arteries. a’, Example of an Acta2+ cells with high Notch3 expression. Scale bar, 20μm. a”, Notch3 levels within Acta2+ cells around arteries quantitated for 192 cells from 1 mouse. None/low (white), 0–2 Notch3 punctae per Acta2+ cell; Mid (yellow), 3–7 punctae; High (red), 8 or more punctae. Dotted line marks boundary between media and endothelium. b, Notch3-CreER labeling (red) marks approximately 15% of SMCs in healthy arteries, seen both in cross-section and along the artery length, b’, in an immunostained vibratome section. >100 arteries from 5 animals examined. Dotted line outlines artery in b’. c, Following 6 weeks HDM exposure the majority of neointima cells (white bars; 41–88%; median 71%) are labeled by lineage trace of pre-existing Notch3-CreER-expressing VSMCs (marked by heritable expression of tdTomato, red) demonstrating that Notch3-expressing cells are the cell of origin for the neointima (1560 cells scored from 2 animals). Dotted lines mark boundary between endothelium and neointima; yellow bars mark thickened media. b & c, Scale bar, 50μm. d, Notch3-lineage cells (red, marked with arrowhead) also generate neointima (arrowhead) in mice treated with SU5416 and exposed to four weeks hypoxia (Su/Hx), an established model of pulmonary artery remodeling; n=2 mice. Elastin, green; DAPI, blue. Scale bar, 20μm. e-h, Clones were generated in healthy animals using Notch3-CreER (n=2 mice) or Myh11-CreER (n=3 mice) combined with the Rainbow multicolor Cre reporter. e, f & i, The majority of Myh11-CreER clones in remodeled arteries were composed solely of media cells, with only 22 of 115 clones (19%) containing neointima (i). g-i, In HDM-exposed Notch3-lineage labeled mice, 121 of 134 (90%) clones contained neointima, demonstrating that neointimal progenitors are strongly enriched in the Notch3-marked population in healthy arteries. White dotted lines outline arteries. Scale bar e-h, 50μm.
Figure 7:
Figure 7:. Neointimal founder cell selection is Notch-dependent.
To test the role of Notch signaling in each stage of vascular remodeling, mice were given either vehicle (a-c) or the Notch inhibitor DBZ (d-f) for staggered two-week windows (blue bars, top) during chronic HDM exposure. Blocking Notch signaling prevents formation of the first neointima cells (arrowheads, b & e, DBZ or vehicle given during weeks 2–4 of HDM exposure; harvest at 4 weeks). DBZ treatment had no effect on the medial thickening (a & d, DBZ or vehicle during weeks 0–2 of HDM exposure; harvest at 2 weeks) or expansion of already established neointima (c & f, DBZ during weeks 4–6 of HDM exposure, harvest at 6 weeks), indicating that Notch signaling is required only for neointima founder cell selection. Representative confocal images shown. SMA, green; elastin, magenta; DAPI, blue; media, yellow bars; neointima, white bars. Dotted lines mark the boundary between endothelium and media/neointima. Scale bar, 20μm. Establishment of neointima (g, weeks 2–4) is significantly reduced following Notch inhibition (blue dots) versus vehicle (red dots), but neointimal growth (weeks 4–6) is unchanged. Between group differences were assessed by two-way ANOVA showing a statistically significant interaction between the effects of Treatment and Treatment Window on neointima thickness [F(2,276)=9.182 p<0.001]. Tukey’s HSD post hoc tests were carried out to derive the reported between-group comparison p-values. Normality checks were carried out and assumptions were met. Dots, individual vessel measurements. h, Notch-blockade with DBZ treatment (blue box) during weeks 2–4 of HDM exposure significantly reduces RVP compared to vehicle-treated animals (red box). 6 animals per treatment group. Significance assessed with Mann-Whitney Wilcoxon rank sum test.
Figure 8:
Figure 8:. Staged events in pulmonary artery remodeling and development of PH in this model.
a, The vascular smooth muscle cells in the media of healthy arteries are molecularly heterogeneous. In the schematic, the minority population distinguished by high levels of Notch3 transcription (“Notch3hi”) and labeling by Notch3-CreER (“Notch3lin”) is colored red. Following HDM exposure and accompanied by perivascular inflammation, general proliferation of most or all VSMCs leads to medial thickening, possibly through direct reception of inflammatory cytokines by VSMCs. A subsequent breakdown of the internal elastic lamina may increase access to endothelial signals by VSMCs. A small number of smooth muscle cells, most Notch3hi/Notch3lin, traverse the internal elastic lamina to found the neointima, possibly in response to endothelium-derived Notch ligands. Once established, neointima founder cells clonally expand and eventually occlude the vessel lumen. Notch signaling is specifically required for neointimal establishment; the signals (and their sources) that serve as the proliferative cues driving medial and neointimal expansion are currently unknown. Inflammatory cues may act at any or all steps. b, The major events in vascular remodeling following HDM exposure occur in a defined sequence and with reproducible timing. Key changes to the lung vasculature in HDM-exposed animals, arranged (from top to bottom) in the order in which they appear. Timeline indicates weeks of HDM exposure in BALB/c animals. Events are grouped by category: inflammatory changes, orange; hemodynamic changes, yellow; pulmonary artery changes, green; pulmonary vein changes, blue; bronchial circulation changes, purple.

References

    1. Humbert M, Guignabert C, Bonnet S, Dorfmuller P, Klinger JR, Nicolls MR, Olschewski AJ, Pullamsetti SS, Schermuly RT, Stenmark KR, et al. Pathology and pathobiology of pulmonary hypertension: state of the art and research perspectives. Eur Respir J. 2019;53:1801887. doi: 10.1183/13993003.01887-2018. - DOI - PMC - PubMed
    1. Simonneau G, Montani D, Celermajer DS, Denton CP, Gatzoulis MA, Krowka M, Williams PG and Souza R. Haemodynamic definitions and updated clinical classification of pulmonary hypertension. Eur Respir J. 2018;53:1801913. doi: 10.1183/13993003.01913-2018. - DOI - PMC - PubMed
    1. Spiekerkoetter E, Kawut SM and de Jesus Perez VA. New and emerging therapies for pulmonary arterial hypertension. Annu Rev Med. 2019; 70:45–59. doi: 10.1146/annurevmed-041717-085955. - DOI - PMC - PubMed
    1. Lau EMT, Giannoulatou E, Celermajer DS and Humbert M. Epidemiology and treatment of pulmonary arterial hypertension. Nat Rev Cardiol. 2017;14:603–614. doi: 10.1038/nrcardio.2017.84. - DOI - PubMed
    1. Tuder RM, Marecki JC, Richter A, Fijalkowska I and Flores S. Pathology of pulmonary hypertension. Clin Chest Med. 2007;28:23–42. doi: 10.1016/j.ccm.2006.11.010. - DOI - PMC - PubMed

Publication types