. 2020 Jul;102(1-1):012409.
doi: 10.1103/PhysRevE.102.012409.

Riemannian geometry and statistical modeling correct for batch effects and control false discoveries in single-cell surface protein count data

Affiliations

Riemannian geometry and statistical modeling correct for batch effects and control false discoveries in single-cell surface protein count data

Shuyi Zhang et al. Phys Rev E. 2020 Jul.

Abstract

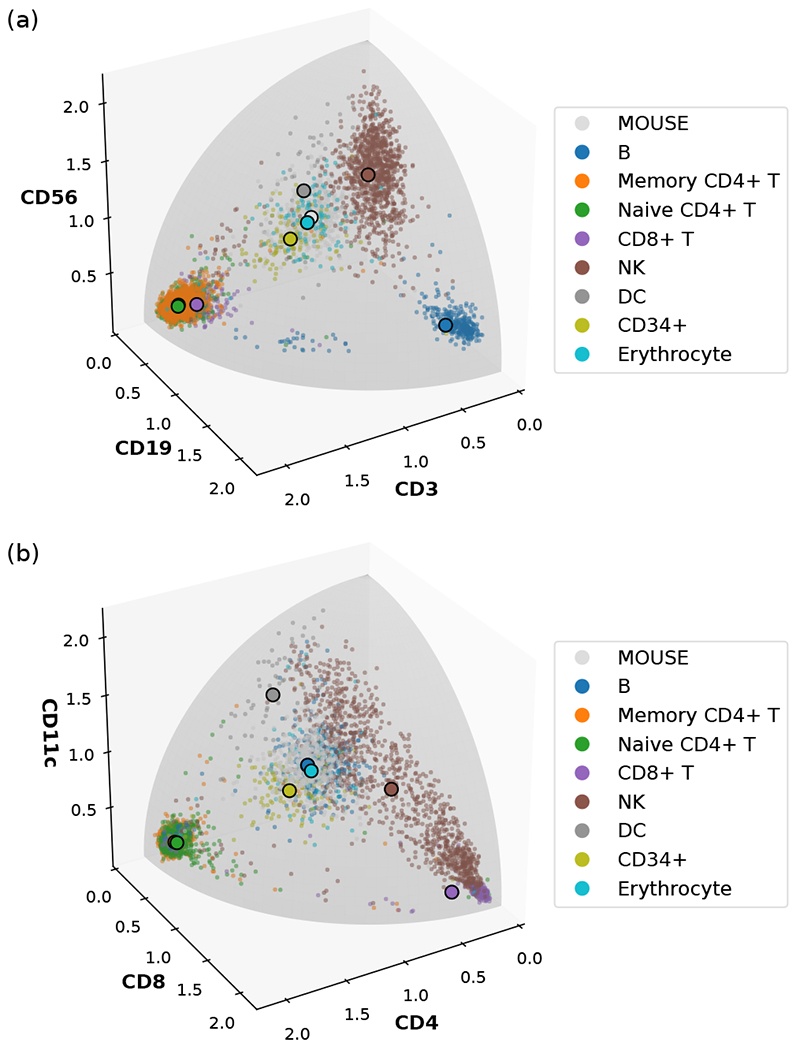
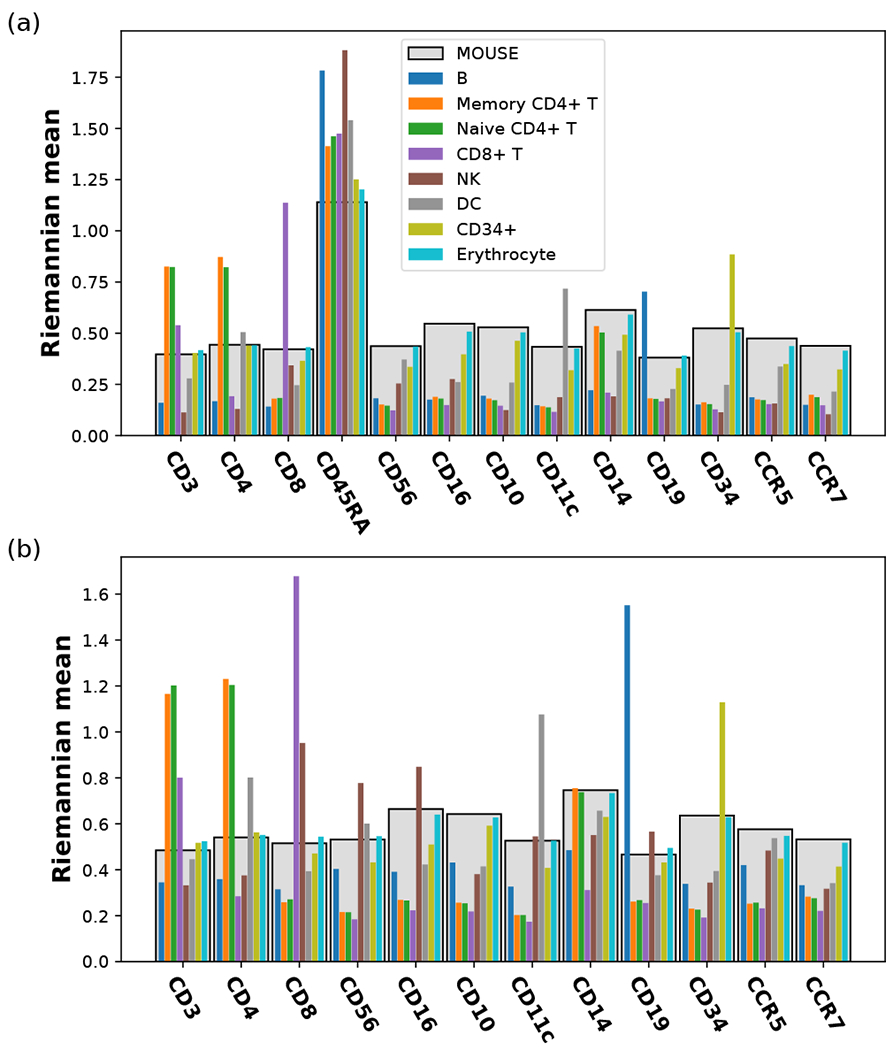
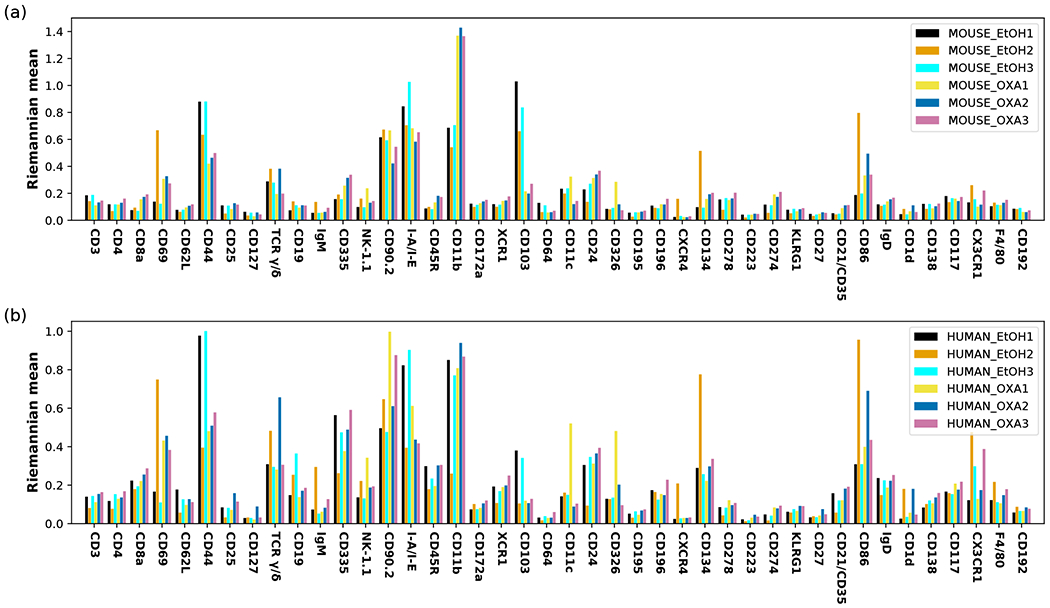
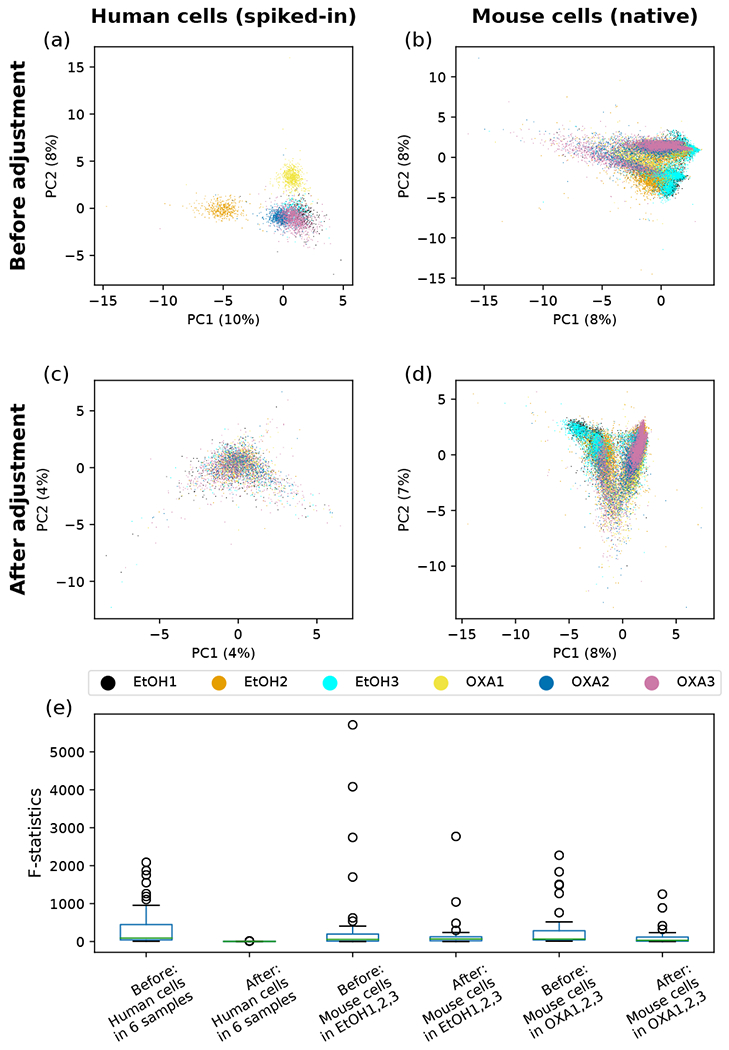
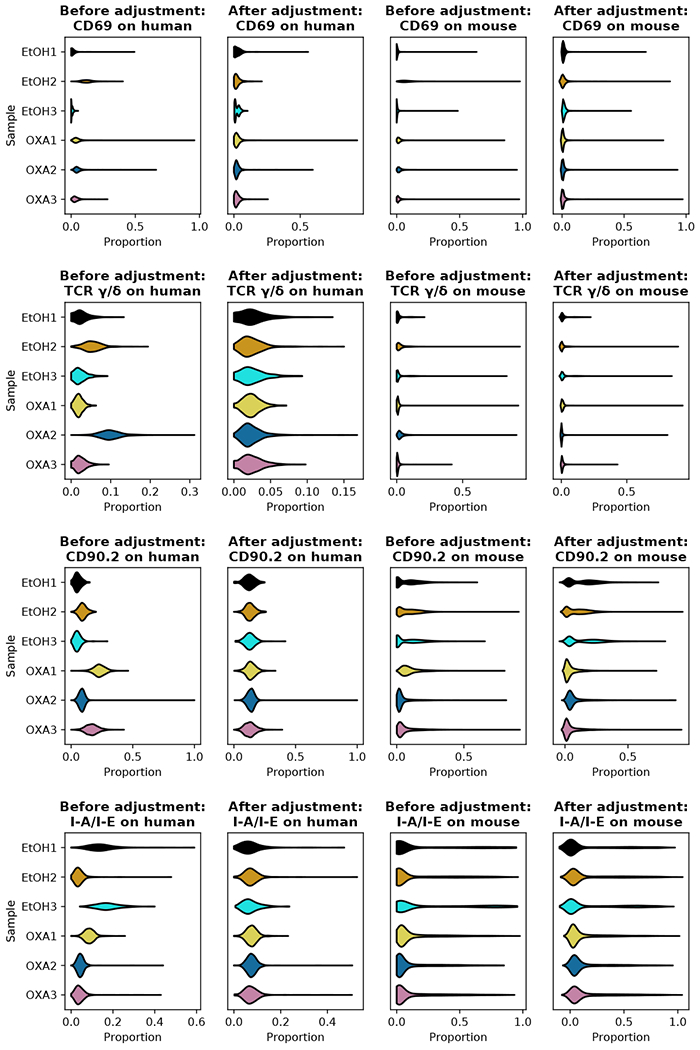
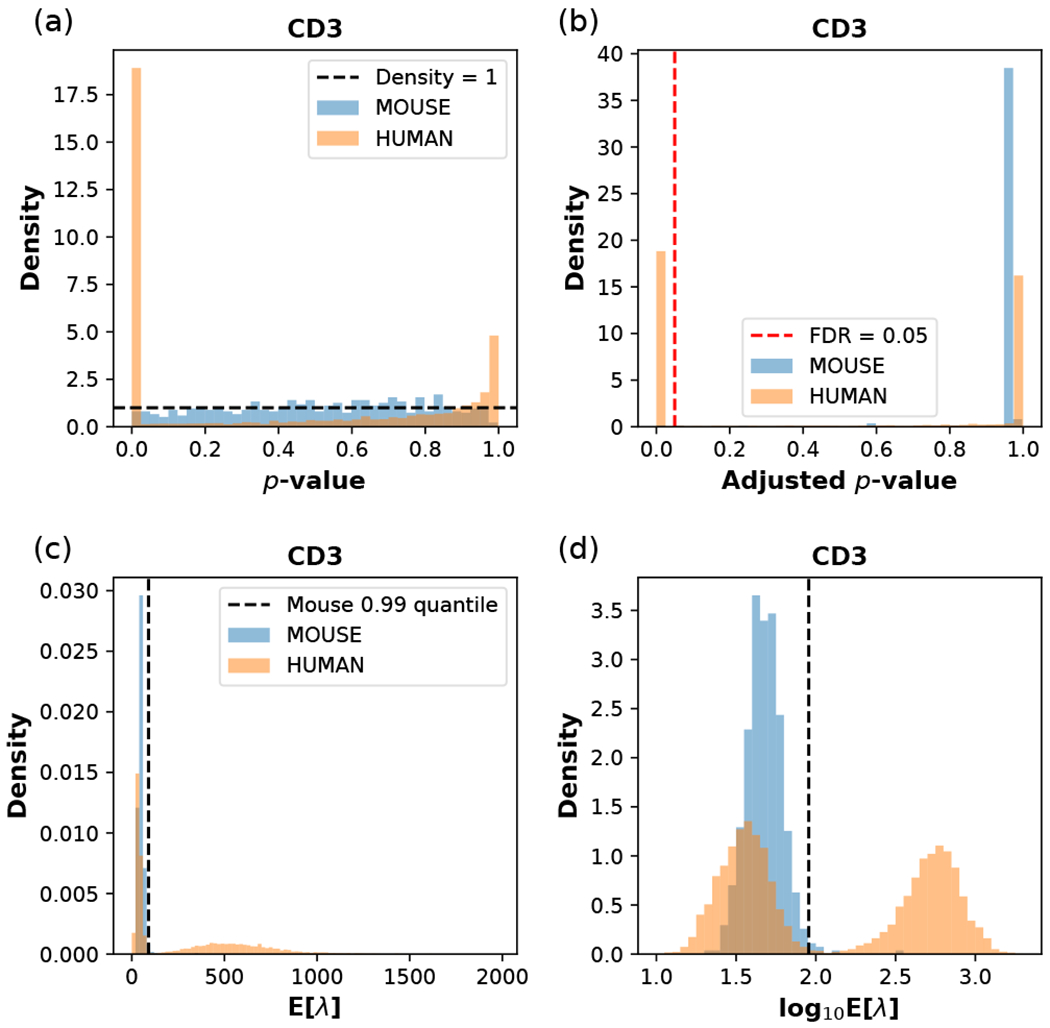
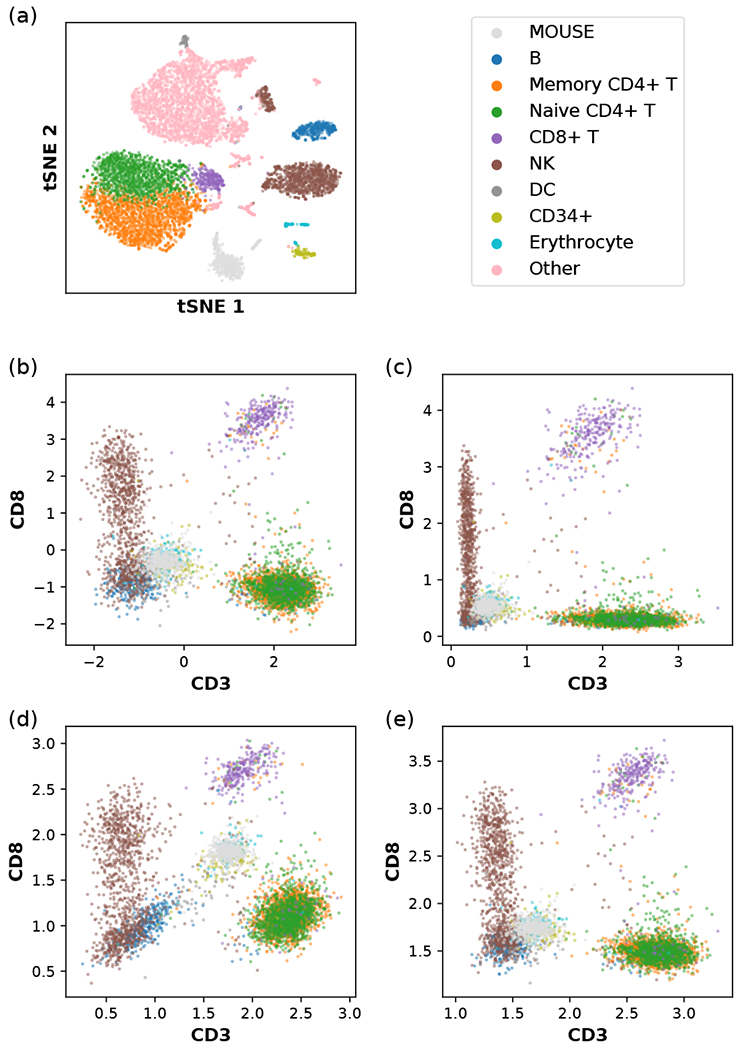
Recent advances in next generation sequencing-based single-cell technologies have allowed high-throughput quantitative detection of cell-surface proteins along with the transcriptome in individual cells, extending our understanding of the heterogeneity of cell populations in diverse tissues that are in different diseased states or under different experimental conditions. Count data of surface proteins from the cellular indexing of transcriptomes and epitopes by sequencing (CITE-seq) technology pose new computational challenges, and there is currently a dearth of rigorous mathematical tools for analyzing the data. This work utilizes concepts and ideas from Riemannian geometry to remove batch effects between samples and develops a statistical framework for distinguishing positive signals from background noise. The strengths of these approaches are demonstrated on two independent CITE-seq data sets in mouse and human.


Figures

FIG. 1.
FIG. 1.
Examples of mapping the surface protein count data of human CBMC with spiked-in mouse cells to a three-dimensional sphere of radius 2. (a) The list of selected proteins is {CD3, CD19, CD56}. (b) The list of selected proteins is {CD4, CDS, CDllc}. In both cases, each distinct cell type is displayed with the color indicated in the legend. NK and DC denote natural killer cells and dendritic cells, respectively. Small dots denote individual cells, and large dots with black outlines denote the Riemannian mean of the point cloud of each cell type.
FIG. 2.
FIG. 2.
Riemanman mean calculated from the surface protein count data of each indicated cell type in the human CBMC data set. (a) All proteins are included (D = 13). (b) CD45RA is excluded (D = 12). In both ways of mapping, the components of the Riemanman mean correspond to the height of the bars; the light gray bars in the back represent the spiked-in mouse data, while the thin bars in the front represent the different cell types in human blood, with their order and colors indicated in the legend.
FIG. 3.
FIG. 3.
Batch effects within the three oxazolone-treated samples (OXA1,2,3) and the three control samples (EtOHl,2,3) of mouse skin cells, (a) Riemannian mean of the native mouse cells from each sample, (b) Riemannian mean of the spiked-in human cells from each sample. All proteins measured are included (D = 42). The bar height corresponds to the component of the Riemannian mean in the direction indicated on the ;r-axis.
FIG. 4.
FIG. 4.
Principal component analysis (PCA) and the analysis of variance (ANOVA) of spiked-in human cells and native mouse cells on the probability simplex before and after batch correction. The single-cell ADT count data of surface proteins were transformed to probability vectors, which were then projected to the plane spanned by the first two principal components (PCs) for the PCA plots (a-d) and on which ANOVA was performed, (a) Spiked-in human data before batch correction. One control sample (EtOH2) and two treated samples (OXA1,2) are seen to be outliers from the rest, (b) Mouse data before batch correction. The biases observed in (a) are seen to be carried over here, (c) Spiked-in human data after batch correction. Point clouds of all six samples are seen to overlap well, (d) Mouse data after batch correction. Points from the six samples are seen to align well with respect to the two treatment conditions, (e) Distribution of the F-statistics from ANOVA for 41 surface proteins before and after the batch correction in six murine skin samples.
FIG. 5.
FIG. 5.
Effects of batch correction on the six samples of mouse skin cells with spiked-in human cells. The data points on the hypersphere either before or after the batch correction are mapped back to the probability simplex. Distributions of proportion for human and mouse cells in each of the six samples are shown for the four selected surface proteins CD69, TCR γ/δ, CD90.2, and I-A/I-E.
FIG. 6.
FIG. 6.
Fitting the NB model on spiked-in mouse cells in the CBMC data set, and performing statistical tests and data transformation with the estimated model parameters. The surface protein is chosen to be (human) CD3, with the fitted model paramters α = 10.30, β = 0.2074 estimated from the mouse data, and ω = 0 fixed for the NB model, (a) The distribution of p-values for mouse and human cells calculated from the fitted model. The horizontal dashed line indicates a uniform distribution with constant density 1. (b) The distribution of adjusted p-values. The vertical red dashed line indicates the FDR threshold of 0.05; cells to the left of this line are considered as CD3+, and they are all human cells, (c) The distribution of the posterior mean E[λ] for mouse and human cells calculated from the model parameters, (d) The distribution of log10E[λ] for mouse and human cells. In (c) and (d), the vertical dashed line indicates the 0.99 quantile of the spiked-in mouse data.
FIG. 7.
FIG. 7.
Data transformation applied to human CBMC with spiked-in mouse cells, (a) tSNE plot of the single-cell transcriptomic (scRNA-seq) data. The RNA count data, have been log-normalized, as described in Eq. (D1), and compressed using a dimensional reduction method (Appendix A). The indicated color scheme for cell types is carried over to (b,c,d,e). NK and DC denote natural killer cells and dendritic cells, respectively. CD14+ monocytes, CD16+ monocytes, megakaryocytes, and plasmacytoid dendritic cells (pDCs) are grouped into the category “Other” and omitted in other panels. (b) A version of the centered log ratio (CLR) transformation of the single-cell immunophenotype data, as described in Eq. (D2). (c) Another version of the CLR transformation of the single-cell immunophenotype data, as described in Eq. (D3). (d) Our data transformation method using the relative size factor ti = ai/a0, with ai being the arithmetic mean of count per protein, as described in Eq. (D6). (e) Our data transformation method using the relative size factor ti = gi/g0, with gi being the geometric mean of count (plus one pseudocount) per protein, as described in Eq. (D7).

References

    1. Shahi P, Kim SC, Haliburton JR, Gartner ZJ, and Abate AR, Abseq: Ultrahigh-throughput single cell protein profiling with droplet microfluidic barcoding, Scientific Reports 7, 44447 (2017). - PMC - PubMed
    1. Stoeckius M, Hafemeister C, Stephenson W, Houck-Loomis B, Chattopadhyay PK, Swerdlow H, Satija R, and Smibert P, Simultaneous epitope and transcriptome measurement in single cells, Nature Methods 14, 865 (2017). - PMC - PubMed
    1. Peterson VM, Zhang KX, Kumar N, Wong J, Li L, Wilson DC, Moore R, McClanahan TK, Sadekova S, and Klappenbach JA, Multiplexed quantification of proteins and transcripts in single cells, Nature Biotechnology 35, 936 (2017). - PubMed
    1. Chen W, Li Y, Easton J, Finkelstein D, Wu G, and Chen X, UMI-count modeling and differential expression analysis for single-cell rna sequencing, Genome Biology 19, 70 (2018). - PMC - PubMed
    1. Huang M, Wang J, Torre E, Dueck H, Shaffer S, Bonasio R, Murray JI, Raj A, Li M, and Zhang NR, SAVER: gene expression recovery for single-cell RNA sequencing, Nature Methods 15, 539 (2018). - PMC - PubMed

Substances

LinkOut - more resources