. 2020 Sep 22;142(12):1132-1147.
doi: 10.1161/CIRCULATIONAHA.120.046822. Epub 2020 Aug 3.

US Mortality Attributable to Congenital Heart Disease Across the Lifespan From 1999 Through 2017 Exposes Persistent Racial/Ethnic Disparities

Affiliations

US Mortality Attributable to Congenital Heart Disease Across the Lifespan From 1999 Through 2017 Exposes Persistent Racial/Ethnic Disparities

Keila N Lopez et al. Circulation. .

Abstract

Background: Congenital heart disease (CHD) accounts for ≈40% of deaths in US children with birth defects. Previous US data from 1999 to 2006 demonstrated an overall decrease in CHD mortality. Our study aimed to assess current trends in US mortality related to CHD from infancy to adulthood over the past 19 years and determine differences by sex and race/ethnicity.

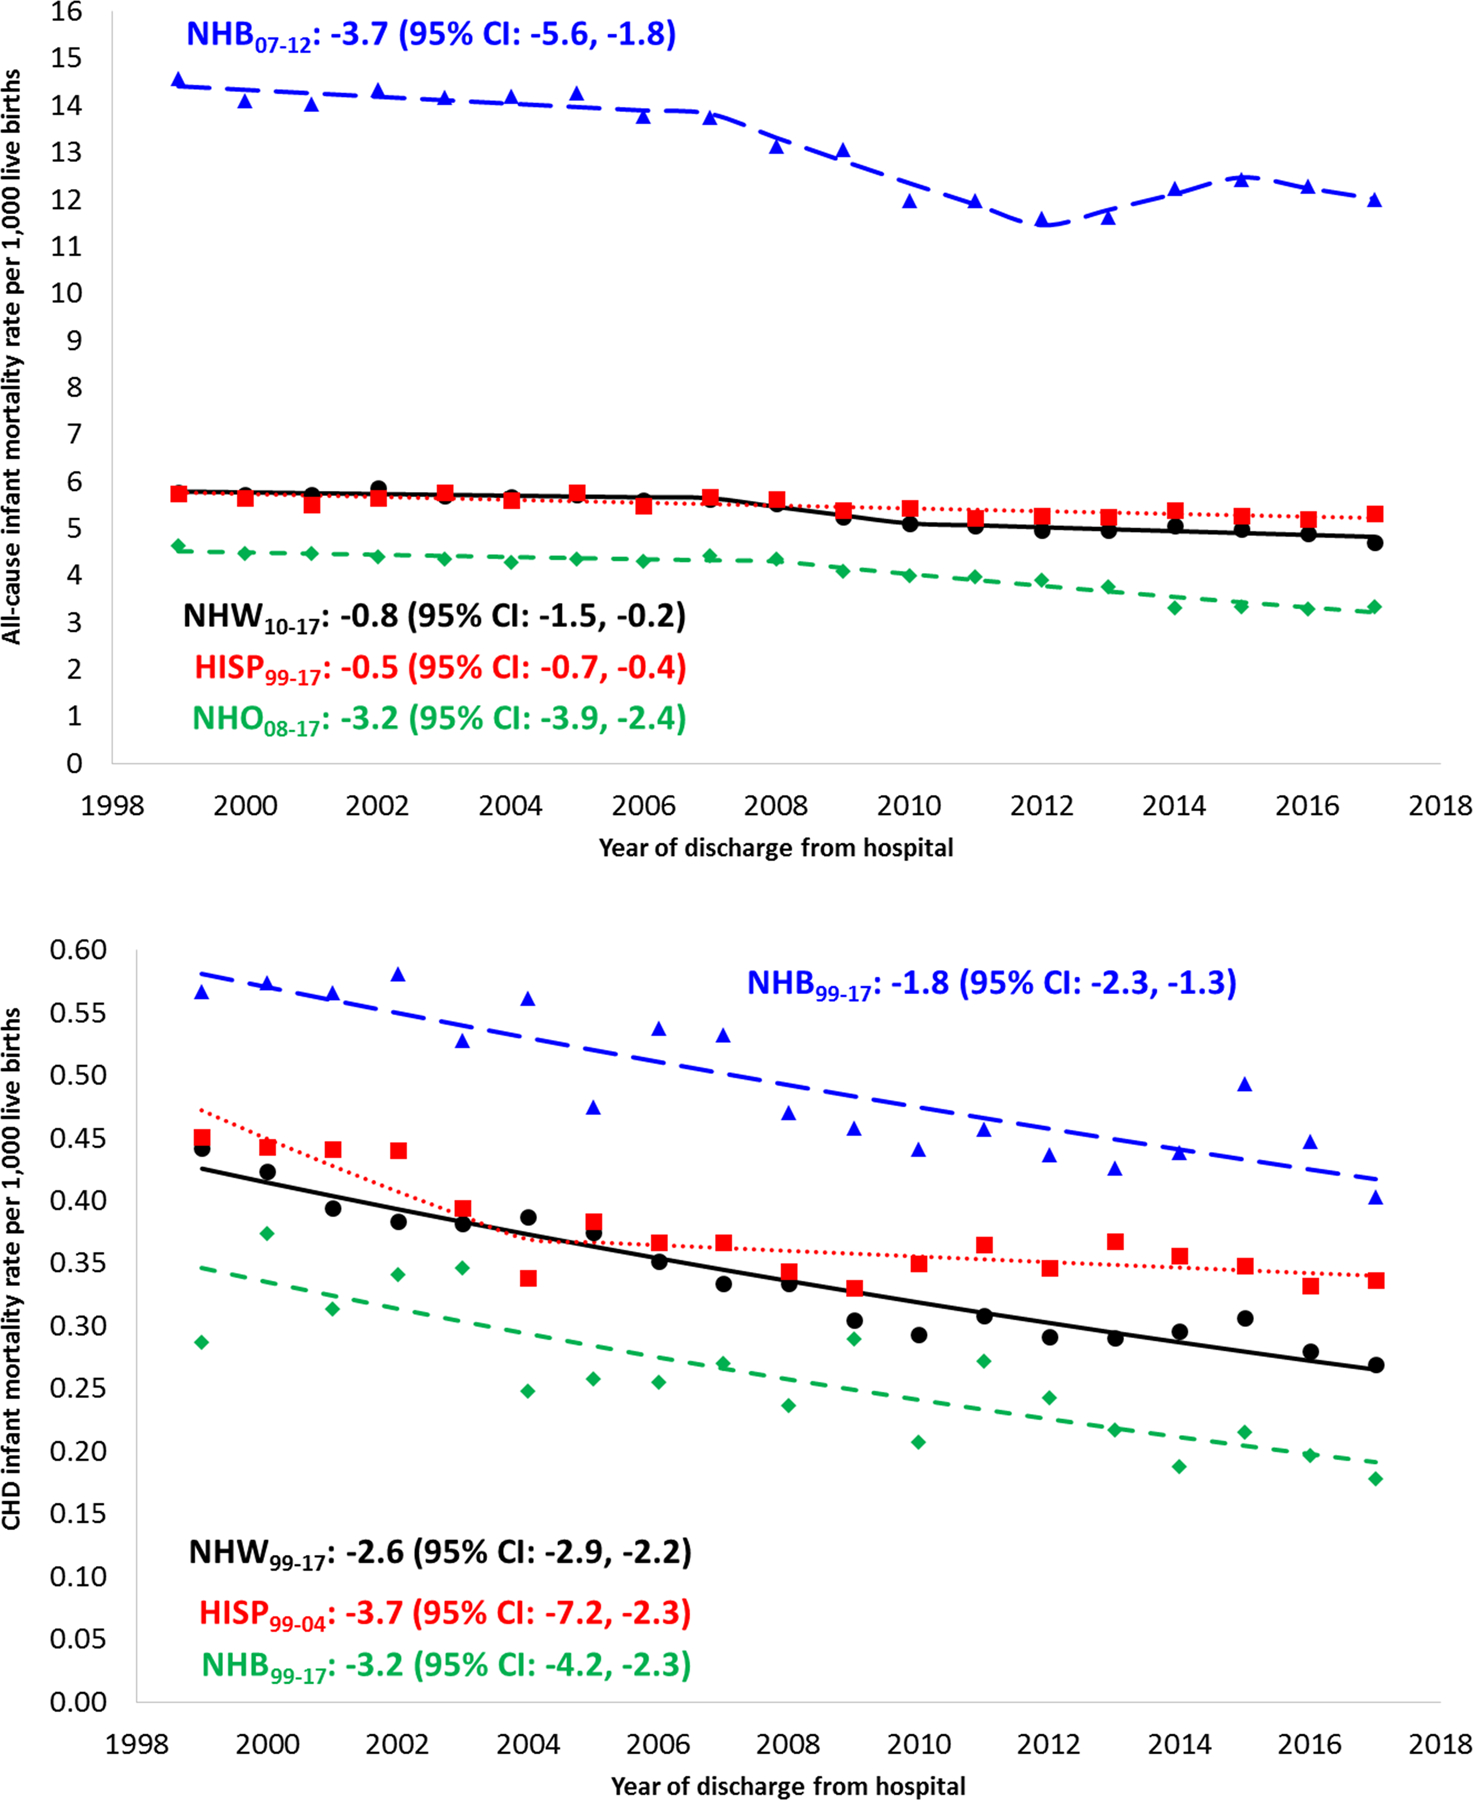
Methods: We conducted an analysis of death certificates from 1999 to 2017 to calculate annual CHD mortality by age at death, race/ethnicity, and sex. Population estimates used as denominators in mortality rate calculations for infants were based on National Center for Health Statistics live birth data. Mortality rates in individuals ≥1 year of age used US Census Bureau bridged-race population estimates as denominators. We used joinpoint regression to characterize temporal trends in all-cause mortality, mortality resulting directly attributable to and related to CHD by age, race/ethnicity, and sex.

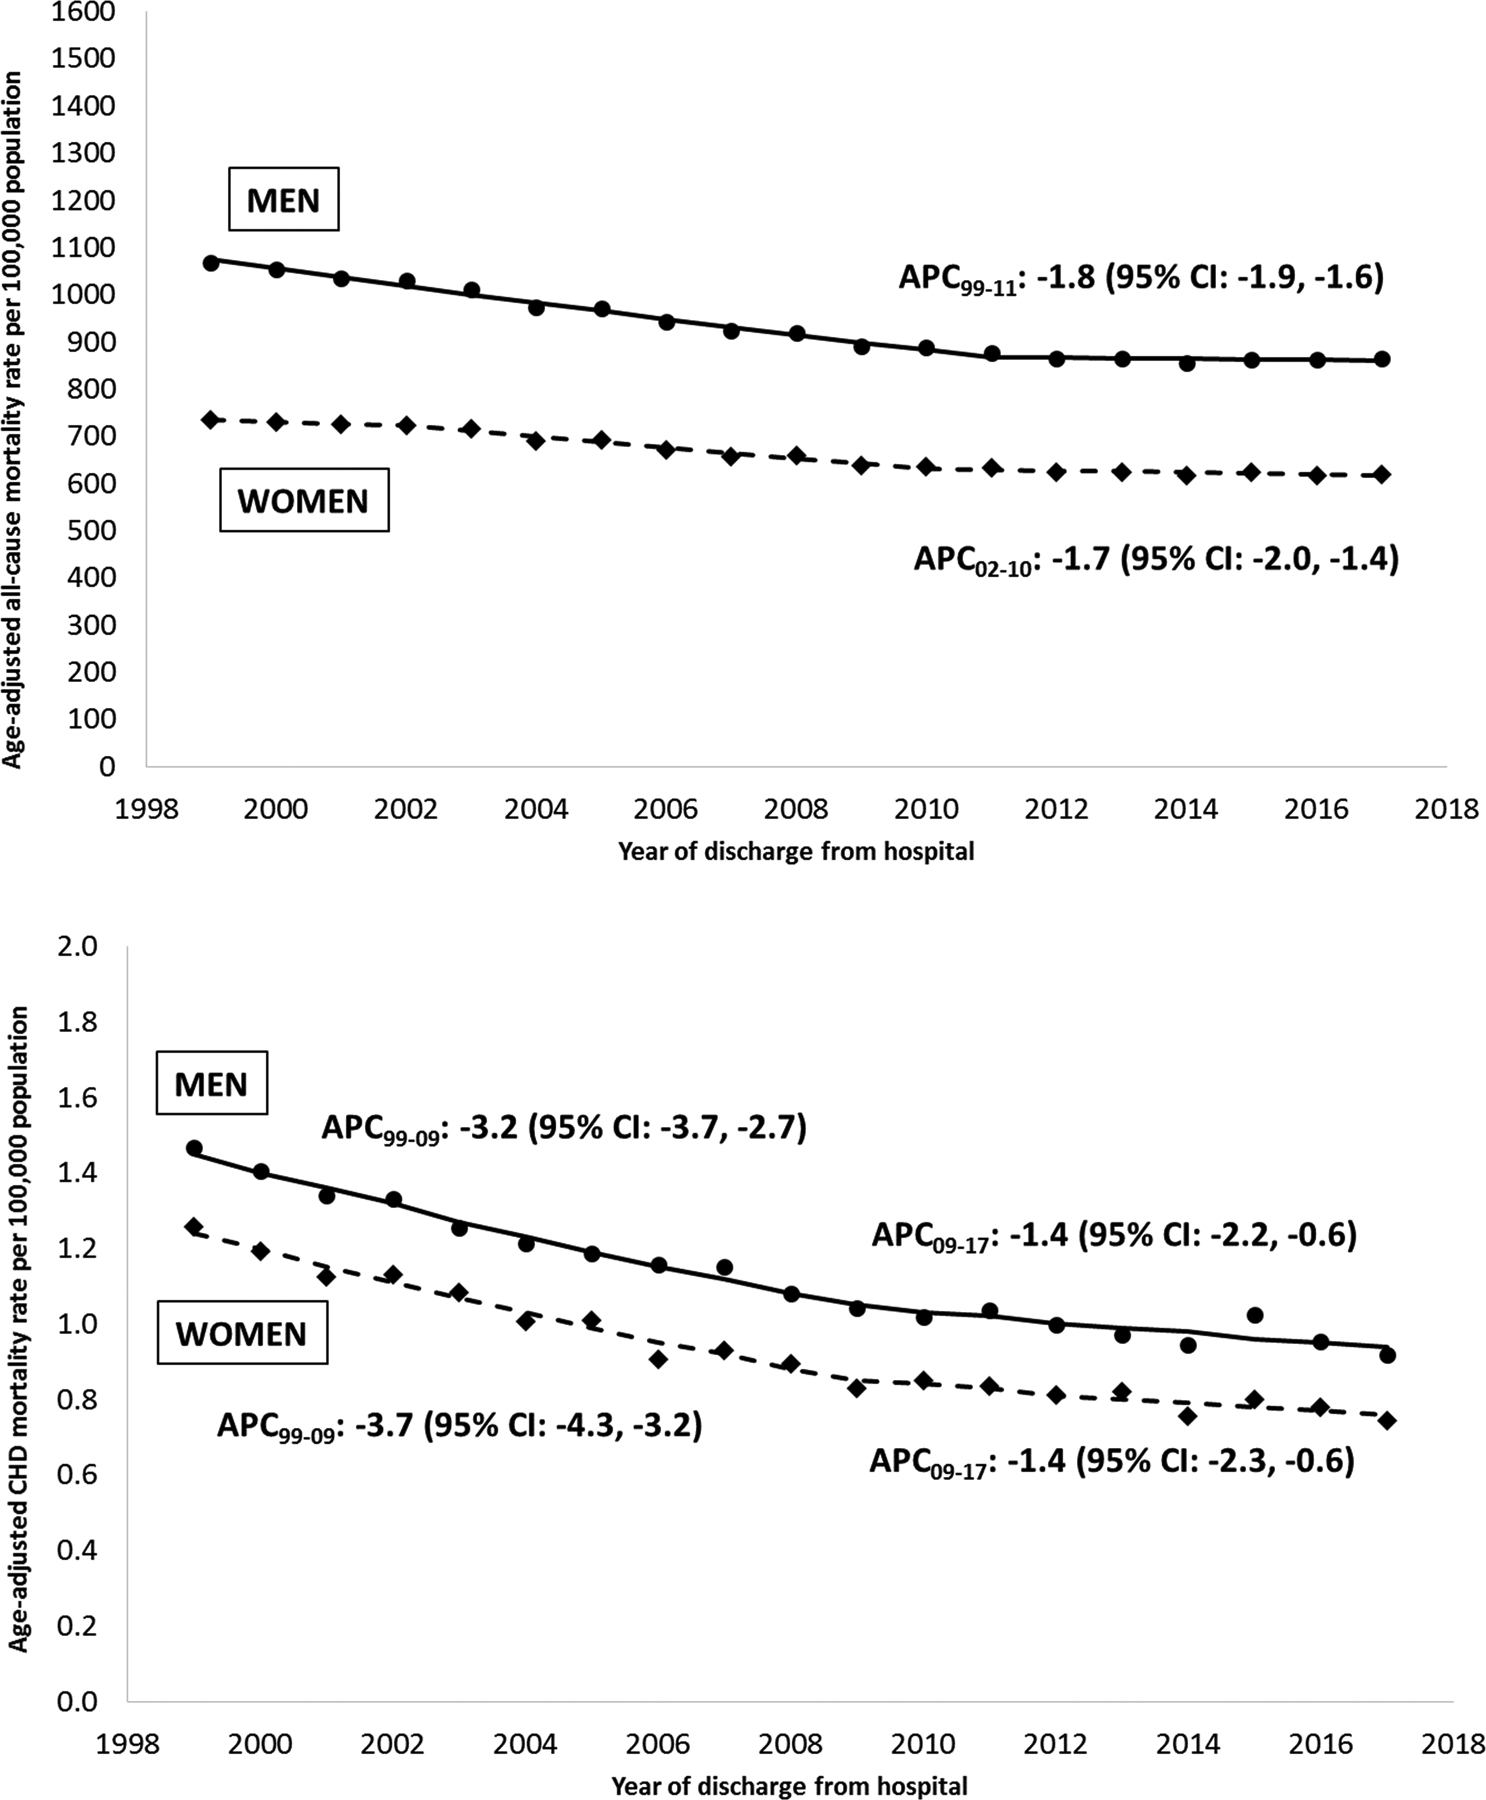
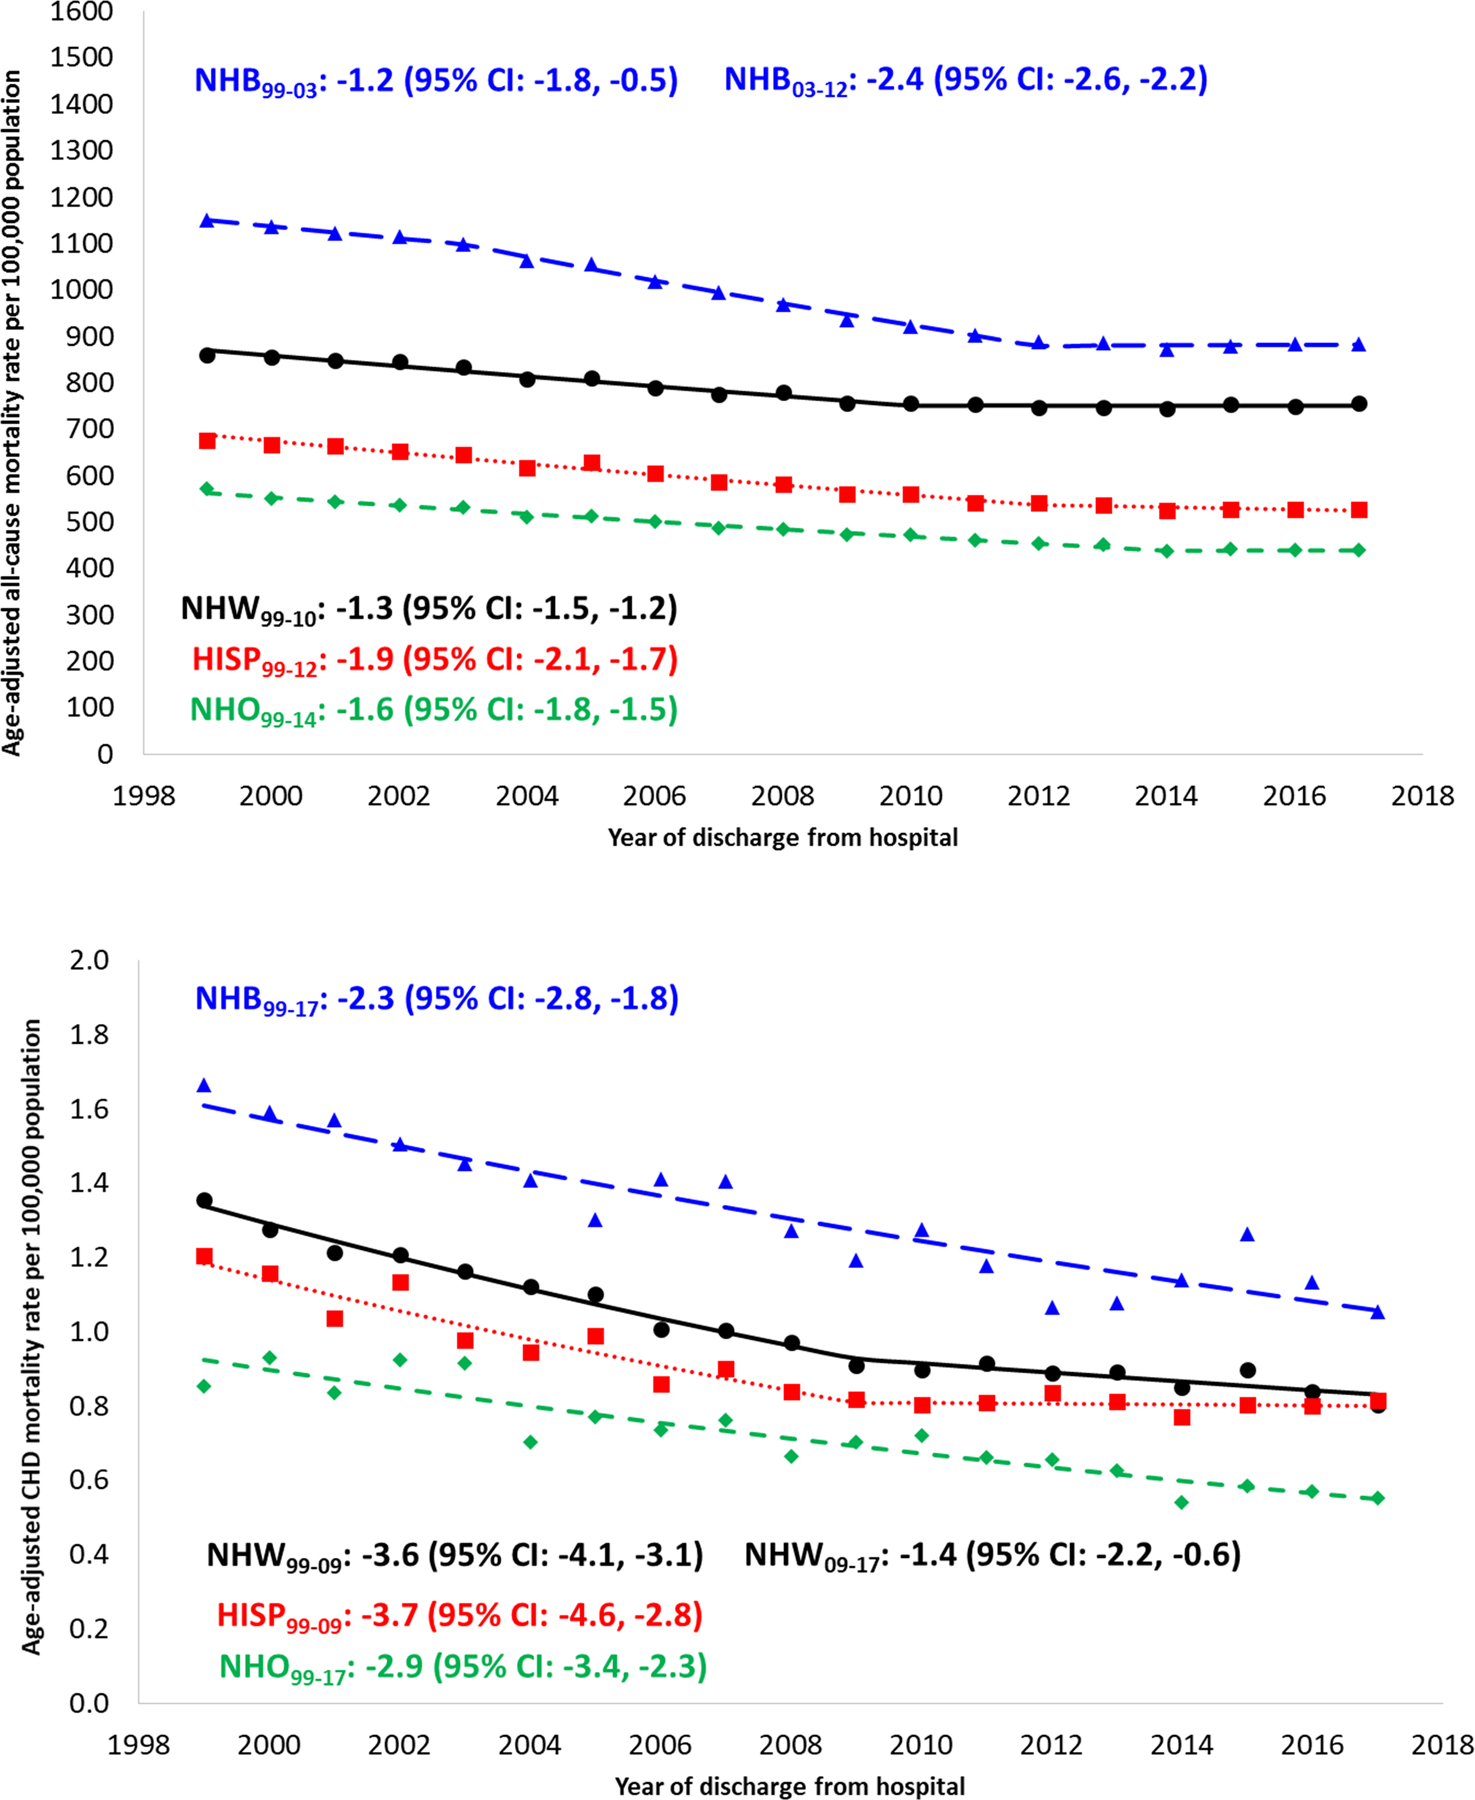
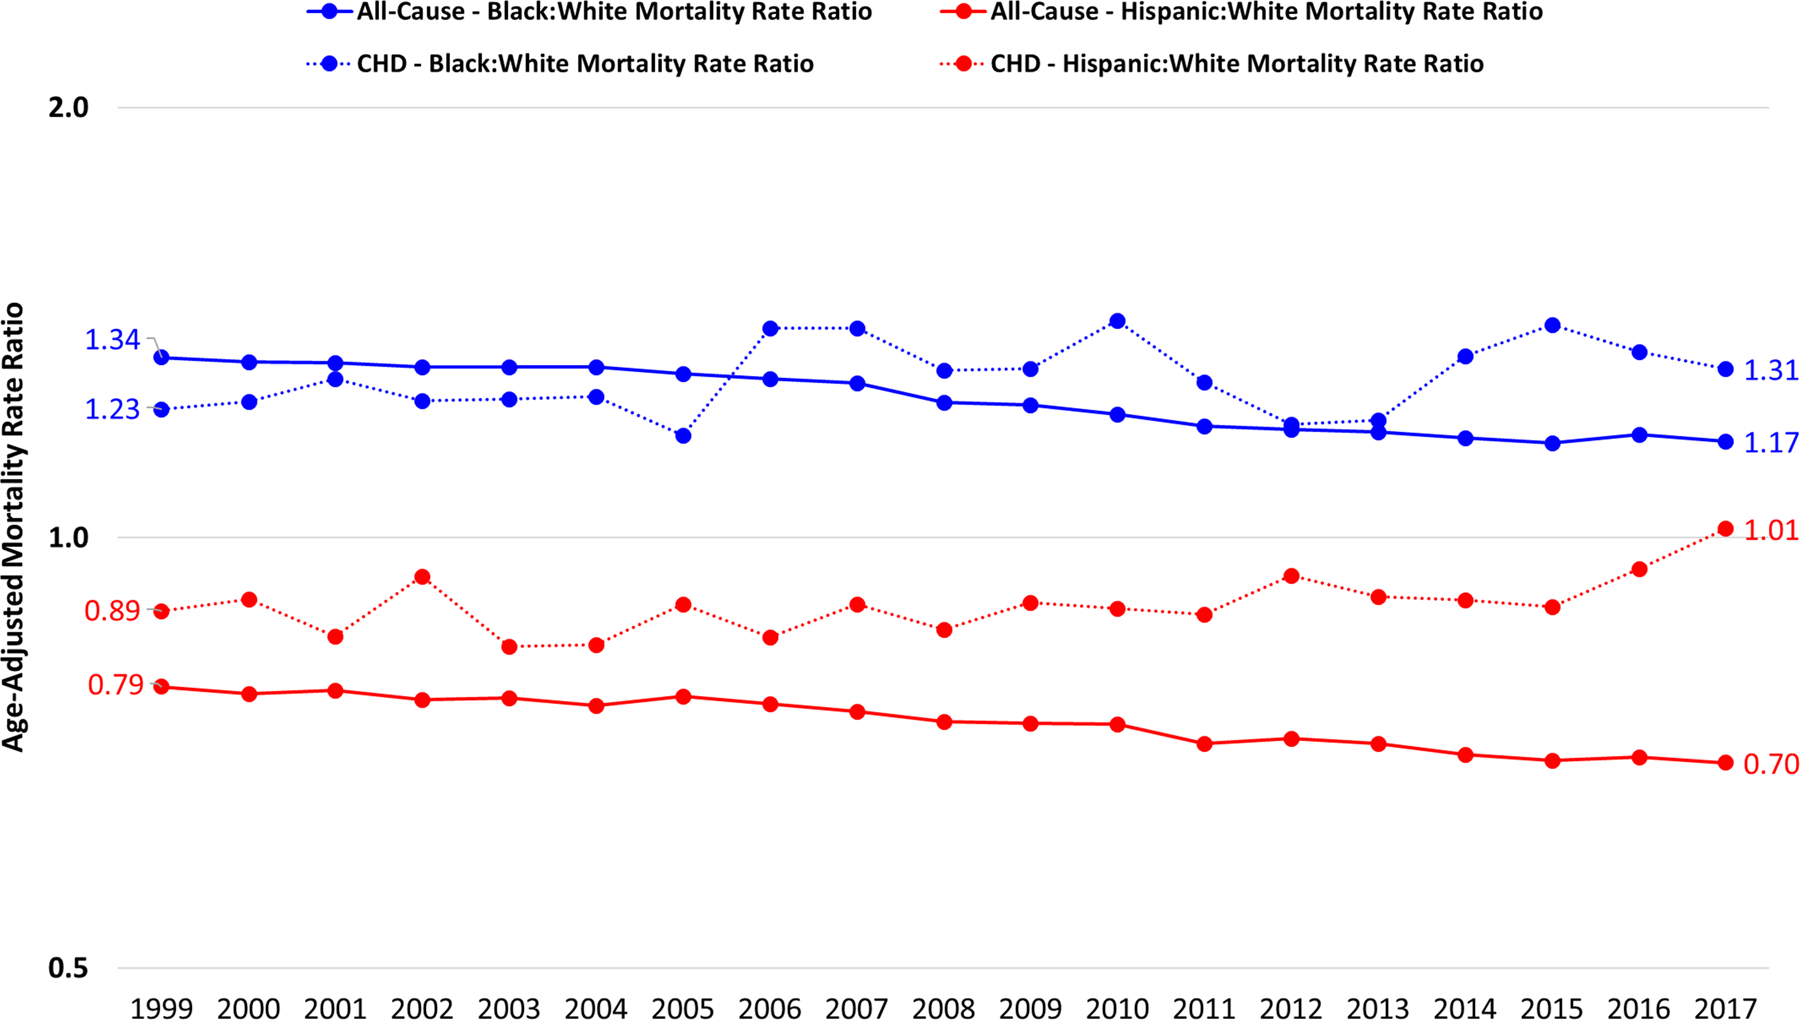
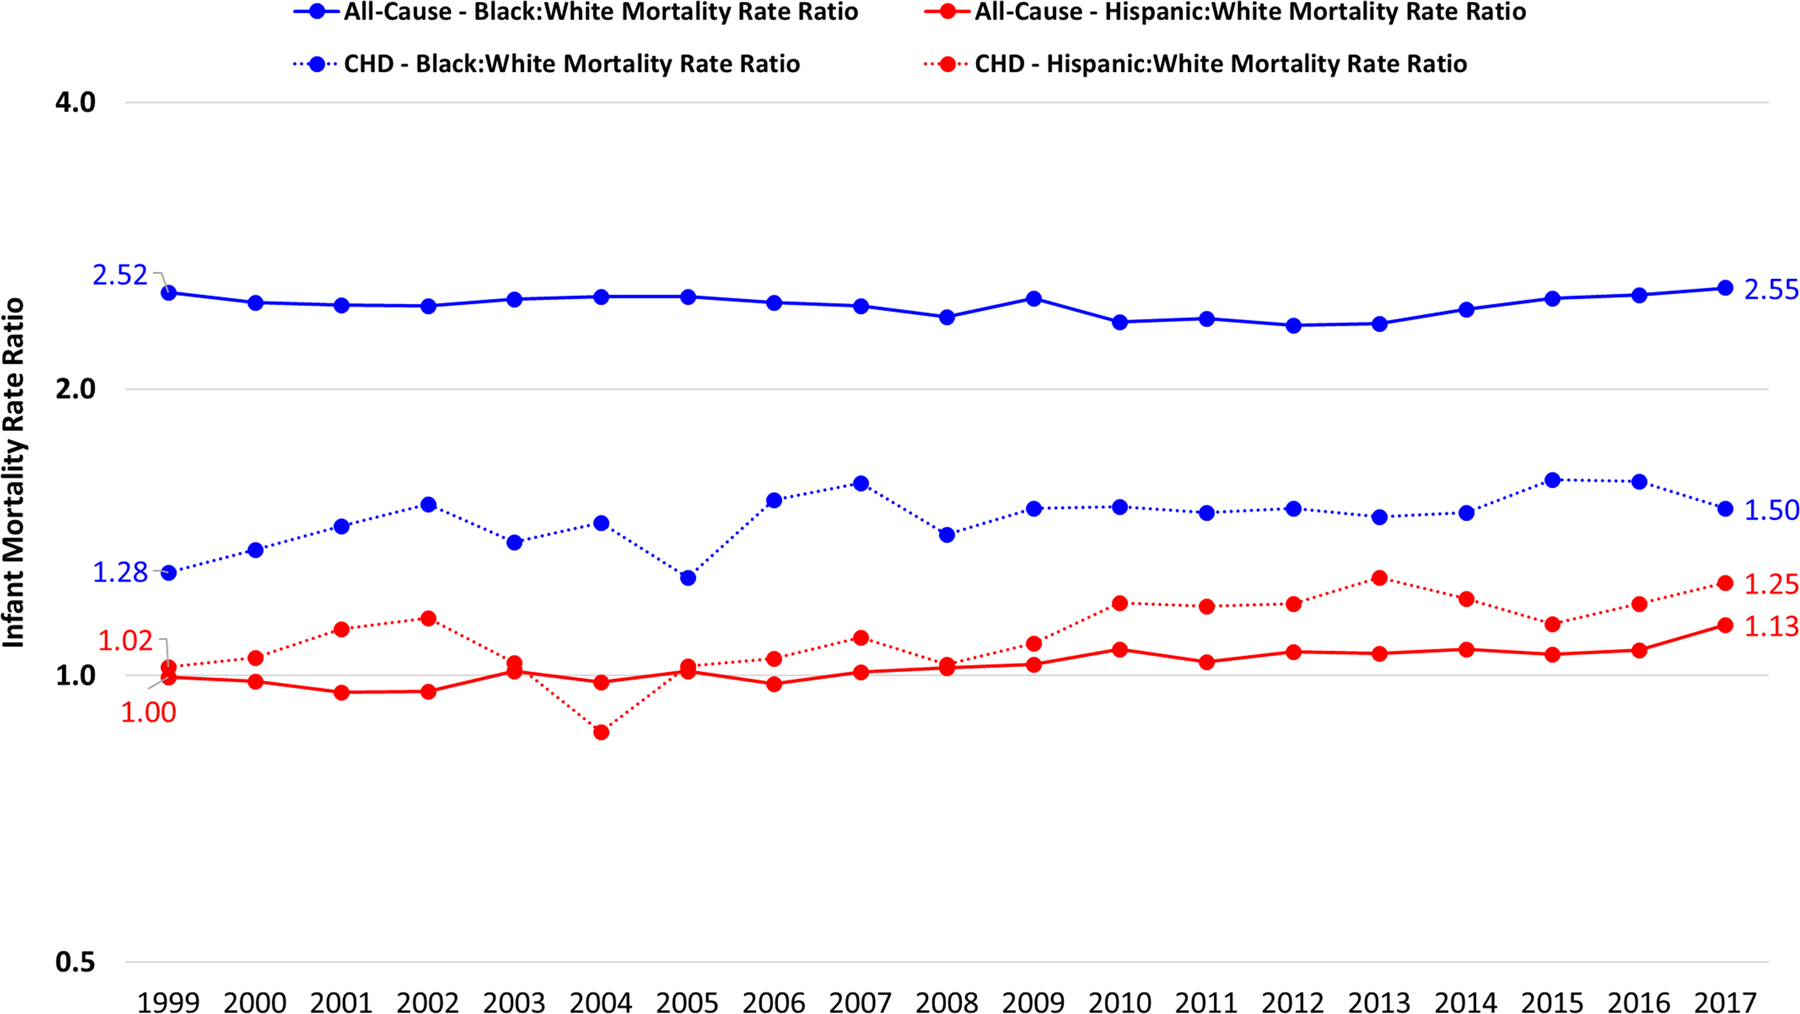
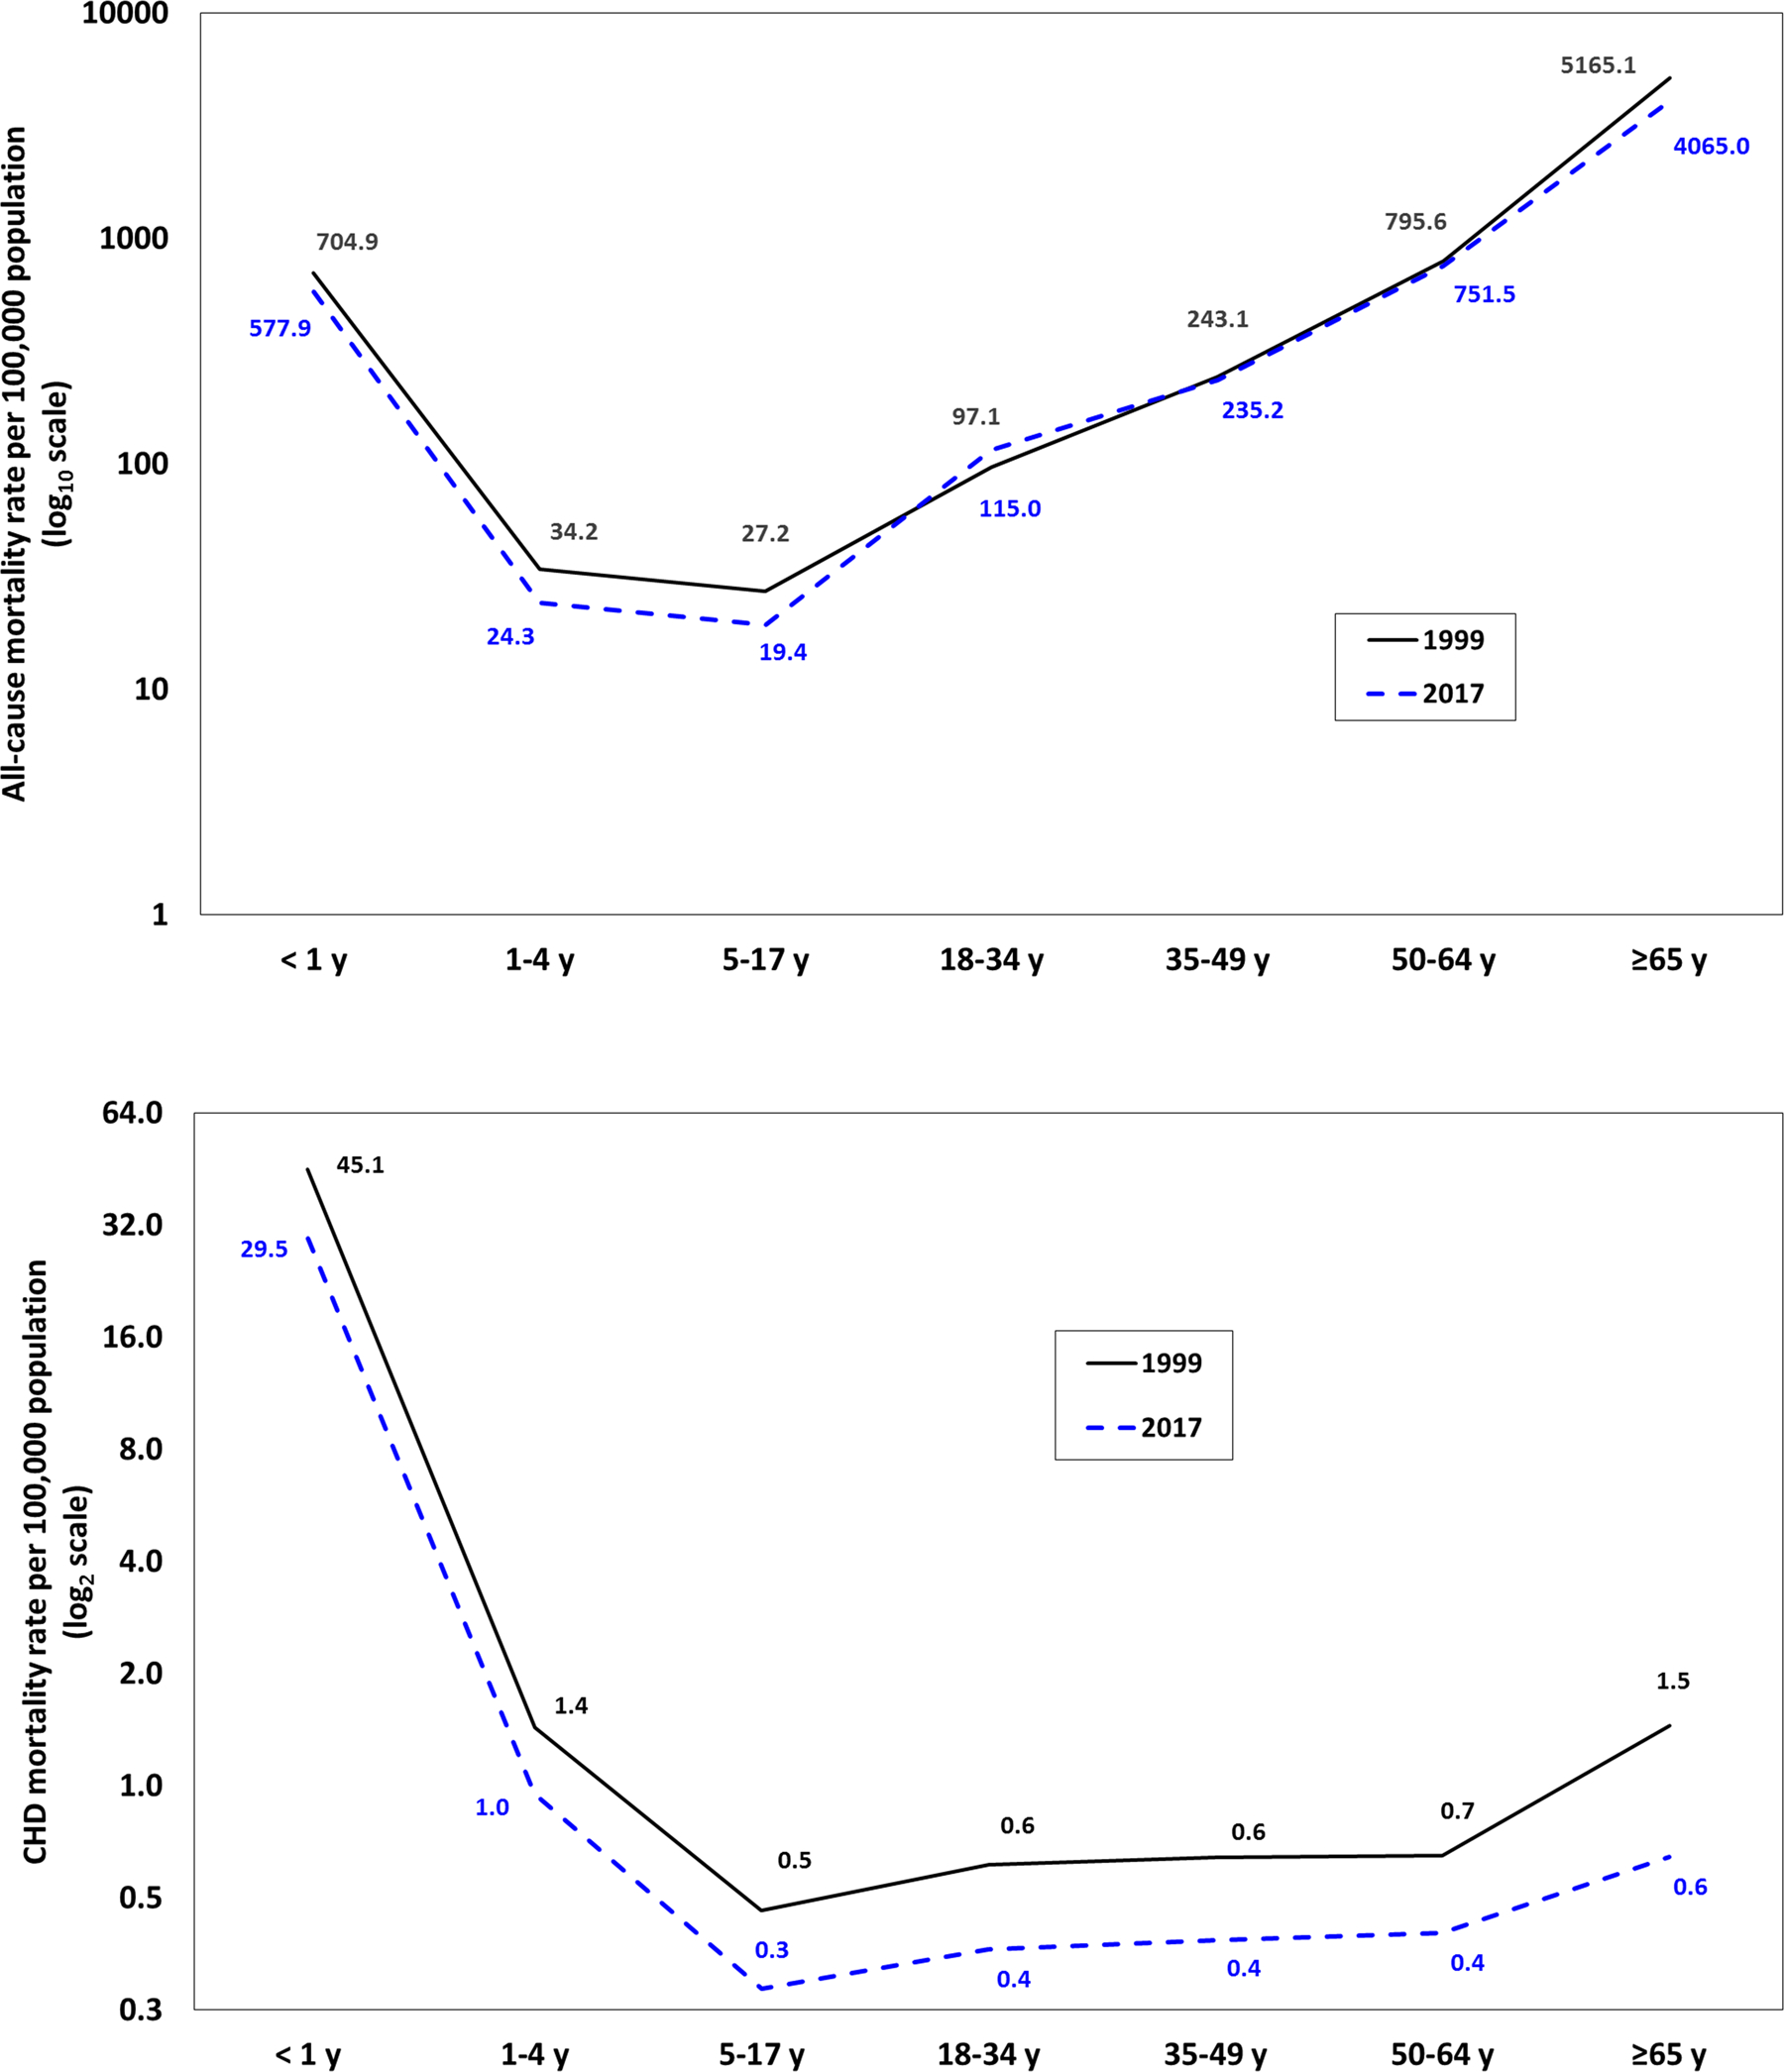
Results: There were 47.7 million deaths with 1 in 814 deaths attributable to CHD (n=58 599). Although all-cause mortality decreased 16.4% across all ages, mortality resulting from CHD declined 39.4% overall. The mean annual decrease in CHD mortality was 2.6%, with the largest decrease for those >65 years of age. The age-adjusted mortality rate decreased from 1.37 to 0.83 per 100 000. Males had higher mortality attributable to CHD than females throughout the study, although both sexes declined at a similar rate (≈40% overall), with a 3% to 4% annual decrease between 1999 and 2009, followed by a slower annual decrease of 1.4% through 2017. Mortality resulting from CHD significantly declined among all races/ethnicities studied, although disparities in mortality persisted for non-Hispanic Blacks versus non-Hispanic Whites (mean annual decrease 2.3% versus 2.6%, respectively; age-adjusted mortality rate 1.67 to 1.05 versus 1.35 to 0.80 per 100 000, respectively).

Conclusions: Although overall US mortality attributable to CHD has decreased over the past 19 years, disparities in mortality persist for males in comparison with females and for non-Hispanic Blacks in comparison with non-Hispanic Whites. Determining factors that contribute to these disparities such as access to quality care, timely diagnosis, and maintenance of insurance will be important moving into the next decade.

Keywords: healthcare disparities; heart diseases; longevity; mortality.


Conflict of interest statement

DISCLOSURES

The authors have no financial relationships relevant to this article to disclose.

Figures

Figure 1.
Figure 1.. Temporal trends in age-adjusted all-cause mortality (top) and CHD-specific mortality (bottom), by sex, 1999–2017
Footnotes: APC, annual percent change; CHD, congenital heart defect Only APCs that reflect a statistically significant temporal trend in mortality are presented as text. Differences by gender: Tests of parallelism revealed men and women had non-parallel regression mean functions for all-cause mortality (p=0.008) and CHD-specific mortality (p=0.004). Differences by cause: Tests of parallelism revealed no differences between all-cause and CHD-specific mortality for either men (p=0.420) or women (p=0.158).
Figure 2.
Figure 2.. Temporal trends in age-adjusted all-cause mortality (top) and CHD-specific mortality (bottom), by race/ethnicity, 1999–2017
Footnotes: APC, annual percent change; CHD, congenital heart defect Only APCs that reflect a statistically significant temporal trend in mortality are presented as text. Differences by race/ethnicity: Tests of parallelism revealed that NH blacks (p<0.001), Hispanics (p<0.001), and NH other (p=0.005) had non-parallel regression mean functions for all-cause mortality compared to NH whites. NH blacks (p=0.029) and Hispanics (p=0.024) had non-parallel regression mean functions for CHD-specific mortality compared to NH whites. NH other did not have regression lines that departed from parallelism compared to NH whites (p=0.089). Differences by cause: Tests of parallelism revealed no differences between all-cause and CHD-specific mortality for either NH whites (p=0.206), NH blacks (p=0.432), Hispanics (p=0.511), or NH other (p=0.162).
Figure 3.
Figure 3.. Age-standardized mortality rate ratios, all ages, 1999–2017
Footnotes: Rate ratios were calculated as the age-standadrized mortality rate in one racial/ethnic group (e.g., non-Hispanic blacks) divided by the age-standadrized mortality rate in the reference racial/ethnic group (e.g., non-Hispanic whites). This was done separately for all-cause mortality and mortality due to CHD.
Figure 4.
Figure 4.. Temporal trends in all-cause infant mortality (top) and CHD-specific infant mortality (bottom), by race/ethnicity, 1999–2017
Footnotes: APC, annual percent change; CHD, congenital heart defect Only APCs that reflect a statistically significant temporal trend in mortality are presented as text. Differences by race/ethnicity: Tests of parallelism revealed that Hispanics (p<0.001) and NH other (p=0.003) had non-parallel regression mean functions for all-cause mortality compared to NH whites. NH blacks did not have regression lines that departed from parallelism compared to NH whites (p=0.054). Only Hispanics (p=0.024) had a non-parallel regression mean function for CHD-specific mortality compared to NH whites. NH blacks (p=0.175) and NH other (p=0.094) did not have regression lines that departed from parallelism compared to NH whites. Differences by cause: Tests of parallelism revealed significant differences between all-cause and CHD-specific mortality for NH whites (p=0.002), Hispanics (p=0.015), or NH other (p=0.048), but not for NH blacks (p=0.051).
Figure 5.
Figure 5.. Infant mortality rate ratios, all ages, 1999–2017
Footnotes: Rate ratios were calculated as the infant mortality rate in one racial/ethnic group (e.g., non-Hispanic blacks) divided by the infant mortality rate in the reference racial/ethnic group (e.g., non-Hispanic whites). This was done separately for all-cause infant mortality and infant mortality due to CHD.
Figure 6.
Figure 6.. All-cause mortality (top) and CHD-specific mortality (bottom), by age group, 1999 and 2017
Footnotes: Due to the large differences in the magnitude of all-cause versus CHD-specific mortality rates, to visualize and compare their respective distributions by age, all-cause mortality rates were plotted on the Y-axis with a log base 10 transformation (common logarithm), whereas CHD-specific mortality rates were plotted on the Y-axis with a log base 2 transformation (binary logarithm).

References

    1. Yang Q, Khoury MJ, Mannino D. Trends and patterns of mortality associated with birth defects and genetic diseases in the United States, 1979–1992: An analysis of multiple-cause mortality data. Genet Epidemiol. 1997;14:493–505. - PubMed
    1. Petrini J, Damus K, Johnston RB. An overview of infant mortality and birth defects in the United States. Teratology. 1997;56:8–10. - PubMed
    1. Roncancio CP, Misnaza SP, Peña IC, Prieto FE, Cannon MJ, Valencia D. Trends and characteristics of fetal and neonatal mortality due to congenital anomalies, Colombia 1999–2008. J Maternal-fetal Neonatal Medicine Official J European Assoc Périnat Medicine Fed Asia Ocean Périnat Soc Int Soc Périnat Obstetricians. 2017;31:1748–1755. - PMC - PubMed
    1. World Health Organization. Global Health Estimates 2016: Disease Burden by Cause, Age, Sex, by Country and by Region 2000–2016. https://www.who.int/healthinfo/global_burden_disease/GlobalDALY_method_2... Published, Geneva, 2018. Accessed May 15, 2019.
    1. Gilboa SM, Salemi JL, Nembhard WN, Fixler DE, Correa A. Mortality Resulting From Congenital Heart Disease Among Children and Adults in the United States, 1999 to 2006. Circulation. 2010;122:2254–2263. - PMC - PubMed

Publication types