. 2020 Oct 13;142(15):1448-1463.
doi: 10.1161/CIRCULATIONAHA.119.045115. Epub 2020 Jul 30.

High-Resolution Transcriptomic Profiling of the Heart During Chronic Stress Reveals Cellular Drivers of Cardiac Fibrosis and Hypertrophy

Affiliations

High-Resolution Transcriptomic Profiling of the Heart During Chronic Stress Reveals Cellular Drivers of Cardiac Fibrosis and Hypertrophy

Micheal A McLellan et al. Circulation. .

Abstract

Background: Cardiac fibrosis is a key antecedent to many types of cardiac dysfunction including heart failure. Physiological factors leading to cardiac fibrosis have been recognized for decades. However, the specific cellular and molecular mediators that drive cardiac fibrosis, and the relative effect of disparate cell populations on cardiac fibrosis, remain unclear.

Methods: We developed a novel cardiac single-cell transcriptomic strategy to characterize the cardiac cellulome, the network of cells that forms the heart. This method was used to profile the cardiac cellular ecosystem in response to 2 weeks of continuous administration of angiotensin II, a profibrotic stimulus that drives pathological cardiac remodeling.

Results: Our analysis provides a comprehensive map of the cardiac cellular landscape uncovering multiple cell populations that contribute to pathological remodeling of the extracellular matrix of the heart. Two phenotypically distinct fibroblast populations, Fibroblast-Cilp and Fibroblast-Thbs4, emerged after induction of tissue stress to promote fibrosis in the absence of smooth muscle actin-expressing myofibroblasts, a key profibrotic cell population. After angiotensin II treatment, Fibroblast-Cilp develops as the most abundant fibroblast subpopulation and the predominant fibrogenic cell type. Mapping intercellular communication networks within the heart, we identified key intercellular trophic relationships and shifts in cellular communication after angiotensin II treatment that promote the development of a profibrotic cellular microenvironment. Furthermore, the cellular responses to angiotensin II and the relative abundance of fibrogenic cells were sexually dimorphic.

Conclusions: These results offer a valuable resource for exploring the cardiac cellular landscape in health and after chronic cardiovascular stress. These data provide insights into the cellular and molecular mechanisms that promote pathological remodeling of the mammalian heart, highlighting early transcriptional changes that precede chronic cardiac fibrosis.

Keywords: fibroblasts; fibrosis; heart failure.


Conflict of interest statement

None.

Figures

Figure 1.
Figure 1.
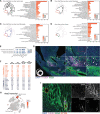
Isolation and analysis of the cardiac cellulome by scRNA-seq. A, Schematic outline of the experimental procedure for the isolation and analysis of adult mouse cardiomyocytes and nonmyocytes by scRNA-seq. B, t-SNE projection of cardiac cells analyzed by scRNA-seq. Cells are colored by distinct cell populations as indicated. Note, the relative abundance of cell types displayed does not represent in vivo proportions (see Figure 1A and Expanded Methods in the Data Supplement). C, Heat map of relative expression of canonical cell markers in major cardiac cell populations. D, Top 5 distinct genes for each cell population, identified using an unsupervised approach. Dot color and size indicate the relative average expression level and the proportion of cells expressing the gene, respectively, within each cell population (also see Table I in the Data Supplement). DAPI indicates 4′,6-diamidino-2-phenylindole; DC, dendritic cells; ECs, endothelial cells; FACS, fluorescence-activated cell sorting; FSC-A, forward scatter area; lymph., lymphatic; NK, natural killer; and t-SNE, t-distributed stochastic neighbor embedding;
Figure 2.
Figure 2.
Histological and cellular changes in the heart after induction of cardiac fibrosis. A, Experimental schema for AngII-mediated induction of cardiac fibrosis. Female and male mice were infused with AngII or saline (control) continuously for 2 weeks. B, Representative micrograph of trichrome-stained cardiac sections from mice infused with saline (Left) or AngII (Right). Example images shown are from female mice. C, Change in total cardiac area and cardiac fibrosis with and without induction of fibrosis in females and males (n=4–5 animals per group). Total cardiac area and fibrosis was quantified using high-resolution images of trichrome-stained midventricular sections as shown in B (also see Figure V in the Data Supplement). The entire cardiac section was used for measurements (see Expanded Methods in the Data Supplement). P values shown on plot are derived from the Wilcoxon rank sum test for differences between the groups. Whiskers of box and whisker plots represent highest and lowest value, except when a value is beyond the range of 1.5 interquartile. D, Fast Fourier transform–accelerated interpolation–based t-distributed stochastic neighbor (FIt-SNE) plot of cardiac cell clusters identified using single-cell transcriptional profiles of cells from mouse hearts with and without induction of fibrosis. In addition to the cell populations presented in B, this figure demonstrates more granular clustering of several major clusters (eg, fibroblasts, macrophages) and 2 additional populations (dendritic-like cells [DLC] and proliferating mesenchymal cells [Prolif. mes. cell]). E, FIt-SNE embedding projections of cardiac cells isolated from control (Top) and from fibrosis-induced (Bottom) mice. In the plot, reduced dimensionality space is divided into bins, and hexagons are colored according to mean Periostin (Postn) gene expression (red=high, gray=low) of cells in each bin to avoid distortion of patterns through overplotting. F, Change in proportion of selected cell populations in the single-cell RNA sequencing data set with and without fibrosis induction. Control mice include mice implanted with saline osmotic pumps (see the Methods section) and those that had not undergone any surgical interventions. Figure VI in the Data Supplement shows results for all cell populations. AngII indicates angiotensin II; NK, natural killer; and smc, smooth muscle cell.
Figure 3.
Figure 3.
Gene expression changes in cardiac cell populations. A, Lollipop plot summarizing number of up- and downregulated genes (uncorrected P<0.01) in AngII-treated mouse heart cells relative to control cohorts (see Table III in the Data Supplement). Note: We detected a statistically significant correlation between cell population size and number of differentially expressed genes discovered (Figure X in the Data Supplement). B, Dot plot summarizing the expression of genes identified as within the top 10 genes upregulated in response to AngII administration, for each cell type. Dot color and size are proportional to average expression within each cell cluster and fold increase in AngII cells relative to control cells, respectively. Black points at the centers of some dots indicate a significant difference in gene expression in response to AngII (uncorrected P<0.01). C, Sankey plot summarizing the top 3 GO terms for upregulated genes of each cell type (corrected P<0.05). Connections indicate GO terms associated with each cell type (see Table IV in the Data Supplement). Note: (1) many cell types upregulate genes that are associated with the same GO terms, consistent with a specific and choreographed response to a cardiac stressor; (2) not all cell types have 3 GO terms associated with their upregulated genes, (3) Fibroblast-Cilp and Fibroblast-Thbs4 are excluded from this differential expression analysis because they are nearly absent in unstressed hearts. AngII indicates angiotensin II; card. cardiac; GO, gene ontology; pos. positive; reg., regulation; resp., response; and ventri., ventricular.
Figure 4.
Figure 4.
Distinguishing features of fibrosis-associated fibroblasts. A, GO terms enriched in a set of genes derived from comparing gene expression differences between Fibroblast-Cilp and Fibroblast-Thbs4 vs all other control cells. x axis indicates the number of genes mapped to each GO term, and color indicates the adjusted P value from GO enrichment analysis. Outline of FIt-SNE projection shown on Figure 2D, Left, indicates Fibroblast-Cilp and Fibroblast-Thbs4 population (red) being compared with other cells (black; see Tables V and VI in the Data Supplement). B, Presentation of GO terms as in A, but associated with a comparison of Fibroblast-Cilp and Fibroblast-Thbs4 vs fibroblasts from control mice. C, Presentation of GO terms as in A, but associated with a comparison of Fibroblast-Cilp and Fibroblast-Thbs4 vs fibroblasts from AngII-treated mice. Purple FIt-SNE outline indicates AngII-fibroblasts being compared with Fibroblast-Cilp and Fibroblast-Thbs4. D, Presentation of GO terms as in A, but associated with a comparison of Fibroblast-Cilp to Fibroblast-Thbs4. E, Dot plot showing expression of fibroblast genes classified within the GO categories shown on y axis. Circle size represents the sum of transcripts for genes corresponding to each GO term within each cell population. See Figure XII in the Data Supplement for transcript levels of all cell types. F, Top 10 genes enriched for specific expression in either Fibroblast-Cilp (dark blue) or Fibroblast-Thbs4 (orange) cell populations. Columns show average expression in each cell population expressed as either normalized read counts (in units of unique molecular identifiers per 10 000; columns 2–3) or percentage of cells with nonzero expression of the gene (columns 4–5). G, Micrograph showing AngII-treated mouse heart section stained with anti-THBS4 antibody, wheat-germ agglutinin (WGA; to identify cell boundaries and fibrosis), and DAPI (nuclei). Figure insets indicate regions without fibrosis (i and i′); dense THBS4+ fibrosis (ii) and perivascular fibrosis without THBS4 staining (iii and iii′). Region with discrete THBS4+ cells is also shown (ii′). Scale bar, 100 µm. Comparable staining was performed on >4 AngII-treated mouse hearts. See Figure XIII in the Data Supplement for control micrographs. H, FIt-SNE plot with cells colored according to Acta2 transcript abundance (red=high, gray=low). Red outline indicates Fibroblast-Cilp and Fibroblast-Thbs4 population. I, Micrograph labeled as in F, however with additional marker for ACTA2. Monochromatic images show intensity levels of individual fluorescence channels. Scale bar, 25 µm. Comparable staining was performed on >3 AngII-treated mouse hearts. ACTA2 indicates smooth muscle actin–expressing; Adj., adjusted; AngII, angiotensin II; DAPI, 4′,6-diamidino-2-phenylindole; FIt-SNE, fast Fourier transform–accelerated interpolation–based t-distributed stochastic neighbor embedding; GO, gene ontology; TGFbeta, transforming growth factor beta; and THBS4, thrombospondin 4.
Figure 5.
Figure 5.
Shifts in fibroblast cell state in response to chronic stress imposed by AngII treatment. A, Stream plot depicting patterns of RNA velocity in fibroblasts from mice administered AngII. Velocities were calculated using scVelo. Clustering of fibroblasts and their placement in 2-dimensional space are identical to Figure 2D. RNA velocities are projected onto this Fourier transform–accelerated interpolation–based t-distributed stochastic neighbor embedding embedding for visualization purposes. Lines with arrows depict predominating changes in velocity and their associated directionality. B, Estimation of RNA velocity for Cilp in fibroblasts from AngII-treated mice. Relative velocities are colored according to scale on the right. C. As in B, but for Postn. AngII indicates angiotensin II.
Figure 6.
Figure 6.
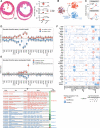
Intercellular connection network of the cardiac cellulome. A, Chord plot summarizing interconnections between different cardiac cell types from hearts of control mice. Lines represent potential interconnections between cell types, with line thickness proportional to the number of ligand-receptor pairs expressed in the connected cell types and line color reflecting the cell population producing transcript coding for the ligand. See Expanded Methods section “Ligand-receptor intercellular communication network analysis” in the Data Supplement for more details. B, Relative expression of a selection of essential growth factors across major cardiac cell types. Gene expression is normalized to the expression level of the cell type with the greatest mean expression. C, Spatial distribution of MRC1+ and MRC1 macrophages relative to the epicardium in Cx3cr1gfp/+ mouse hearts. Green fluorescent protein (white) labels both MRC1+ and MRC1 macrophages. Scale bar, 100 µm. Inset shows magnified view of the epicardium (indicated by white arrows). D, Number of receptor-ligand pairs potentially mediating cell–cell communication for each cell population with and without AngII treatment. Bar plot shows total number of connections (receiving and transmitted signals) made by each cell type without (gray bars) and with AngII treatment (orange bars; also see Table VII in the Data Supplement). Scatter plot summarizes number of upregulated receptors and ligands for each cell population (uncorrected P<0.01). Note: Dots corresponding to Schwann cells, epicardial cells, and B cells overlap because they have the same number of upregulated ligands and receptors (also see Table VIII in the Data Supplement). E, GO terms enriched in a set of genes that encode ligands upregulated after fibrosis induction. GO terms are ordered by their frequency of significant enrichment in different cardiac cell populations. F, GO terms enriched in a set of genes that encode receptors upregulated after fibrosis induction. GO terms are ordered by their frequency of significant enrichment in different cardiac cell populations (also see Table IX in the Data Supplement). AngII indicates angiotensin II; CM, cardiomyocyte; DLC, dendritic-like cell; GO, gene ontology; LEC, lymphatic endothelial cell; NK, natural killer; and SMC, smooth muscle cell.
Figure 7.
Figure 7.
Sexual dimorphic remodeling and cellular responses. A, Trichrome-stained sections from female and male hearts (Left, micrographs) and quantification of fibrosis (Right, boxplots). Plots summarize fibrosis in the left ventricles (LV), intraventricular septums (IVS), and right ventricles (RV) of male and female hearts (n=4–5 animals per group). Uncorrected P values determined using Wilcoxon rank sum test for differences between the groups. Whiskers of box-and-whisker plots represent highest and lowest value, except when a value is beyond the range of 1.5 interquartile. B, Illustration of the desegregation of female and male cells based on sex-specific gene expression. Cells are visualized as points in FIt-SNE space, identically to Figure 2D. As expected, female and male cells are each present within each cell cluster. C, Cellular abundances of Fibroblast-Cilp and Fibroblast-Thbs4 populations in females and males with and without fibrosis induction. Light gray lines indicate binomial proportion confidence intervals and are calculated using the Jeffreys interval. Individual female and male mice are indicated by red and blue dots, respectively. The y axis shows cell abundance and regression lines derived separately from female and male samples (red and blue, respectively). D, Number of sexually dimorphic genes in cardiac cell types from hearts without (control) fibrosis induction (uncorrected P<0.01). Number of genes at significantly higher levels in females and males is indicated for each cell type by red and blue circles, respectively (see Table X in the Data Supplement). E, Sexually dimorphic gene expression of genes upregulated in cardiac cells after AngII treatment. See Methods section, Figure XXII in the Data Supplement, and Tables XI and XII in the Data Supplement for details. A summary of GO terms of genes upregulated in female cells (red text) or male cells (blue text) is shown in the table (below). Note: Consistent with a positive relationship between cell number and power to detect sexually dimorphic gene expression, we observed a statistically significant correlation between cell population size and the number of sexually dimorphic genes identified (Figure XXI in the Data Supplement). F, Dot plot summarizing the expression of genes changing in a sexually dimorphic manner in response to AngII. Plot shows genes that are upregulated after AngII treatment and differentially expressed between corresponding female and male cells (uncorrected P<0.001). Dot color and size are proportional to the relative expression and relative proportion of cells expressing the gene compared between females and males. AngII indicates angiotensin II; CM, cardiomyocyte; DLC, dendritic-like cell; EC, endothelial cell; F, female; GO, gene ontology; LEC, lymphatic endothelial cell; M, male; NK, natural killer; and SMC, smooth muscle cell.

References

    1. Pinto AR, Ilinykh A, Ivey MJ, Kuwabara JT, D’Antoni ML, Debuque R, Chandran A, Wang L, Arora K, Rosenthal NA, et al. Revisiting cardiac cellular composition. Circ Res. 2016;118:400–409. doi: 10.1161/CIRCRESAHA.115.307778 - PMC - PubMed
    1. Blenck CL, Harvey PA, Reckelhoff JF, Leinwand LA. The importance of biological sex and estrogen in rodent models of cardiovascular health and disease. Circ Res. 2016;118:1294–1312. doi: 10.1161/CIRCRESAHA.116.307509 - PMC - PubMed
    1. DeLaughter DM, Bick AG, Wakimoto H, McKean D, Gorham JM, Kathiriya IS, Hinson JT, Homsy J, Gray J, Pu W, et al. Single-cell resolution of temporal gene expression during heart development. Dev Cell. 2016;39:480–490. doi: 10.1016/j.devcel.2016.10.001 - PMC - PubMed
    1. Skelly DA, Squiers GT, McLellan MA, Bolisetty MT, Robson P, Rosenthal NA, Pinto AR. Single-cell transcriptional profiling reveals cellular diversity and intercommunication in the mouse heart. Cell Rep. 2018;22:600–610. doi: 10.1016/j.celrep.2017.12.072 - PubMed
    1. Farbehi N, Patrick R, Dorison A, Xaymardan M, Janbandhu V, Wystub-Lis K, Ho JW, Nordon RE, Harvey P, et al. Single-cell expression profiling reveals dynamic flux of cardiac stromal, vascular and immune cells in health and injury. Elife. 2019;8:e43882.doi: 10.7554/eLife.43882 - PMC - PubMed

Publication types