

Comparison of methods for the detection of outliers and associated biomarkers in mislabeled omics data
- PMID: 32795265
- PMCID: PMC7646480
- DOI: 10.1186/s12859-020-03653-9
Comparison of methods for the detection of outliers and associated biomarkers in mislabeled omics data
Abstract
Background: Previous studies have reported that labeling errors are not uncommon in omics data. Potential outliers may severely undermine the correct classification of patients and the identification of reliable biomarkers for a particular disease. Three methods have been proposed to address the problem: sparse label-noise-robust logistic regression (Rlogreg), robust elastic net based on the least trimmed square (enetLTS), and Ensemble. Ensemble is an ensembled classification based on distinct feature selection and modeling strategies. The accuracy of biomarker selection and outlier detection of these methods needs to be evaluated and compared so that the appropriate method can be chosen.
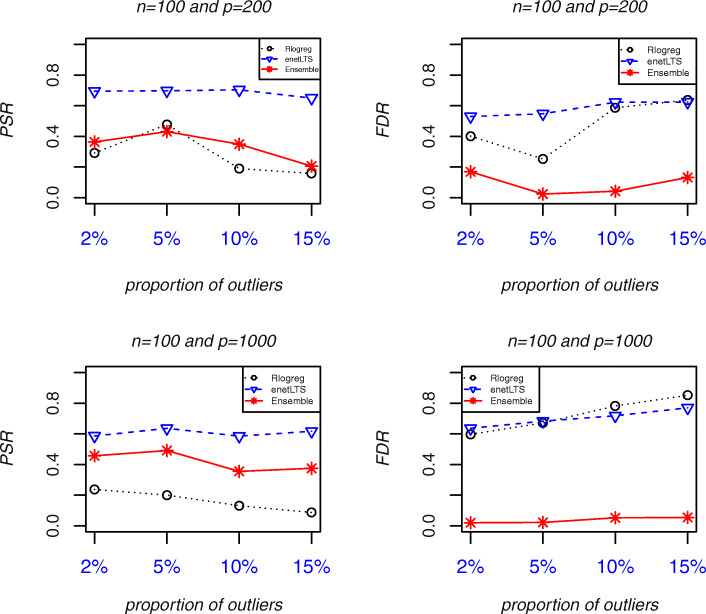
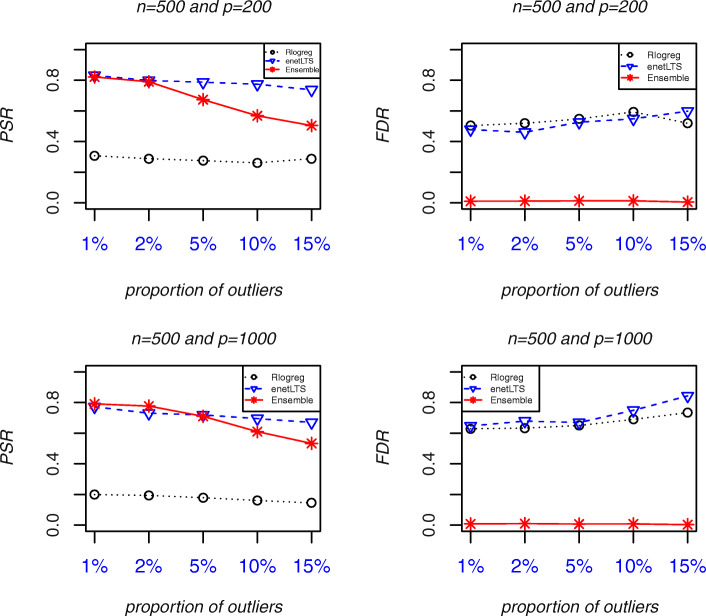
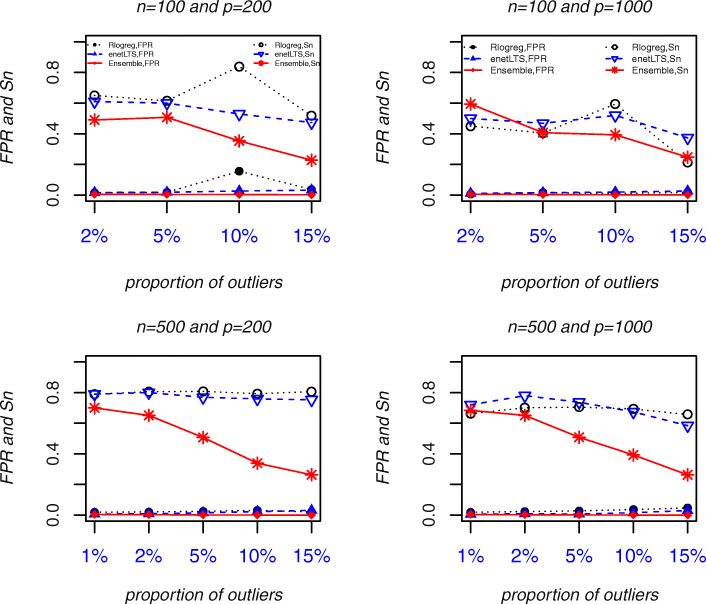
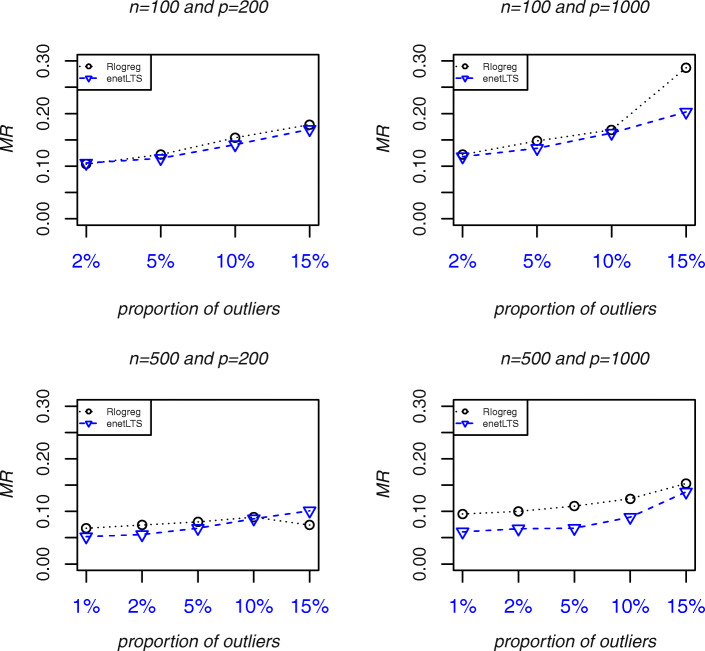
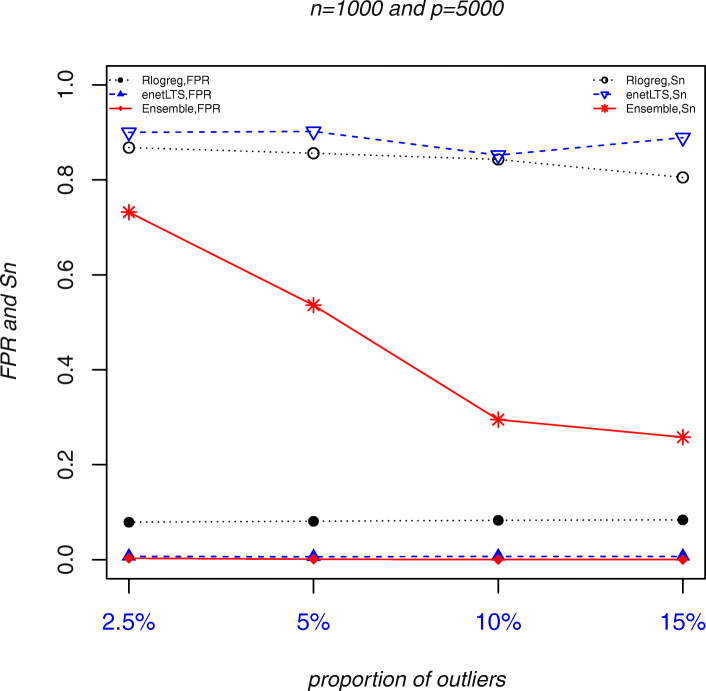
Results: The accuracy of variable selection, outlier identification, and prediction of three methods (Ensemble, enetLTS, Rlogreg) were compared for simulated and an RNA-seq dataset. On simulated datasets, Ensemble had the highest variable selection accuracy, as measured by a comprehensive index, and lowest false discovery rate among the three methods. When the sample size was large and the proportion of outliers was ≤5%, the positive selection rate of Ensemble was similar to that of enetLTS. However, when the proportion of outliers was 10% or 15%, Ensemble missed some variables that affected the response variables. Overall, enetLTS had the best outlier detection accuracy with false positive rates < 0.05 and high sensitivity, and enetLTS still performed well when the proportion of outliers was relatively large. With 1% or 2% outliers, Ensemble showed high outlier detection accuracy, but with higher proportions of outliers Ensemble missed many mislabeled samples. Rlogreg and Ensemble were less accurate in identifying outliers than enetLTS. The prediction accuracy of enetLTS was better than that of Rlogreg. Running Ensemble on a subset of data after removing the outliers identified by enetLTS improved the variable selection accuracy of Ensemble.
Conclusions: When the proportion of outliers is ≤5%, Ensemble can be used for variable selection. When the proportion of outliers is > 5%, Ensemble can be used for variable selection on a subset after removing outliers identified by enetLTS. For outlier identification, enetLTS is the recommended method. In practice, the proportion of outliers can be estimated according to the inaccuracy of the diagnostic methods used.
Keywords: Ensemble; Feature selection; Mislabeled; Rlogreg; Robust; enetLTS.
Conflict of interest statement
The authors declare that they have no competing interests.
Figures
Similar articles
-
An Efficient Algorithm for the Detection of Outliers in Mislabeled Omics Data.Comput Math Methods Med. 2021 Dec 22;2021:9436582. doi: 10.1155/2021/9436582. eCollection 2021. Comput Math Methods Med. 2021. PMID: 34976114 Free PMC article.
-
Ensemble outlier detection and gene selection in triple-negative breast cancer data.BMC Bioinformatics. 2018 May 4;19(1):168. doi: 10.1186/s12859-018-2149-7. BMC Bioinformatics. 2018. PMID: 29728051 Free PMC article.
-
ROSIE: RObust Sparse ensemble for outlIEr detection and gene selection in cancer omics data.Stat Methods Med Res. 2022 May;31(5):947-958. doi: 10.1177/09622802211072456. Epub 2022 Jan 24. Stat Methods Med Res. 2022. PMID: 35072570 Free PMC article.
-
Reviewing ensemble classification methods in breast cancer.Comput Methods Programs Biomed. 2019 Aug;177:89-112. doi: 10.1016/j.cmpb.2019.05.019. Epub 2019 May 20. Comput Methods Programs Biomed. 2019. PMID: 31319964 Review.
-
A comprehensive review of group level model performance in the presence of heteroscedasticity: Can a single model control Type I errors in the presence of outliers?Neuroimage. 2017 Feb 15;147:658-668. doi: 10.1016/j.neuroimage.2016.12.058. Epub 2016 Dec 25. Neuroimage. 2017. PMID: 28030782 Free PMC article. Review.
Cited by
-
An Efficient Algorithm for the Detection of Outliers in Mislabeled Omics Data.Comput Math Methods Med. 2021 Dec 22;2021:9436582. doi: 10.1155/2021/9436582. eCollection 2021. Comput Math Methods Med. 2021. PMID: 34976114 Free PMC article.
-
Biases in machine-learning models of human single-cell data.Nat Cell Biol. 2025 Mar;27(3):384-392. doi: 10.1038/s41556-025-01619-8. Epub 2025 Feb 19. Nat Cell Biol. 2025. PMID: 39972066 Review.
-
TidyMass an object-oriented reproducible analysis framework for LC-MS data.Nat Commun. 2022 Jul 28;13(1):4365. doi: 10.1038/s41467-022-32155-w. Nat Commun. 2022. PMID: 35902589 Free PMC article.
-
Glucose Sensing in Human Whole Blood Based on Near-Infrared Phosphors and Outlier Treatment with the Programming Language "R".ACS Omega. 2021 Dec 20;7(1):198-206. doi: 10.1021/acsomega.1c04344. eCollection 2022 Jan 11. ACS Omega. 2021. PMID: 35036691 Free PMC article.
-
EnsMOD: A Software Program for Omics Sample Outlier Detection.J Comput Biol. 2023 Jun;30(6):726-735. doi: 10.1089/cmb.2022.0243. Epub 2023 Apr 12. J Comput Biol. 2023. PMID: 37042708 Free PMC article.
References
-
- Zou H, Hastie T. Regularization and variable selection via the elastic net. Journal of the Royal Statistical Society: Series B (Statistical Methodology) 2005;67(2):301–320.
-
- Tibshirani R: Regression shrinkage and selection via the LASSO. Journal of the Royal Statistical Society: Series B (Statistical Methodology) 1996, 58:267–288.
-
- Wold S, Ruhe A, Wold H, Dunn I. WJ: the collinearity problem in linear regression. The partial least squares (PLS) approach to generalized inverses. SIAM J Sci Stat Comput. 1984;5(3):735–743.
-
- Bootkrajang J, Kaban A. Classification of mislabelled microarrays using robust sparse logistic regression. Bioinformatics. 2013;29(7):870–877. - PubMed
-
- Zhang C, Wu C, Blanzieri E, Zhou Y, Wang Y, Du W, Liang Y. Methods for labeling error detection in microarrays based on the effect of data perturbation on the regression model. Bioinformatics. 2009;25(20):2708–2714. - PubMed
MeSH terms
Substances
Grants and funding
LinkOut - more resources
Full Text Sources
