. 2020 Sep 14;38(3):334-349.e9.
doi: 10.1016/j.ccell.2020.07.008. Epub 2020 Aug 13.

Integrated Metabolic and Epigenomic Reprograming by H3K27M Mutations in Diffuse Intrinsic Pontine Gliomas

Affiliations

Integrated Metabolic and Epigenomic Reprograming by H3K27M Mutations in Diffuse Intrinsic Pontine Gliomas

Chan Chung et al. Cancer Cell. .

Abstract

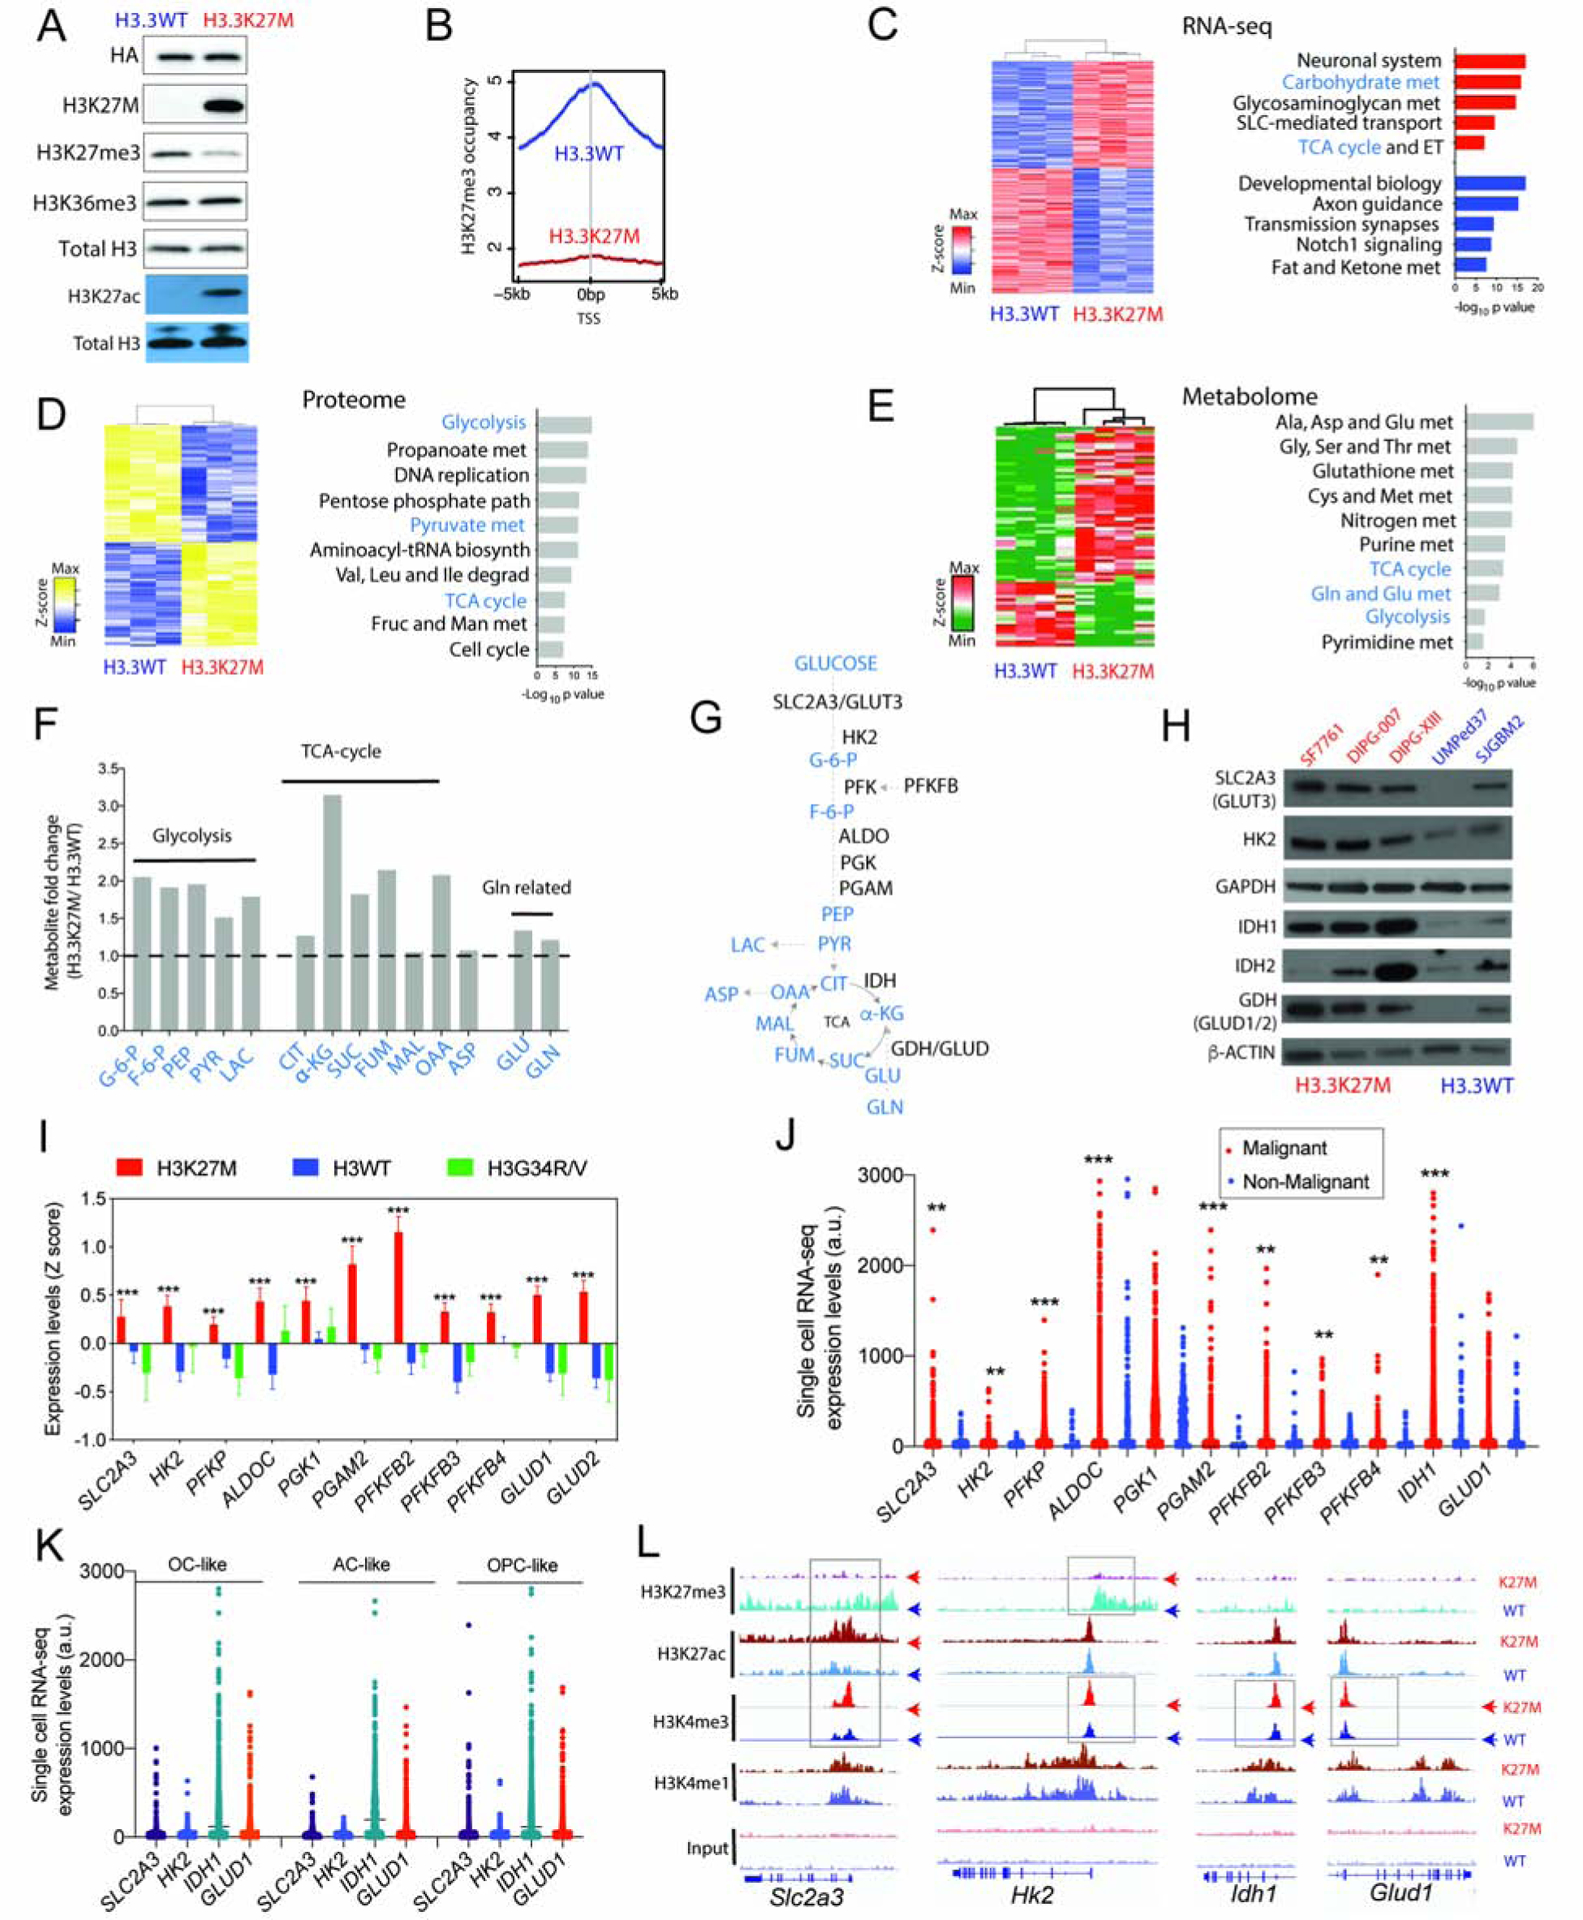
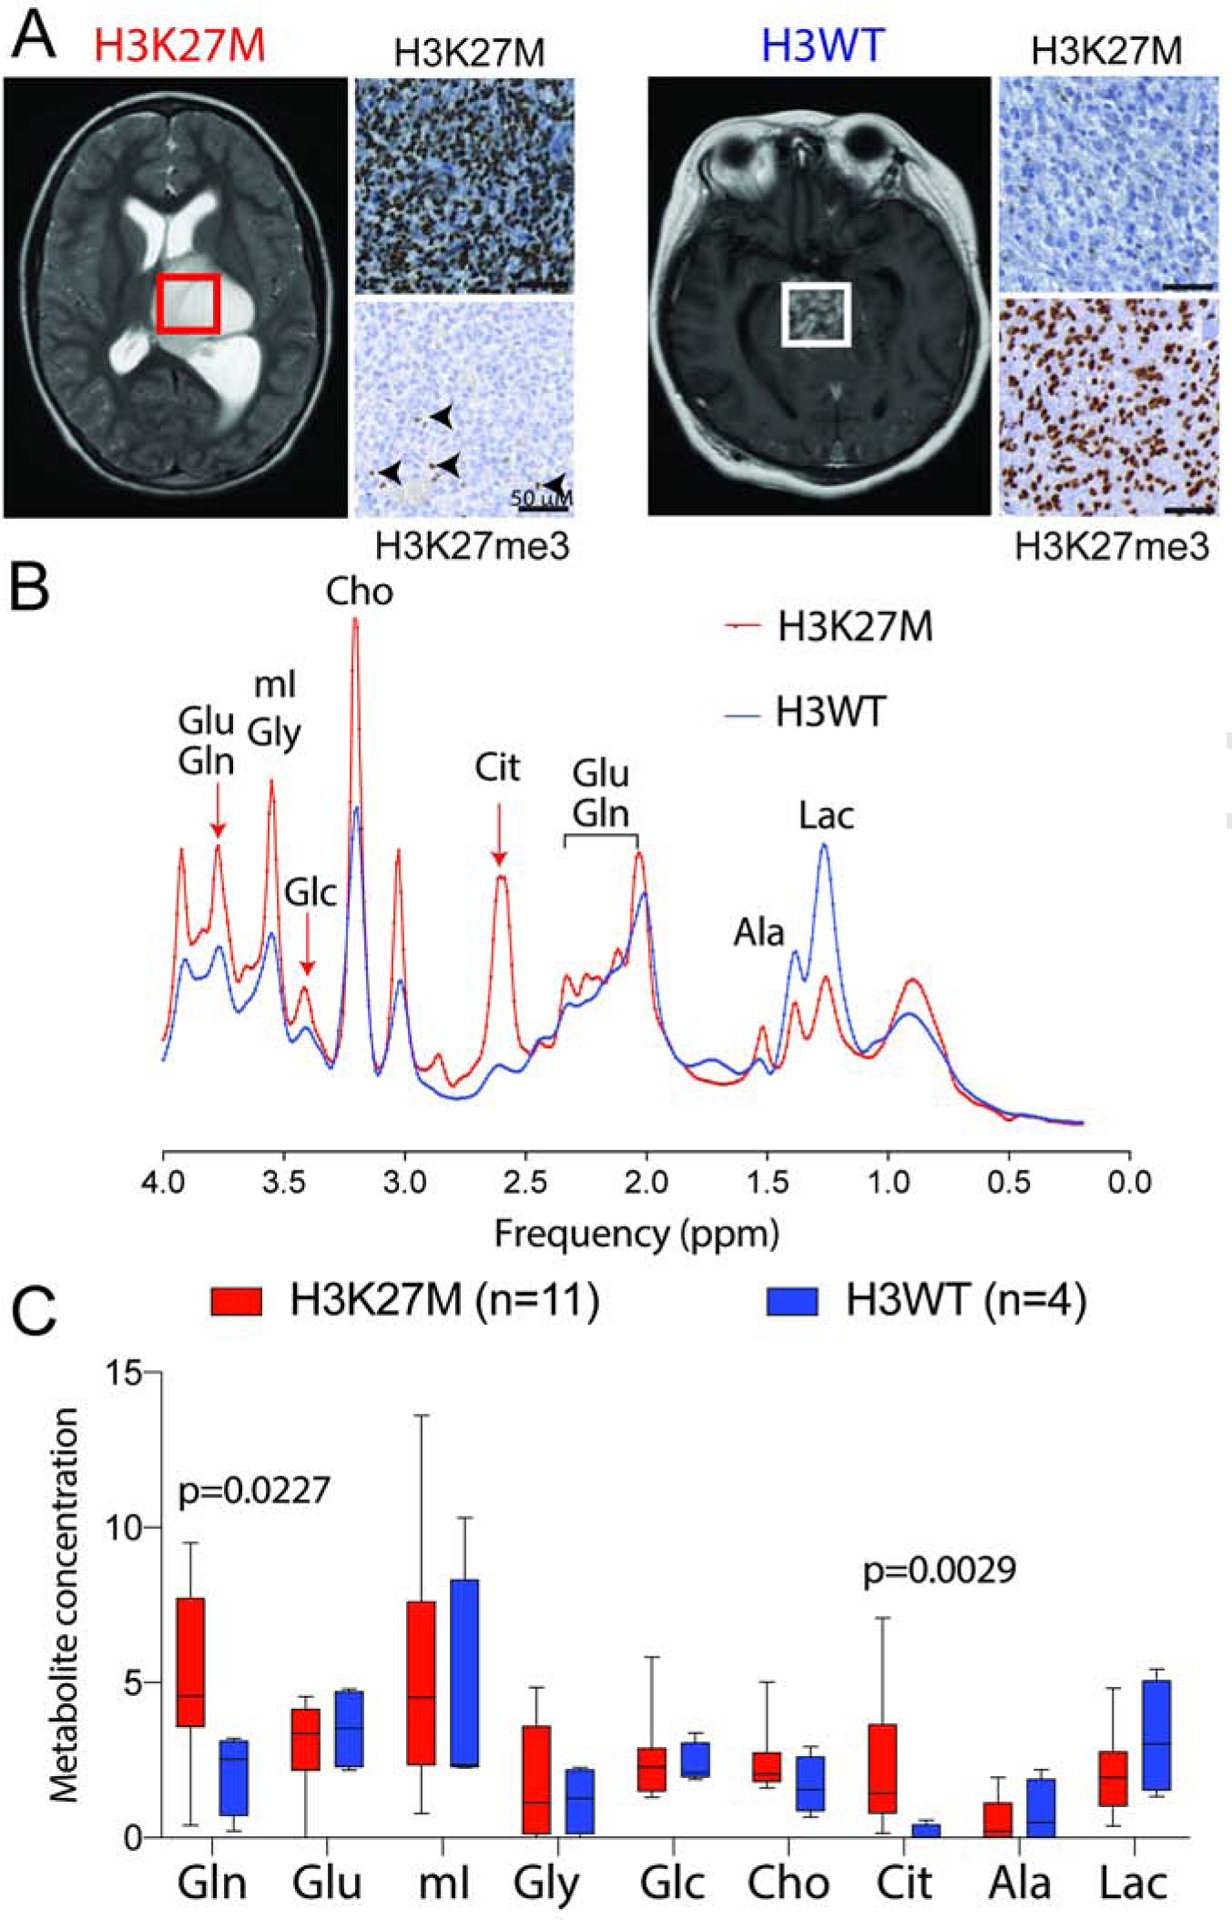
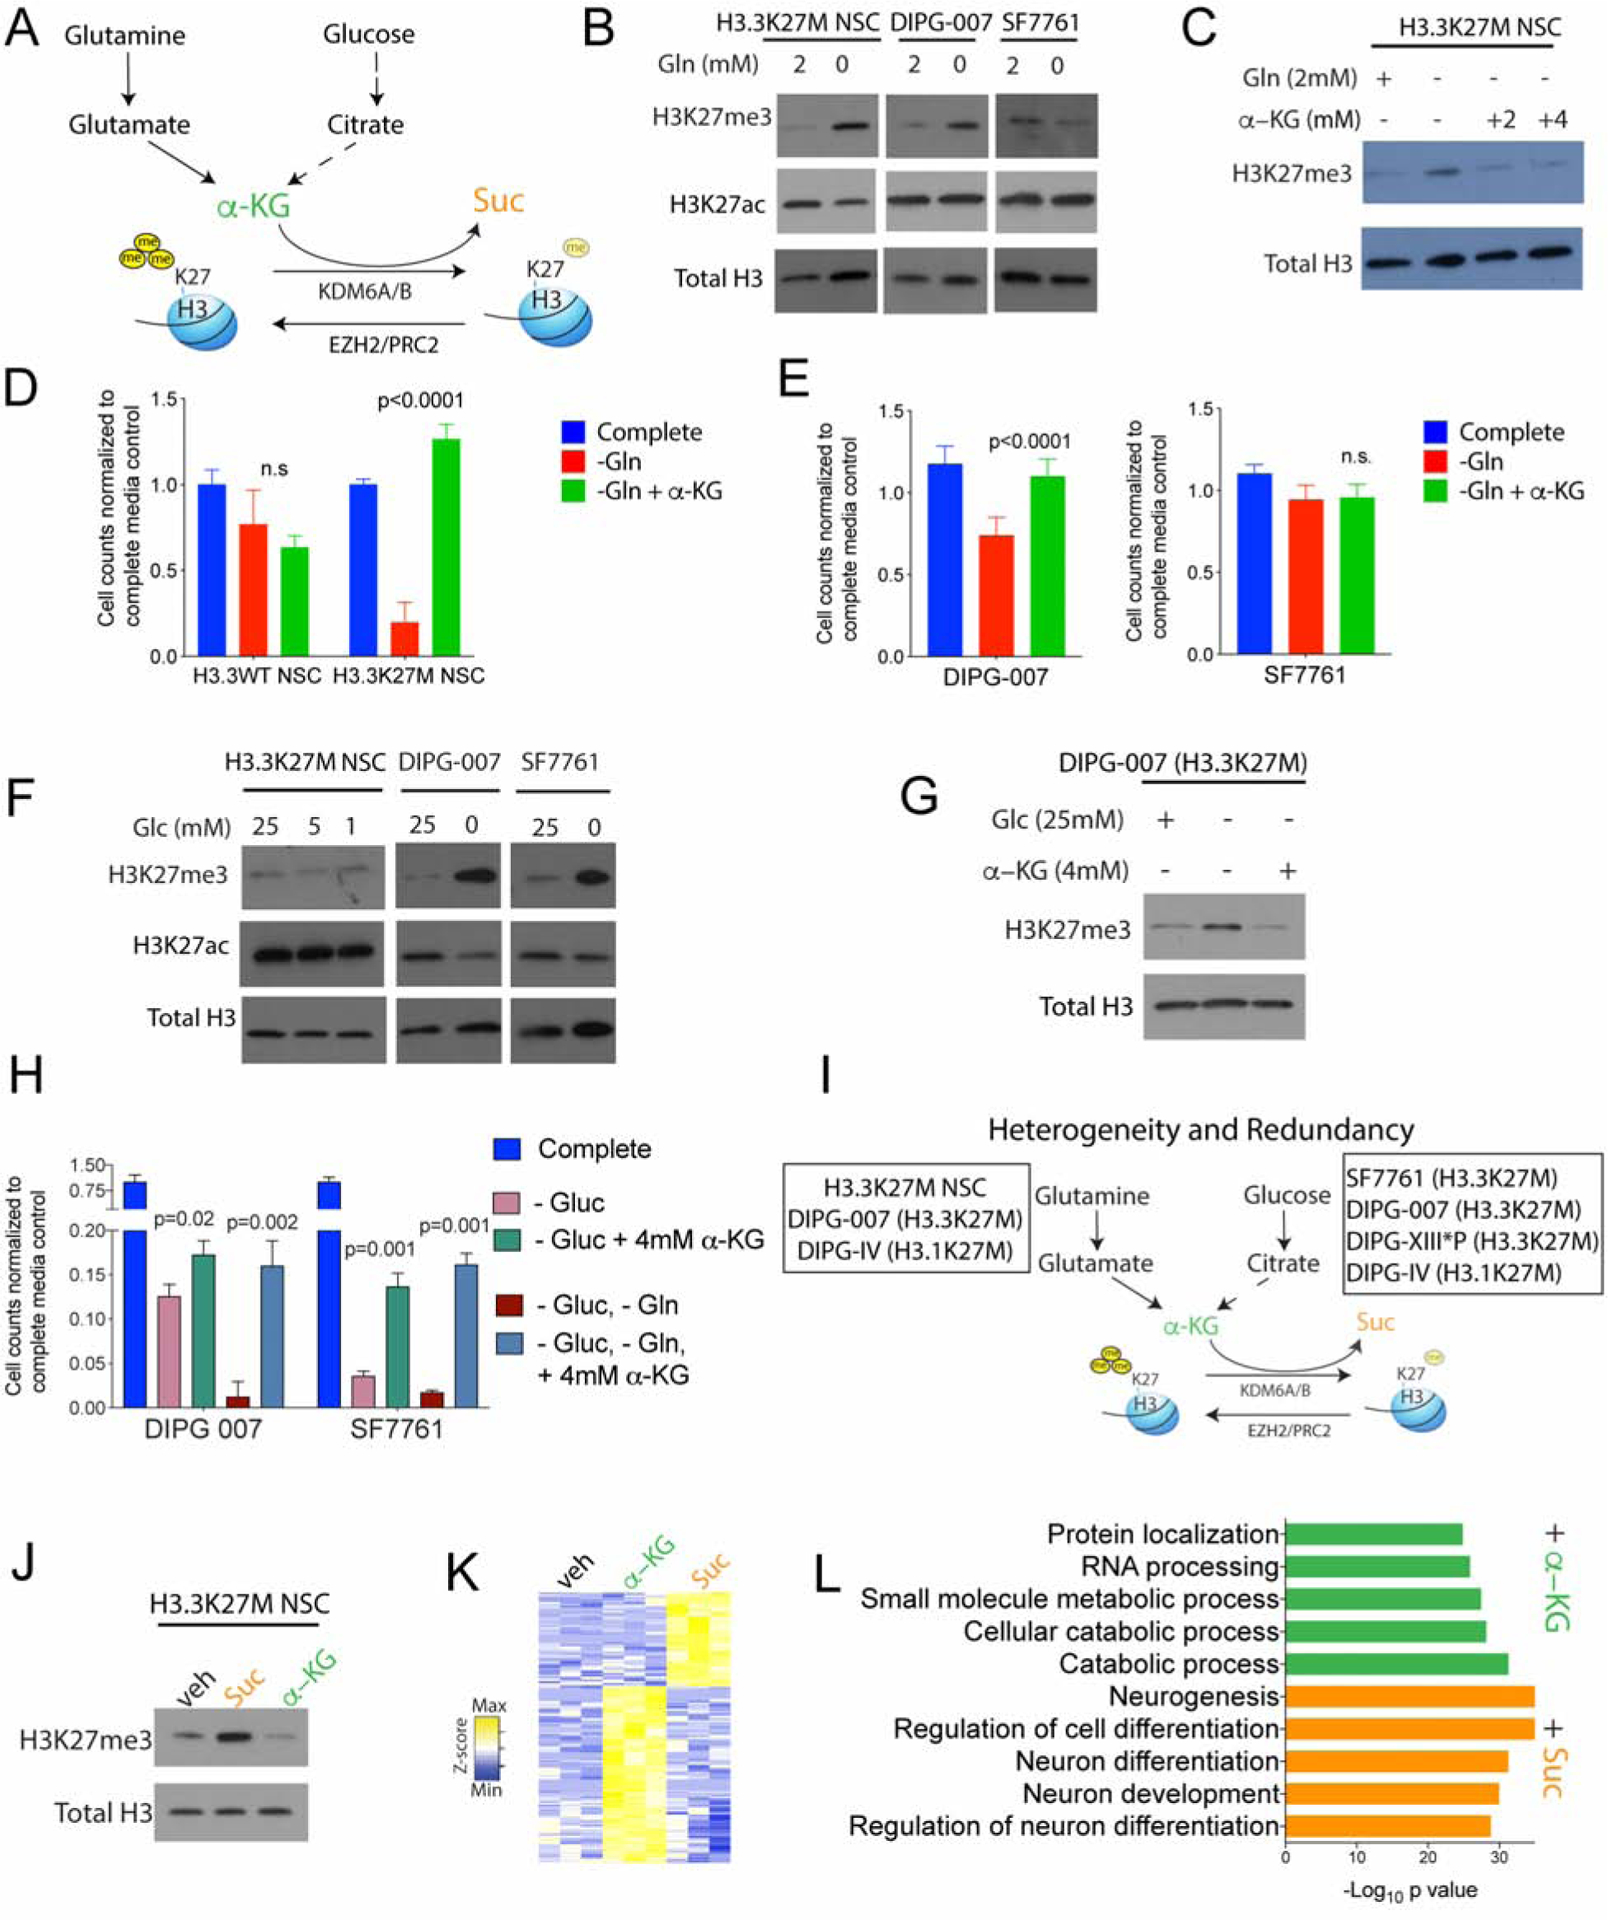
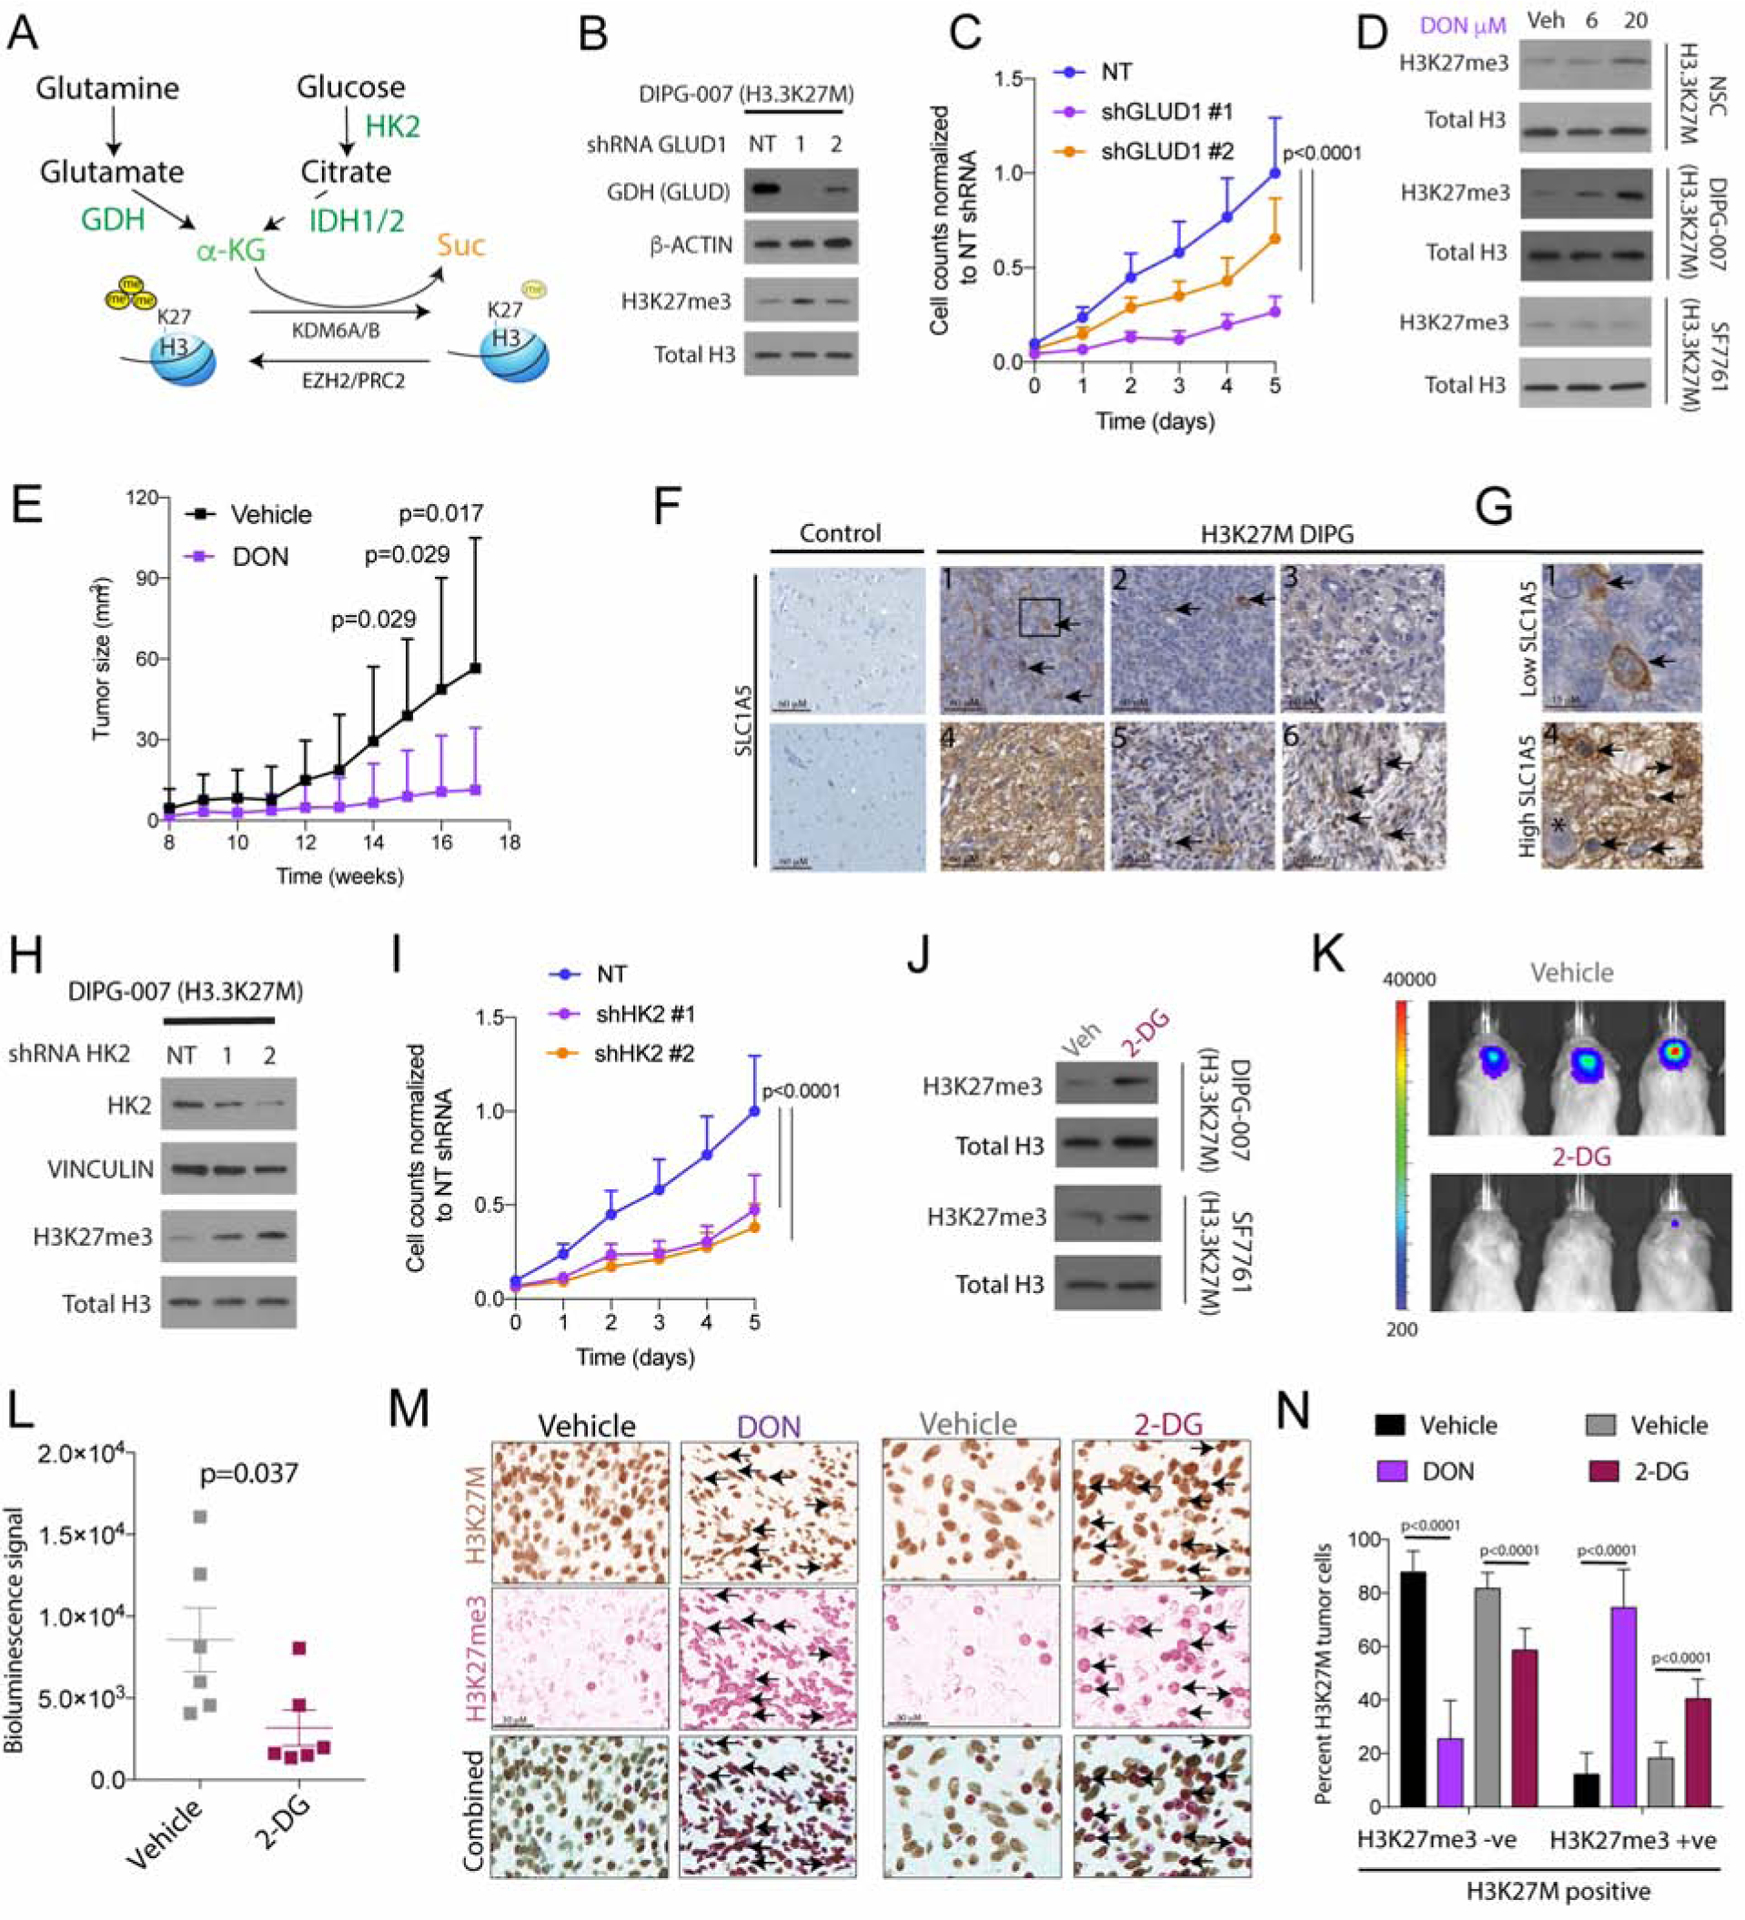
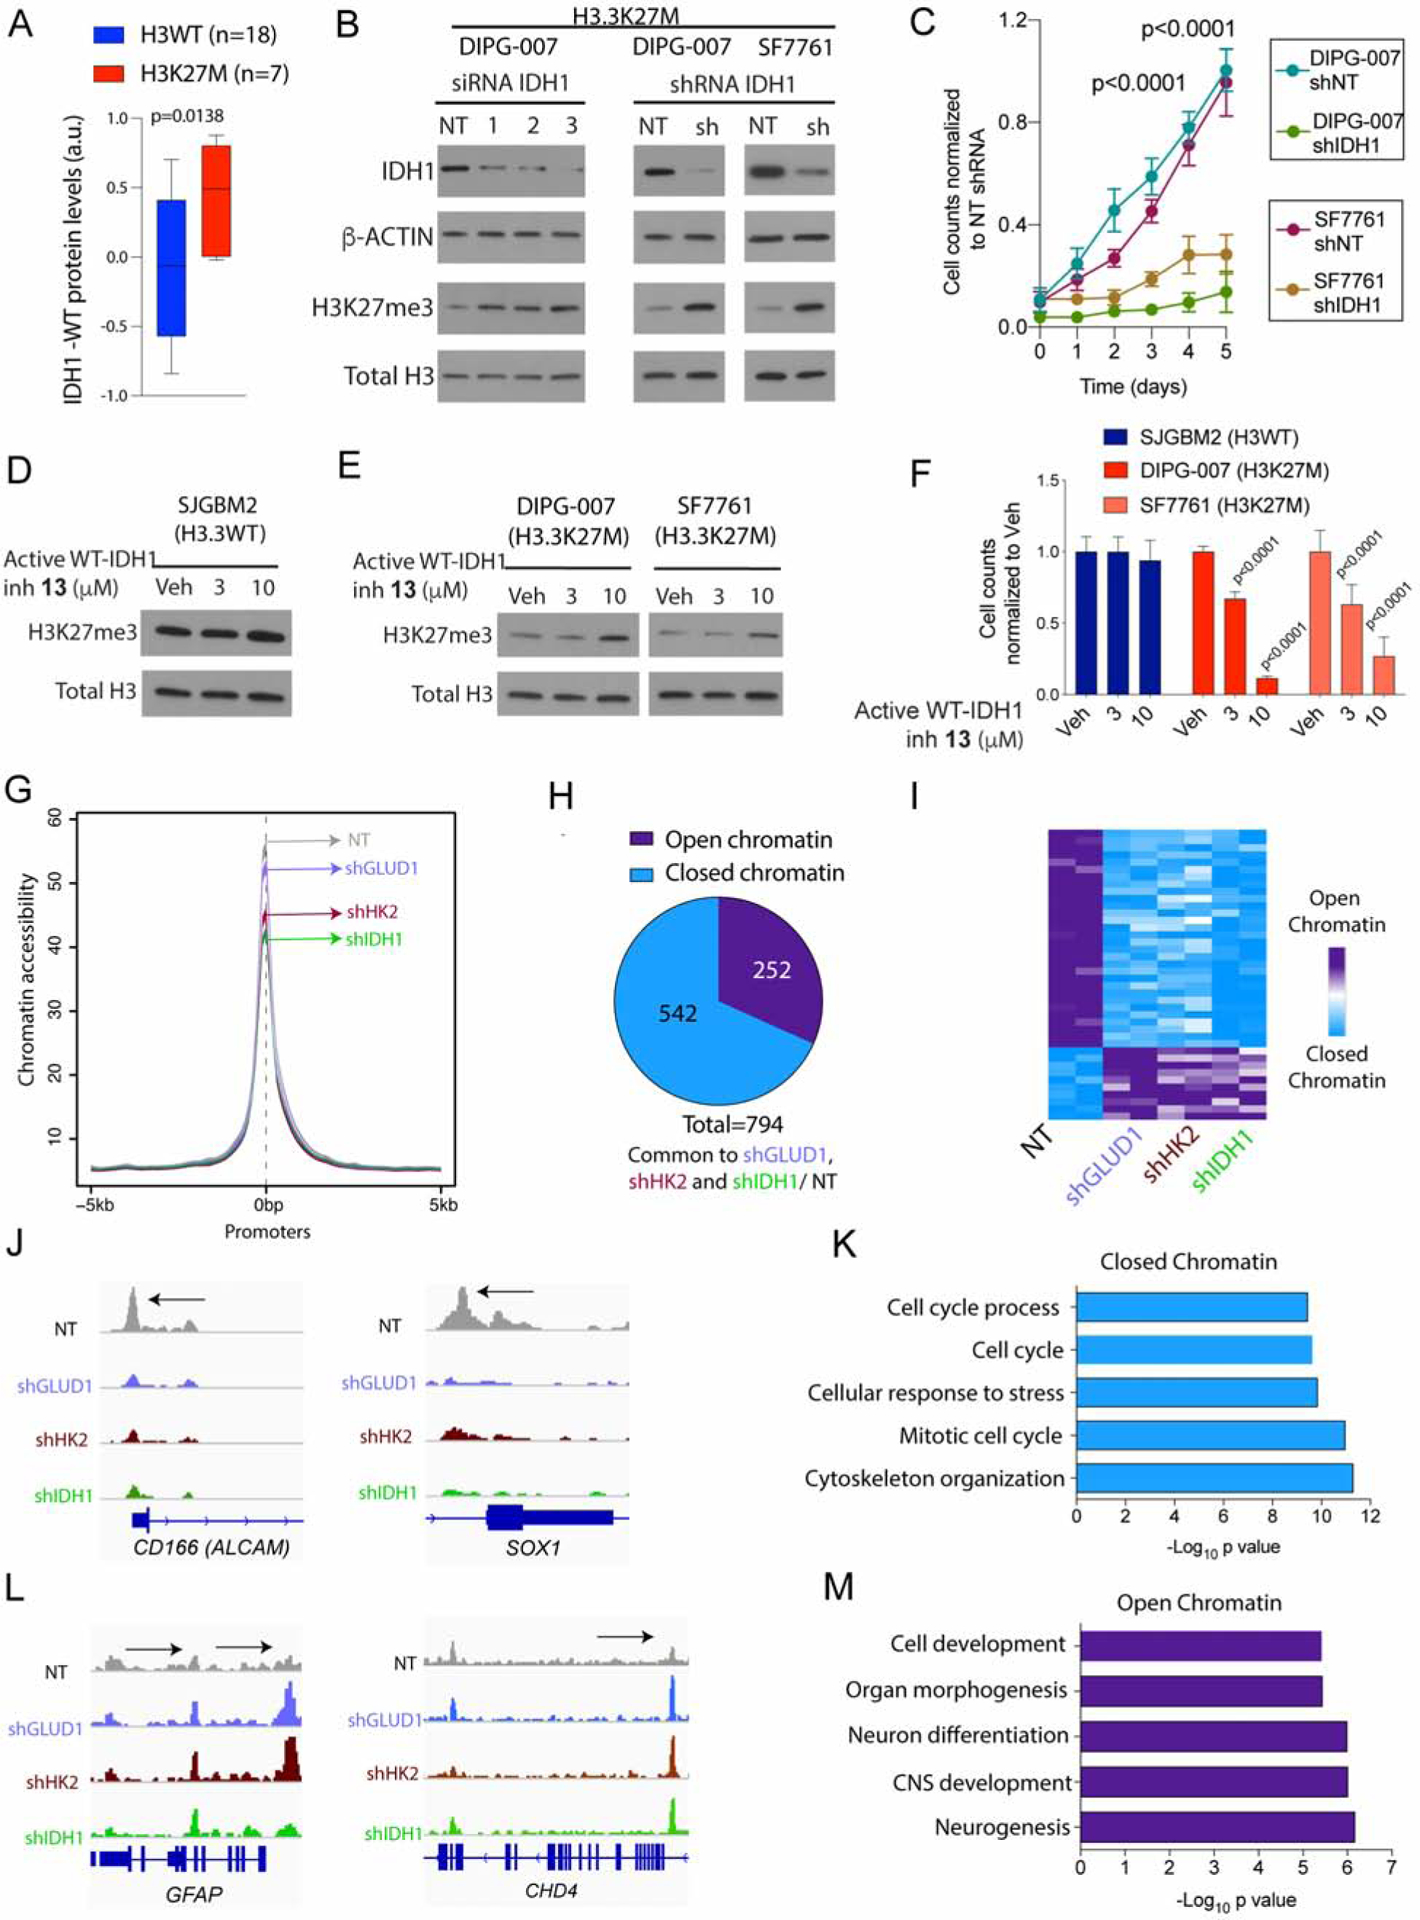
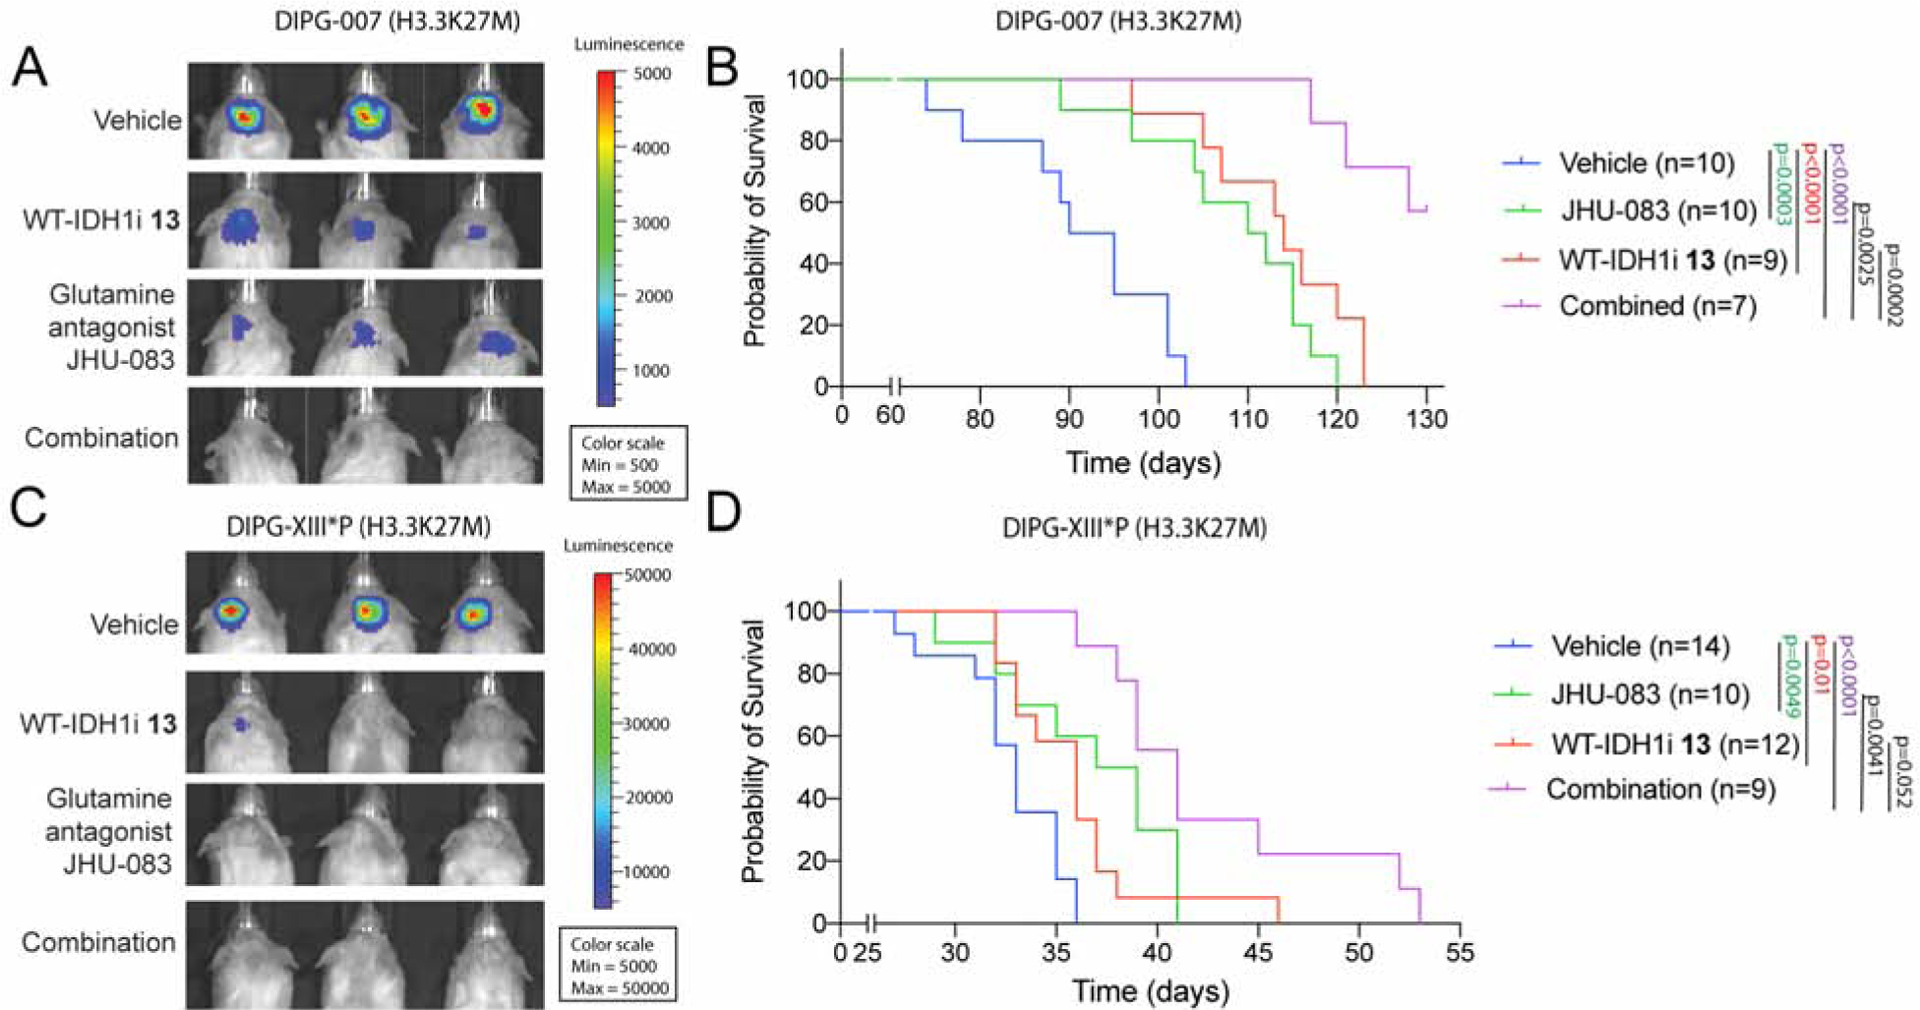
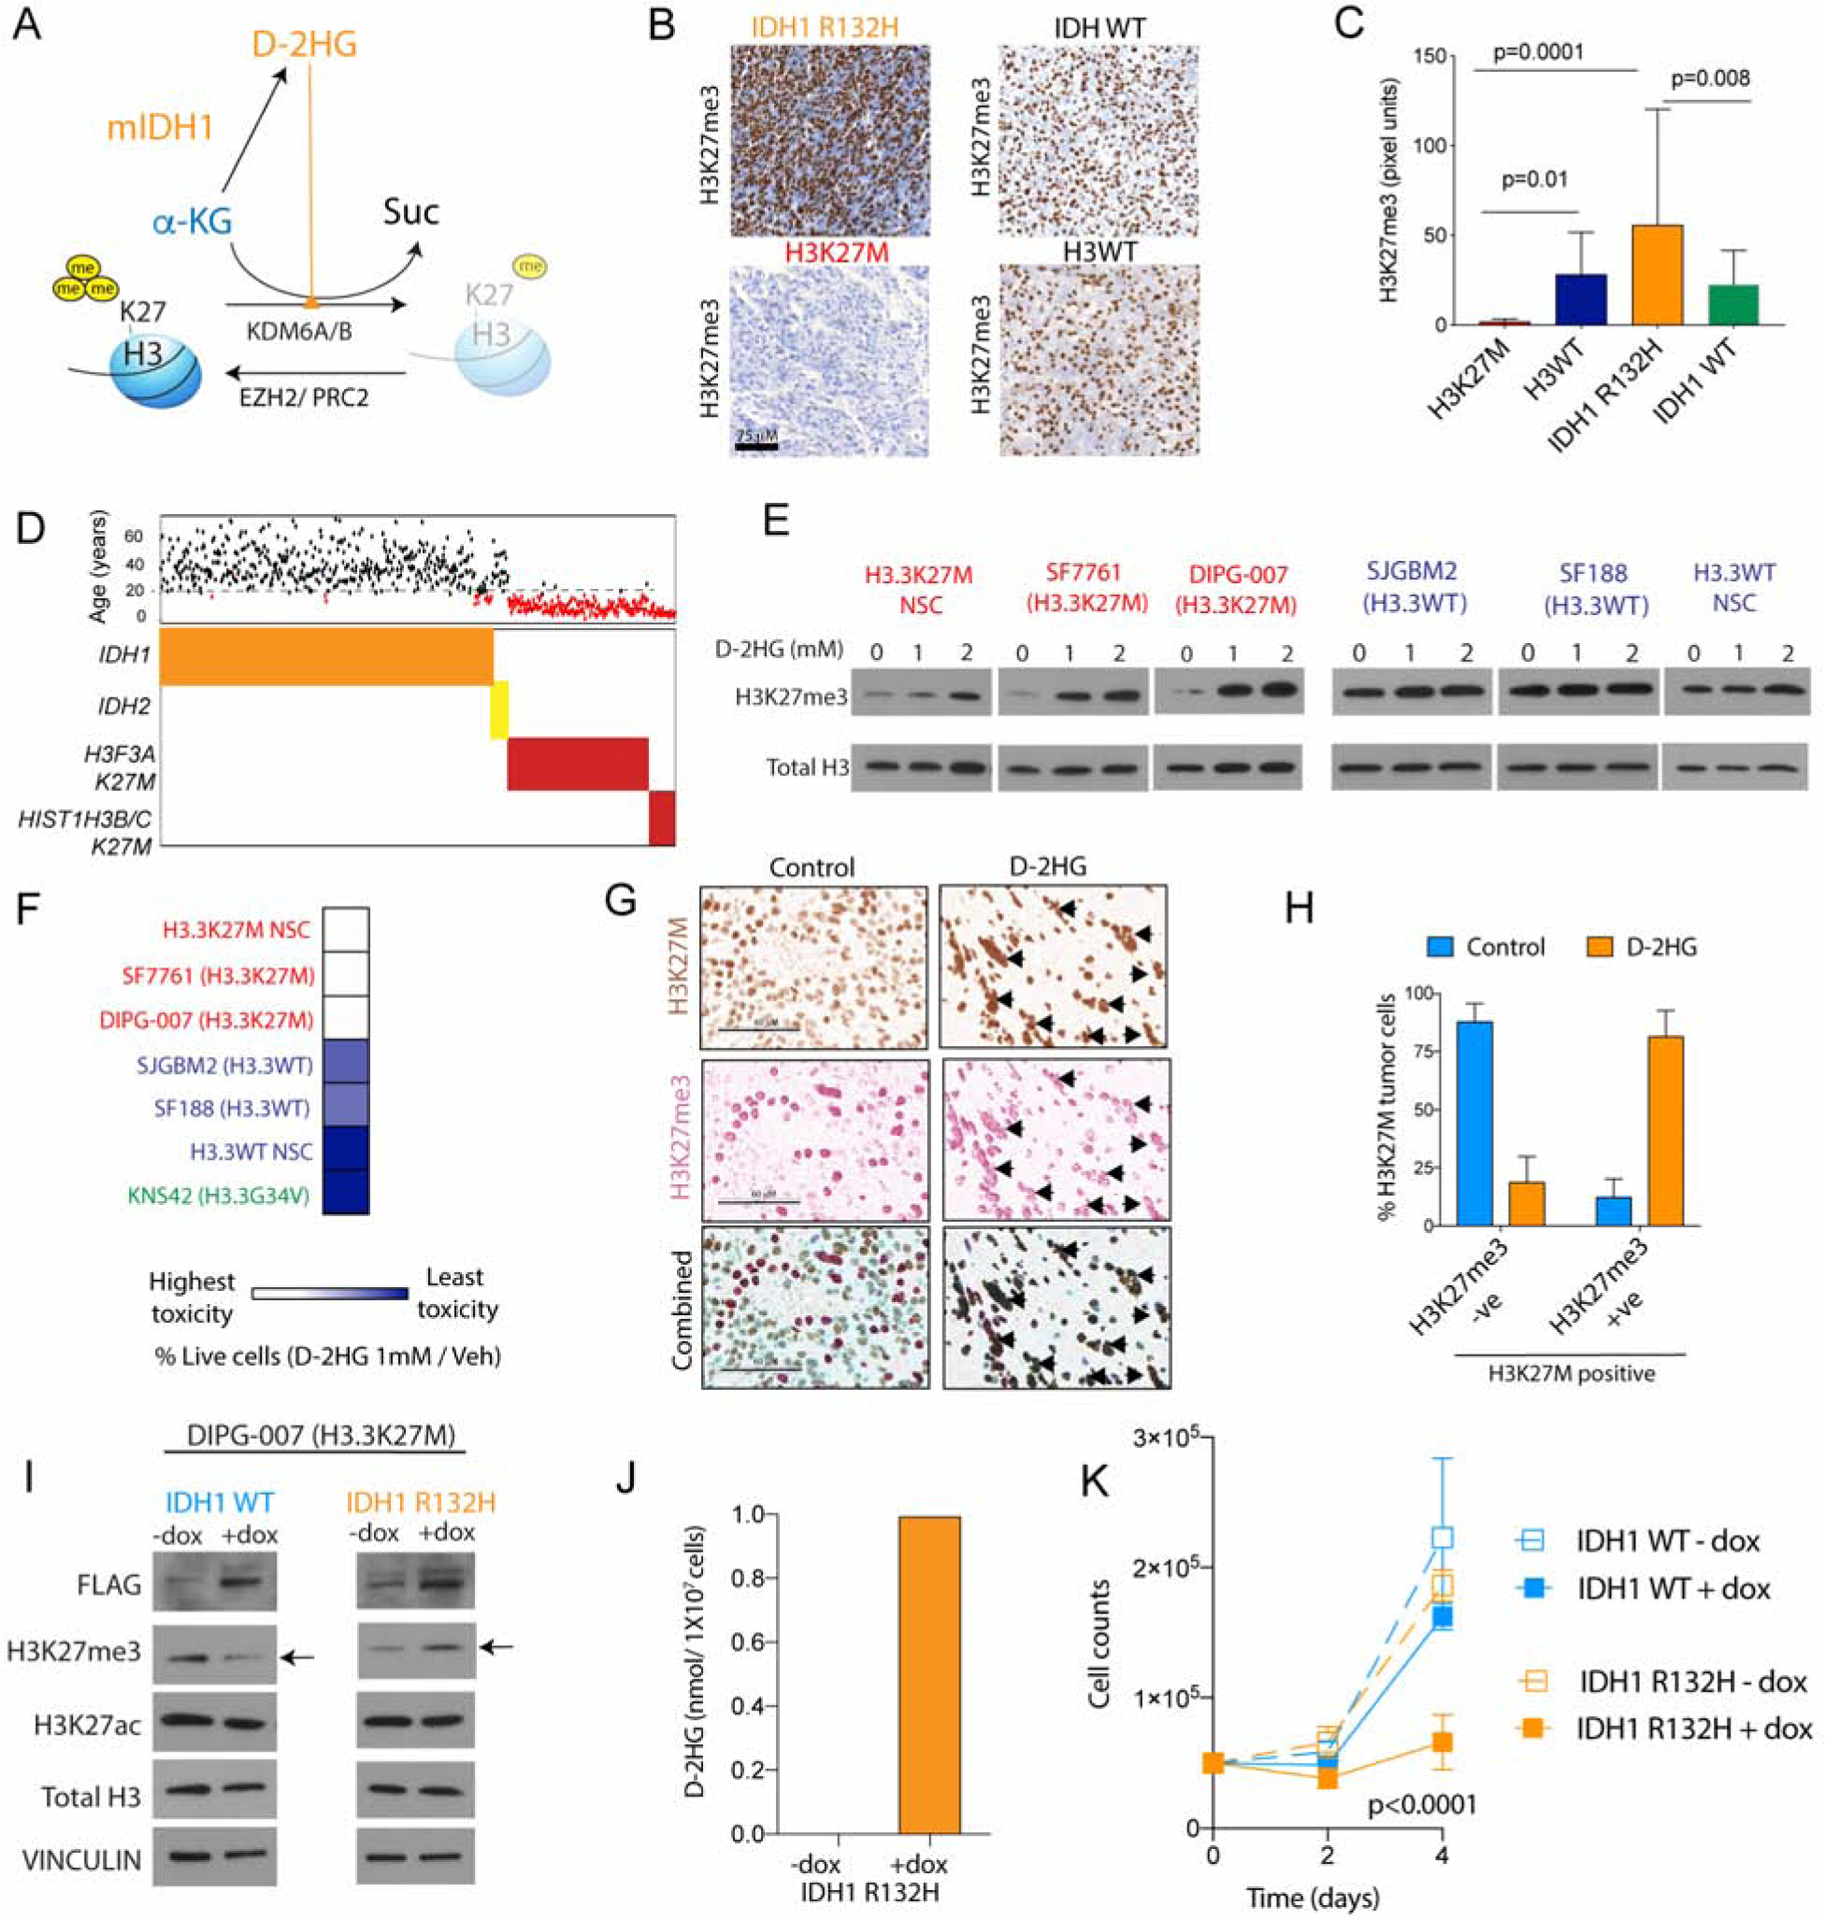
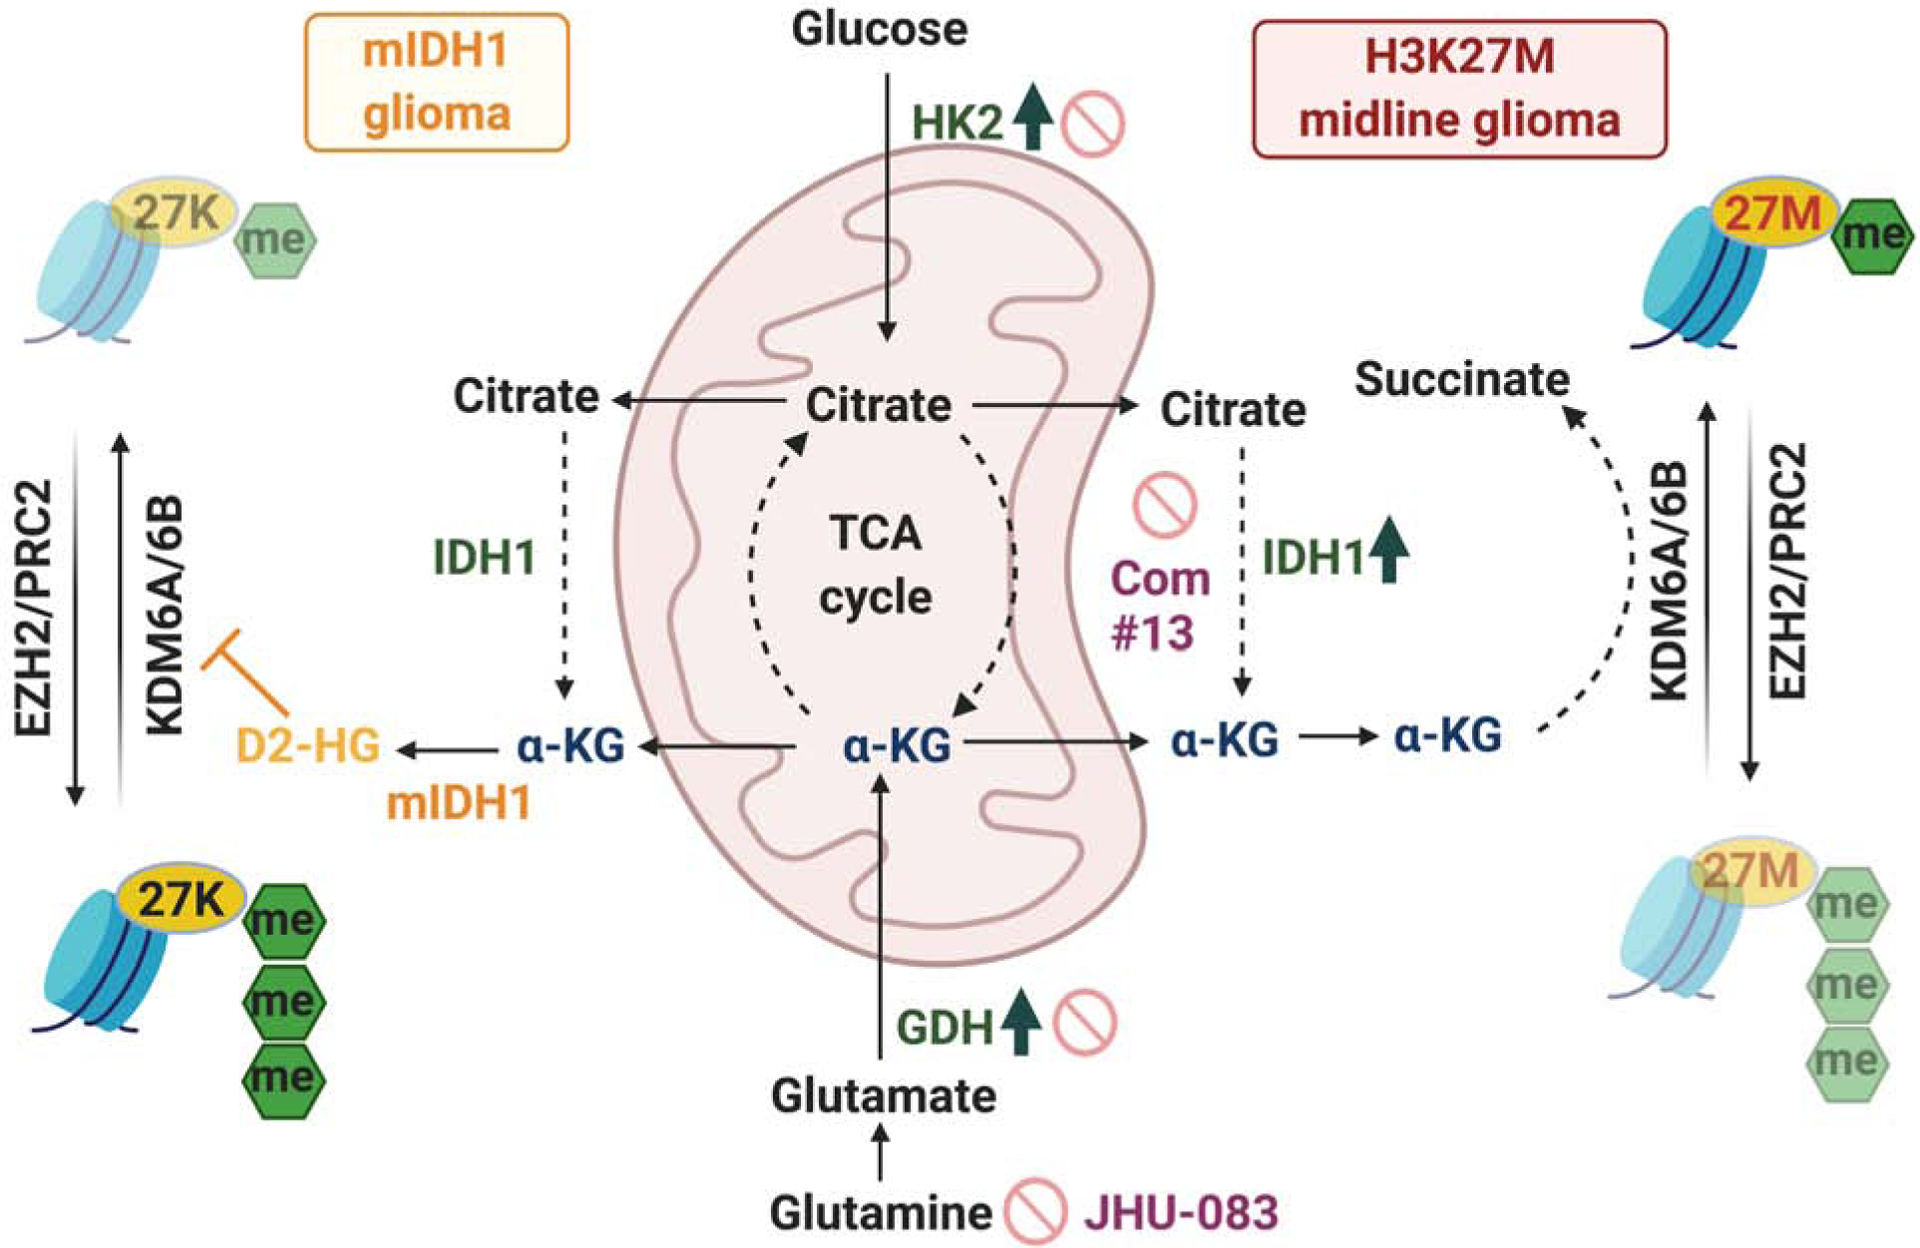
H3K27M diffuse intrinsic pontine gliomas (DIPGs) are fatal and lack treatments. They mainly harbor H3.3K27M mutations resulting in H3K27me3 reduction. Integrated analysis in H3.3K27M cells, tumors, and in vivo imaging in patients showed enhanced glycolysis, glutaminolysis, and tricarboxylic acid cycle metabolism with high alpha-ketoglutarate (α-KG) production. Glucose and/or glutamine-derived α-KG maintained low H3K27me3 in H3.3K27M cells, and inhibition of key enzymes in glycolysis or glutaminolysis increased H3K27me3, altered chromatin accessibility, and prolonged survival in animal models. Previous studies have shown that mutant isocitrate-dehydrogenase (mIDH)1/2 glioma cells convert α-KG to D-2-hydroxyglutarate (D-2HG) to increase H3K27me3. Here, we show that H3K27M and IDH1 mutations are mutually exclusive and experimentally synthetic lethal. Overall, we demonstrate that H3.3K27M and mIDH1 hijack a conserved and critical metabolic pathway in opposing ways to maintain their preferred epigenetic state. Consequently, interruption of this metabolic/epigenetic pathway showed potent efficacy in preclinical models, suggesting key therapeutic targets for much needed treatments.

Keywords: D-2HG; DIPG; H3K27me3; IDH mutation; epigenetics; glutaminolysis; glycolysis; histone methylation; histone mutation; metabolism; α-KG.


Conflict of interest statement

Declaration of Interests J.B.S. and Z.B. declare the following competing financial interest(s): both are current employees of AbbVie. The small-molecule WT-IDH1 inhibitors were provided by AbbVie after a material transfer agreement. AbbVie participated in the interpretation of inhibitor data, review, and approval of the publication. All other authors declare no competing interests.

Figures

Figure 1.
Figure 1.. H3.3K27M show upregulation of glycolysis and TCA cycle metabolism compared to H3.3WT cells
(A) Western blot (WB) of NSC stably transduced with H3.3K27M or H3.3WT for HA-tag, mutant-specific H3K27M, H3K27me3, H3K36me3, H3K27ac and total H3. (B) H3K27me3 occupancy determined by ChIP-seq in genomic regions flanking transcriptional start site (+/− 5kb) in H3.3K27M and H3.3WT NSC. (C) Heatmap and GSEA of differentially expressed genes determined by RNA-sequencing (RNA-seq) in H3.3WT and H3.3K27M NSC; up-(red) and down-(blue) regulated genes (n=3). (D) Data from unbiased proteomics represented as heatmap and pathway analysis of differential protein levels in H3.3K27M versus H3.3WT NSC (n=3). (E) Heatmap and enrichment analysis of differential metabolites in H3.3K27M versus H3.3WT NSC (n=4). (F) Bar graph of key metabolites (H3.3K27M/H3.3WT NSC fold difference, Y-axis) related to glycolysis, TCA-cycle and glutaminolysis. (G) Abbreviated schematic of glycolysis, TCA cycle and glutaminolysis (metabolites indicated in blue and ezymes in black). (H) Representative WB of SLC2A3/GLUT3, HK2, IDH1, IDH2, GDH (GLUD1/2), GAPDH and β-ACTIN in H3.3K27M (SF7761, DIPG-007 and DIPG-XIII, red) and H3WT (UMPed37 and SJGBM2, blue) patient-derived cell lines. (I) Bar graph of expression levels (Z-scores, Y-axis) of genes related to glycolysis and glutaminolysis in H3K27M (n=83), H3WT (n=101) and H3G34R/V (n=19) high-grade gliomas. Data plotted as mean ± SEM and analyzed by ANOVA, *** p<0.0001. (J) Single cell RNA-seq expression scatter plot of genes related to glycolysis and glutaminolysis in H3K27M patient tumor samples. (K) Single cell RNA-seq expression scatter plot of SLC2A3, HK2, IDH1 and GLUD1 in oligodendrocyte (OC)-like, astrocyte (AC)-like and oligodendrocyte precursor (OPC)-like cells in H3K27M patient tumor samples. Data in 1j–k derived from Filbin et al. 2018. (Filbin et al., 2018) and analyzed by non-parametric, 2-sided, unpaired, 2-tailed, Student’s t-test. ** p<0.001, *** p<0.0001. (L) Representative Integrated Genomics Browser (IGV) tracks for H3K27me3, H3K27ac, H3K4me3, H3K4me1 and input in H3.3K27M and H3.3WT NSC at Slc2a3, Hk2, Idh1 and Glud1 gene loci. Top panel WT=H3.3WT, K27M= H3.3K27M NSC. Boxes indicate differential enrichment in H3.3K27M versus H3.3WT NSC. (Ala, alanine; ALDOC, aldolase-C; Asp, aspartate; Cys, cystine; ET, electron transport; Fruc, fructose; F-6-P, fructose-6-phosphate; GAPDH, Glyceraldehyde 3-phosphate dehydrogenase; Glc, glucose; Gln, glutamine; G-6-P, glucose-6-phosphate; Glu, glutamate; Gly, glycine; Ile, isoleucine; Leu, leucine; Man, mannose; Met, methionine; PEP, phosphoenol pyruvate; PFKP, phosphofructokinase-platelet; PFKFB, 6-phosphofructo-2-kinase/fructose-2,6-biphosphatase; PGAM2, phospho-glyceromutase 2; PGK1, phosphoglycerate kinase1; Ser, serine; Val, valine) WB are representative. Data are plotted as mean ± SD, n = biologic replicates
Figure 2.
Figure 2.. In vivo Magnetic resonance spectroscopy (MRS) imaging in patients demonstrate higher glutamine and citrate levels in H3K27M compared to H3WT midline-gliomas
(A) Representative axial MRI images from H3K27M (thalamic/brainstem) and H3WT (brainstem) patients, with corresponding mutant-specific H3K27M and H3K27me3 (arrows, positive internal control) immunostaining on the right. Regions of interest (ROI) within the tumor, where MRS spectra were quantified, are indicated as boxes. (B) Representative in vivo MRS spectra [TE (echo time) = 35 ms, TR (repetition time) = 2 s;] derived from H3K27M (red) and H3WT (blue) midline gliomas. Arrows indicate defined peaks for specific metabolites. (C) MRS Quantification of indicated metabolite levels from H3K27M (n=11, red) and H3WT (n=4, blue) patients with midline-gliomas. Box plots show median and interquartile range, whiskers represent the highest and lowest observations, and were analyzed by 2-sided, non-parametric, unpaired, 2-tailed, t-test. Gln=glutamine, Glu=glutamate, mI=myoinositol, Gly=glycine, Glc=glucose, Cho=choline, Cit=citrate, Ala=alanine, Lac=lactate.
Figure 3.
Figure 3.. Heterogeneous regulation of global H3K27me3 levels by glutamine and glucose metabolism in H3.3K27M cells
(A) Schematic depicting α-KG generation from glutamine and glucose metabolism: α-KG can promote H3K27me3 demethylation by serving as a critical co-factor for the H3K27 demethylases KDM6A/6B and is metabolized to succinate (Suc) during this reaction. (B) H3.3K27M cells (H3.3K27M NSC, DIPG-007 and SF7761) were grown in complete or glutamine (Gln)-depleted media. Representative WB demonstrate changes in global H3K27me3 and H3K27ac in relation to total H3. (C) Representative WB of H3.3K27M NSC showing alterations in global H3K27me3 levels in relation to total H3 in Gln-depleted media with/without 2 or 4mM cell-permeable α-KG. (D–E) Cell counts (Y-axis) on Gln withdrawal with/without 4 mM cell-permeable α-KG in H3.3WT and H3.3K27M NSC (d), DIPG-007 and SF7761 (e) cells (n=4). (F) H3.3K27M cells (H3.3K27M NSC, DIPG-007 and SF7761) were grown in complete or glucose (Glc)-depleted media. Representative WB demonstrates changes in global H3K27me3 and H3K27ac and total H3. (G) Representative WB of H3.3K27M DIPG-007 cells showing changes in H3K27me3 levels in relation to total H3 in Glc-deprived media with/without 4 mM cell-permeable α-KG. (H) Cell counts (Y-axis) in H3.3K27M DIPG-007 and SF7761 cells upon withdrawal of Glc, Gln or both with/without 4 mM cell-permeable α-KG (n=4). (I) Schematic indicating heterogeneity and redundancy in the regulation of global H3K27me3 by glutamine (H3.3K27M NSC, DIPG-007 and DIPG-IV) and glucose (SF7761, DIPG-007, DIPG-XIII*P and DIPG-IV) metabolism in H3.3 and H3.1 K27M cell lines (see figure S3 for other cell lines). (J) H3.3K27M NSC were treated with vehicle or 4 mM cell-permeable Suc or α-KG. Representative WB illustrating H3K27me3 in relation to total H3 levels. (K–L) Heatmap of differentially regulated genes (K) and GSEA analysis of upregulated genes (L) in H3.3K27M NSC treated with α-KG or Suc (4 mM, n=3). All experiments were conducted after 4 days in culture. WB are representative; n indicates biologic replicates; Data plotted as mean ± SD and analyzed by ANOVA.
Figure 4.
Figure 4.. Inhibiting GDH and HK2 in vitro and in vivo increases global H3K27me3 levels and suppresses proliferation of H3.3K27M cells
(A) Schematic of key enzymes related to α-KG generation in glutamine (GDH metabolizes glutamate to α-KG) and glucose (HK2, first and irreversible enzyme in glycolysis and IDH1 metabolizes isocitrate to α-KG) metabolic pathways. (B–C) Representative WB of GDH, β-ACTIN, H3K27me3 and total H3 in DIPG-007 stably transduced with non-targeted (NT) or 2 independent GLUD1 (GDH) shRNAs (b). Proliferation of cells from 4b (normalized cell counts, Y-axis) plotted against time (days, X-axis) in (NT, light blue) or 2 independent GLUD1 shRNAs (orange and purple) (c, n=3). (D) H3.3K27M cells (NSC, DIPG-007 and SF7761) cells were treated with vehicle (Veh), 6 or 20 μM of the glutamine antagonist 6-diazo-5-oxo-L-norleucine (DON) for 4 days. Representative WB of H3K27me3 and total H3 levels. (E) Tumor volume (mm3, Y-axis) of H3.3K27M NSC xenografted into the flanks in mice treated with DON (purple, 1mg/kg, i.p., every other day for 6 weeks) or vehicle (black, n=10). (F–G) Representative IHC images (f, scale bar=60μM) for the glutamine transporter SLC1A5 in control brains (n=6) or H3.3K27M DIPG tumor samples (n=6, #1–6). Insets from #1 and #4 shown on the right (g, scale bar, 15μM; Asterisk shows neuron surrounded by SLC1A5 positive tumor cells). (H–I) Representative WB of HK2, VINCULIN, H3K27me3 and total H3 in DIPG-007 stably transduced with non-targeted (NT) or 2 independent HK2 shRNAs (h). Proliferation of cells from 4h (normalized cell counts, Y-axis) plotted against time (days, X-axis) in (NT, light blue) or 2 independent HK2 shRNAs (orange and purple) (i, n=3). (J) H3.3K27M DIPG-007 and SF7761 cells were treated with vehicle (Veh) or 25 mM 2-DG for 2 days. Representative WB of H3K27me3 and total H3 levels. (K–L) Representative bioluminescent images of mice with pontine H3.3K27M DIPG-007 orthotopic xenografts treated i.p. with vehicle or 2-DG (k, 500mg/kg, every other day for 3 weeks, n=6) and bioluminescent signal quantification (Y-axis, l). (M) Representative single color or double color overlay IHC images from Vehicle/DON (from 4e) or vehicle/2-DG (from 4k) treated tumor samples stained with combined mutant-specific H3K27M (brown) and H3K27me3 (red) antibodies. Arrows indicate tumor cells that are positive for both H3K27M and H3K27me3. (N) Quantification of H3K27M positive tumor cells that were negative or positive for H3K27me3 (from 4m) in vehicle (n=3, black)/DON (n=3, purple) and Vehicle (n=5, gray)/2-DG (n=5, maroon) treated animals (all biologic replicates). Data plotted as mean ± SD and analyzed by ANOVA (4c, i and n) or 2-sided, unpaired, 2-tailed, Student’s t-test (4e and l); n indicates biologic replicates.
Figure 5.
Figure 5.. Inhibiting IDH1 increases H3K27me3 levels and is toxic, and GDH, HK2 and IDH1 knockdown results in altered chromatin accessibility at gene loci related to neuroglial differentiation
(A) IDH1-WT protein levels in H3WT (n=18) and H3K27M (n=7, red) pediatric high-grade gliomas (Pediatric Brain Tumor Atlas, PedcBioPortal). Box plots show median and interquartile range, whiskers represent the highest and lowest observations. (B) H3.3K27M DIPG-007 cells were transfected with non-targeted (NT) or 3 independent IDH1 siRNAs and H3.3K27M SF7761 and DIPG-007 cells were stably transduced with NT or IDH1 shRNA. Representative WB of IDH1, β-ACTIN, H3K27me3, and total H3 levels. (C) Cell proliferation (normalized cell counts, Y-axis) against time (days, X-axis) in NT or IDH1 shRNA in H3.3K27M SF7761 and DIPG-007 cells from (b) (n=3). (D–F) SJGBM2 (H3WT, D) or DIPG-007 and SF7761 (H3.3K27M, E) cells were treated with vehicle (Veh) or indicated concentrations of the active WT-IDH1i 13. Representative WB of H3K27me3 and total H3 levels after treatment. In parallel, cell counts (normalized cell counts, Y-axis) was measured per condition after treatment (n=3, F). (G) ATAC-seq was compared in H3.3K27M DIPG-007 cells stably transduced with non-targeted (NT, dark gray) or shGLUD1 (light blue), shHK2 (brown) and shIDH1 (green). Chromatin accessibility was compared at promoter regions (+/− 5kb from TSS, n=2). (H–I) Pie chart (H) and heatmap (I) demonstrating significantly altered (adjusted p<0.05) ATAC-seq peaks commonly changed in shGLUD1/ NT, shHK2/ NT and shIDH1/ NT from indicating closed (significantly lowered compared to NT control, blue) or open (significantly higher compared to NT control, purple) chromatin. (J–K) Representative ATAC-seq peaks at CD166/ALCAM and SOX1 loci in NT (dark gray), shGLUD1 (light blue), shHK2 (brown) and shIDH1 (green) DIPG-007 cells and GSEA analyses of common regions with closed chromatin (blue). (L–M) Representative ATAC-seq peaks at GFAP and CHD4 loci in NT (dark gray), shGLUD1 (light blue), shHK2 (brown) and shIDH1 (green) DIPG-007 cells and GSEA analyses of common regions with open chromatin (purple). Treatments were performed for 2 days. Data plotted as mean ± SD and analyzed by 2-sided, unpaired, 2-tailed, Student’s t-test (5a, c) or ANOVA (5f); n indicates biologic replicates.
Figure 6.
Figure 6.. Inhibition of IDH1 and glutamine metabolism is therapeutic in vivo
(A–B) Representative bioluminescence images (a) and Kaplan-Meier analysis (b) from animals implanted with H3.3K27M DIPG-007 cells in the pons and treated for four weeks (see Fig S6b) with vehicle (n=10), WT-IDH1i 13 (n=9) or the glutamine antagonist JHU-083 (n=10) or both (n=7). (C–D) Representative bioluminescence images (c) and Kaplan-Meier analysis (d) from animals implanted with H3.3K27M DIPG-XIII*P cells in the pons and treated for three weeks (see Fig S6c) with vehicle (n=14), WT-IDH1i 13 (n=12) or the glutamine antagonist JHU-083 (n=10) or both (n=9). See figure S6 for treatment details.
Figure 7.
Figure 7.. D-2HG increases H3K27me3 levels and is toxic to H3.3K27M cells and mutually exclusive H3.3K27M and IDH1 R132H mutations are synthetic lethal
(A) Schematic depicting mIDH1 metabolizing α-KG to D-2HG. D-2HG competitively inhibits α-KG’s function as a co-factor for H3K27 demethylases KDM6A/6B to increase global H3K27me3 levels. (B–C) Representative images (b) and blinded quantification (c, Y-axis, pixel units) of H3K27me3 stained H3K27M (n=12, red) and H3WT (n=24, dark blue), IDH1 R132H (n=8, orange) and IDH1/2 WT (n=19, light blue) patient tumor samples. (D) Distribution of mIDH1(n=443) and mIDH2 (n=20); and K27M H3.3 (H3F3A, n=222) and H3.1 (HIST1H3B/C, n=35) gliomas. Corresponding age is graphed above (black >18y; red<18y). (E) H3.3K27M (NSC, SF7761 and DIPG-007, red) or H3WT (NSC, SJGBM2 and SF188, blue) cells were treated with indicated concentrations of D-2HG. Representative WB of H3K27me3 and total H3 levels. (F) Heat map of fold-change in cell numbers (% live cells) upon 1 mM D-2HG/Veh treatment in H3.3K27M (NSC, SF7761, DIPG-007; red), H3.3G34V (KNS42; green) and H3WT (SJGBM2 and SF188; blue) cells (n=3, see also Fig S6c). (G) Representative single color or double color overlay IHC images from vehicle (n=3) or D-2HG (n=2, 25mg/kg, every other day for 2 weeks) treated H3.3K27M NSC xenograft tumor samples stained with combined mutant specific H3K27M (brown) and H3K27me3 (red) antibodies. Arrows indicate tumor cells that are positive for both H3K27M and H3K27me3, scale bar=60μM. (H) Quantification of H3K27M positive tumor cells from H3.3K27M NSC xenografts that were either negative or positive for H3K27me3 (from g) in vehicle (light blue) or D-2HG (orange) treated animals. (I–J) H3.3K27M DIPG-007 cells were stably transfected with doxycycline (dox) inducible FLAG-tagged WT IDH1 (light blue) or IDH1 R132H (orange). Representative WB of FLAG, H3K27me3, H3K27ac, total H3 and VINCULIN levels (I). D-2HG measured in DIPG-007 cells transduced with IDH1 R132H +/− dox (J, n=3). (K) Cell proliferation (cell counts, Y-axis) plotted against time (days, X-axis, n=4). Data expressed as mean ± SD and analyzed by ANOVA, n indicates biologic replicates.
Figure 8.
Figure 8.. H3K27M mutations are dependent on a critical metabolic pathway also used by mIDH1 to regulate global H3K27me3 levels.
Schematic model of integrated metabolic and epigenetic pathways in H3K27M cells. HK2, IDH1 and GDH, enzymes that generate α-KG, were elevated in H3K27M tumors. H3K27M tumor cells use α-KG to maintain low global H3K27me3 levels. Inhibition of HK2, IDH1 and GDH increased global H3K27me3, altered chromatin accessibility and suppressed H3K27M cell proliferation in vitro and in vivo and are potential therapeutic targets (stop signs). Mutually exclusive mIDH1 use α-KG to generate D-2HG. D-2HG treatment or expression on mIDH1 in H3K27M cells was toxic and increased H3K27me3.

Comment in

References

    1. Agnihotri S, Mansouri S, Burrell K, Li M, Mamatjan Y, Liu J, Nejad R, Kumar S, Jalali S, Singh SK, et al. (2019). Ketoconazole and Posaconazole Selectively Target HK2-expressing Glioblastoma Cells. Clin Cancer Res 25, 844–855. - PMC - PubMed
    1. Anastas JN, Zee BM, Kalin JH, Kim M, Guo R, Alexandrescu S, Blanco MA, Giera S, Gillespie SM, Das J, et al. (2019). Re-programing Chromatin with a Bifunctional LSD1/HDAC Inhibitor Induces Therapeutic Differentiation in DIPG. Cancer Cell 36, 528–544 e510. - PubMed
    1. Bayliss J, Mukherjee P, Lu C, Jain SU, Chung C, Martinez D, Sabari B, Margol AS, Panwalkar P, Parolia A, et al. (2016). Lowered H3K27me3 and DNA hypomethylation define poorly prognostic pediatric posterior fossa ependymomas. Sci Transl Med 8, 366ra161. - PMC - PubMed
    1. Bender S, Tang Y, Lindroth AM, Hovestadt V, Jones DT, Kool M, Zapatka M, Northcott PA, Sturm D, Wang W, et al. (2013). Reduced H3K27me3 and DNA hypomethylation are major drivers of gene expression in K27M mutant pediatric high-grade gliomas. Cancer Cell 24, 660–672. - PubMed
    1. Bluml S, Panigrahy A, Laskov M, Dhall G, Krieger MD, Nelson MD, Finlay JL, and Gilles FH (2011). Elevated citrate in pediatric astrocytomas with malignant progression. Neuro Oncol 13, 1107–1117. - PMC - PubMed

Publication types

MeSH terms