. 2020 Sep 3;182(5):1271-1283.e16.
doi: 10.1016/j.cell.2020.07.024. Epub 2020 Jul 23.

A Thermostable mRNA Vaccine against COVID-19

Affiliations

A Thermostable mRNA Vaccine against COVID-19

Na-Na Zhang et al. Cell. .

Abstract

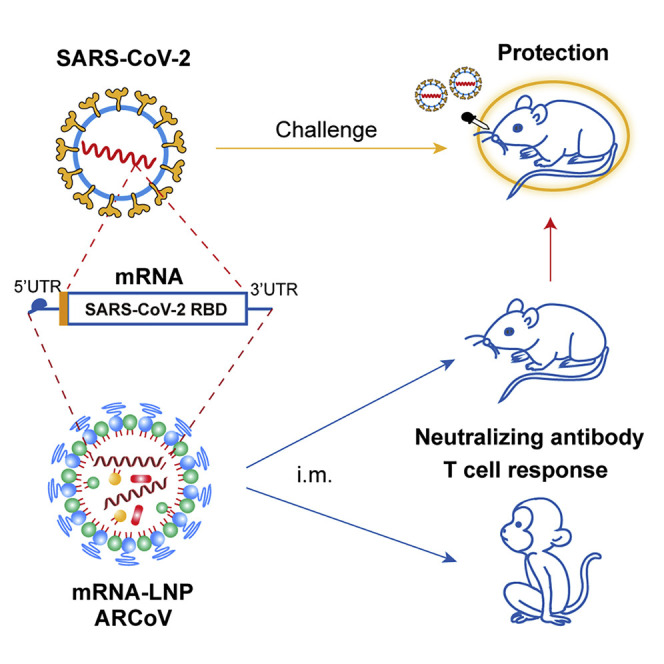
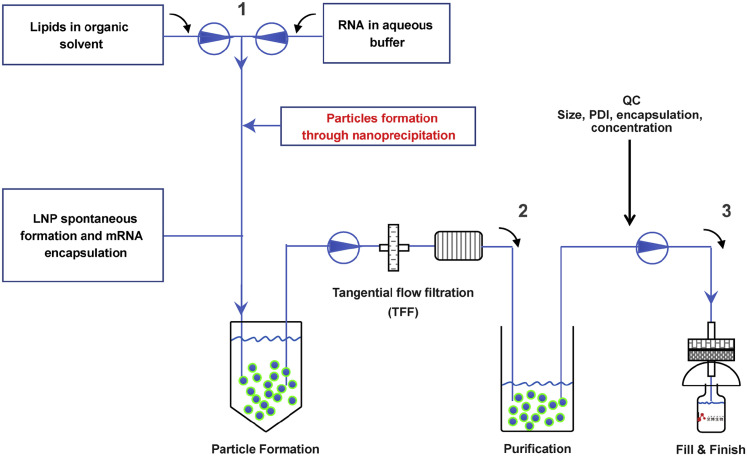
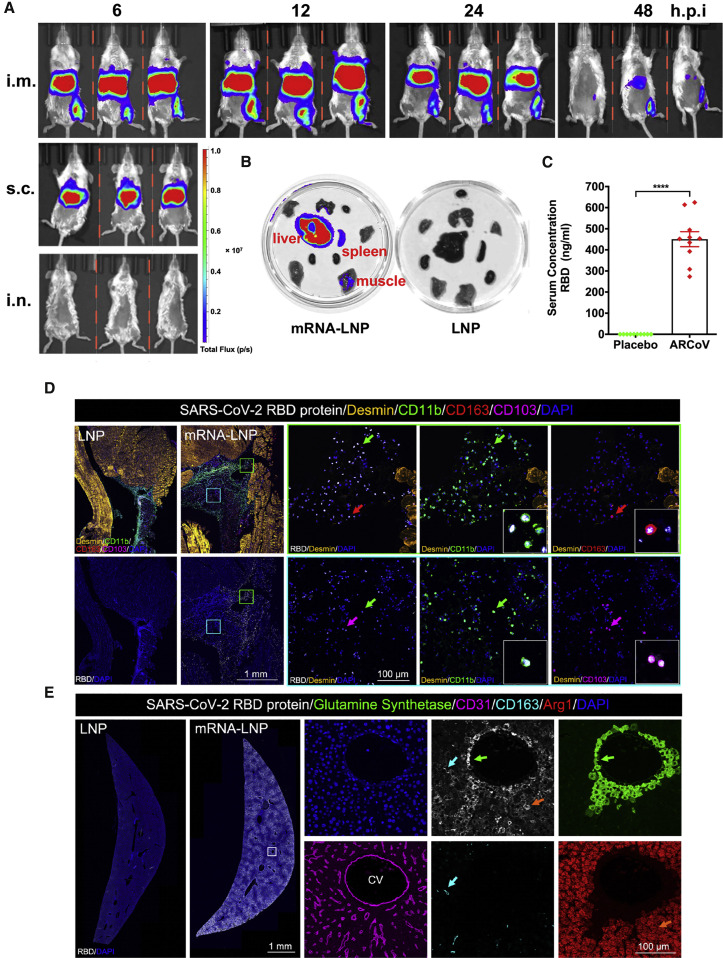
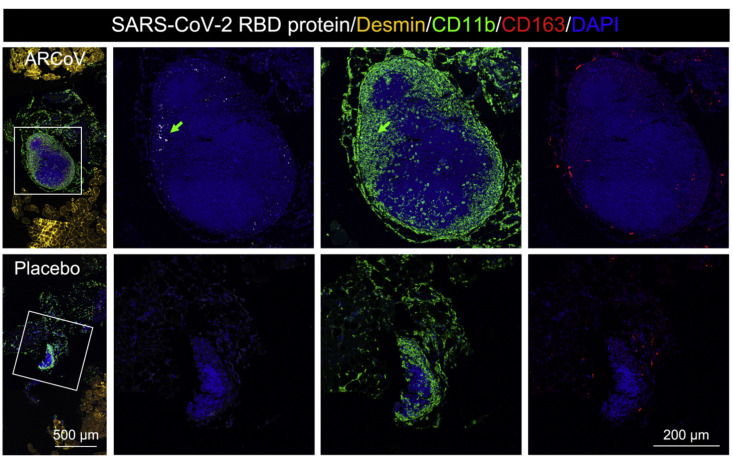
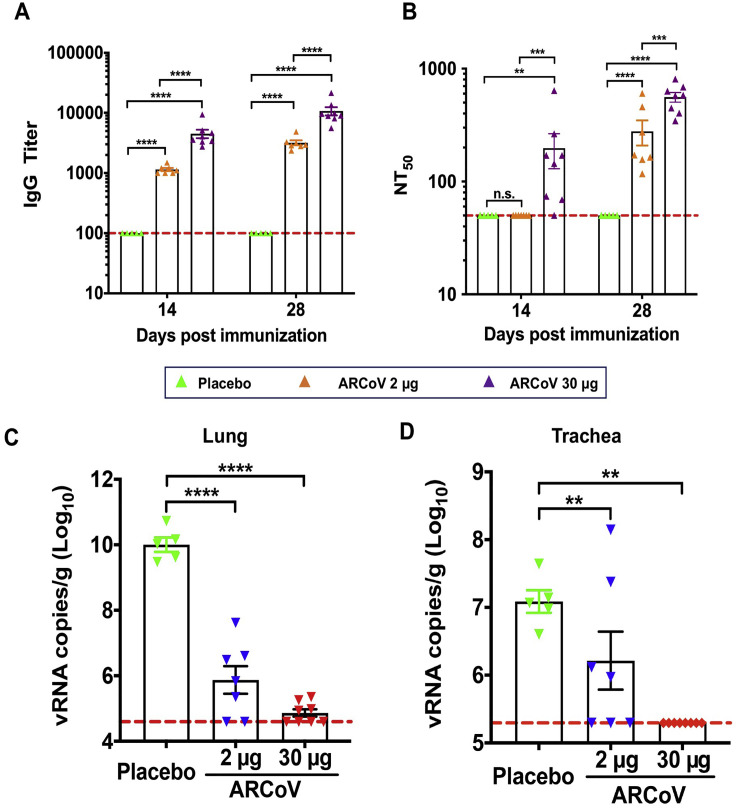
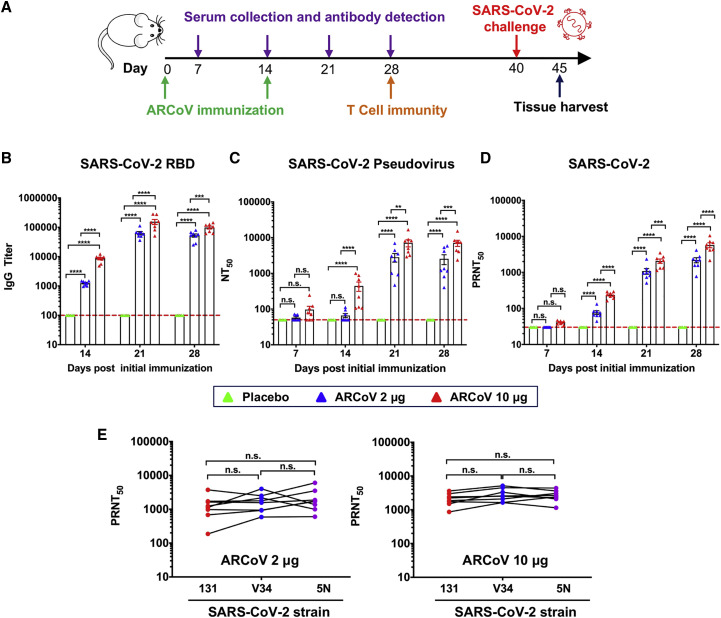
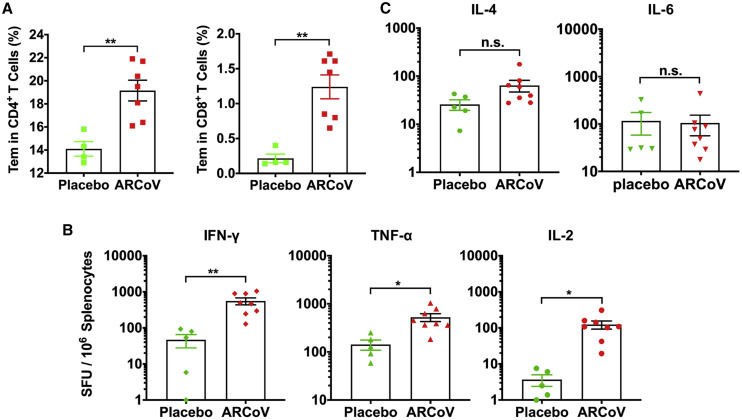
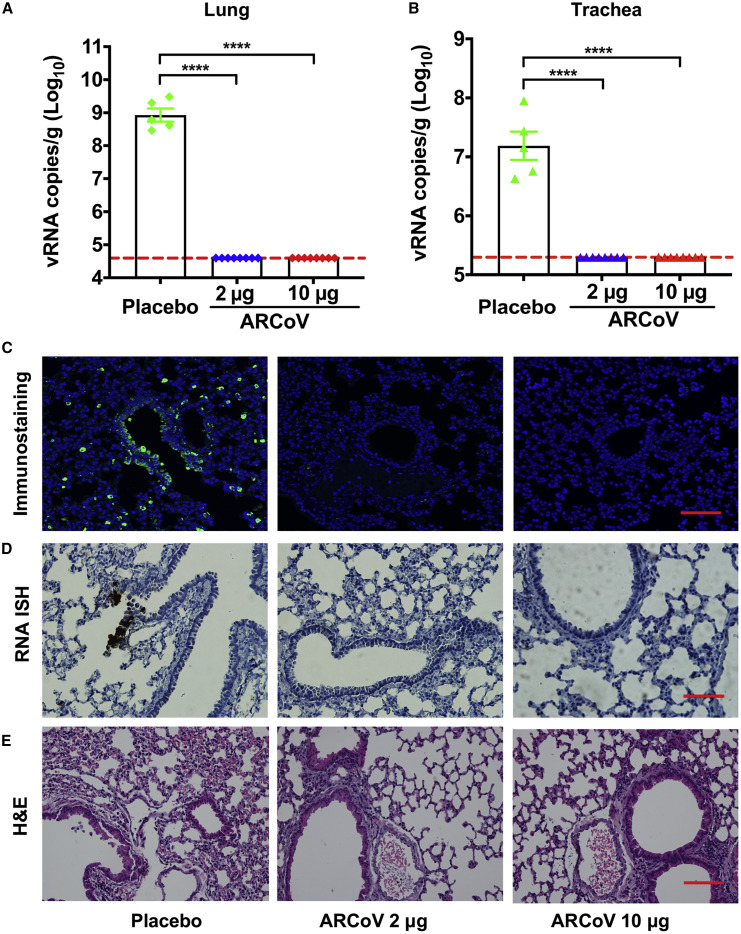
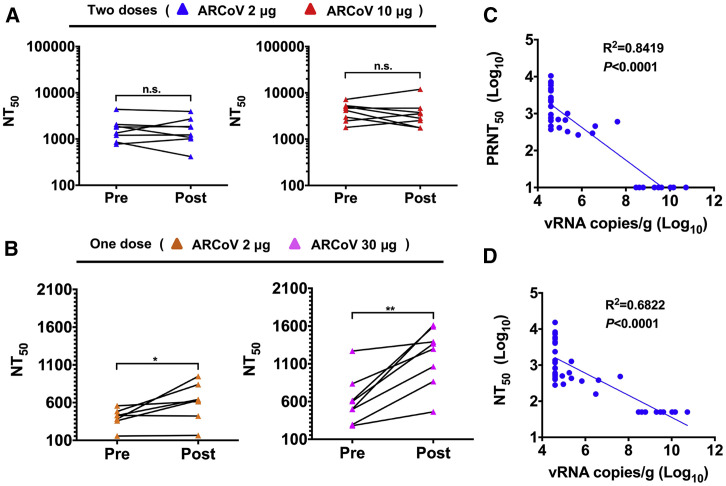
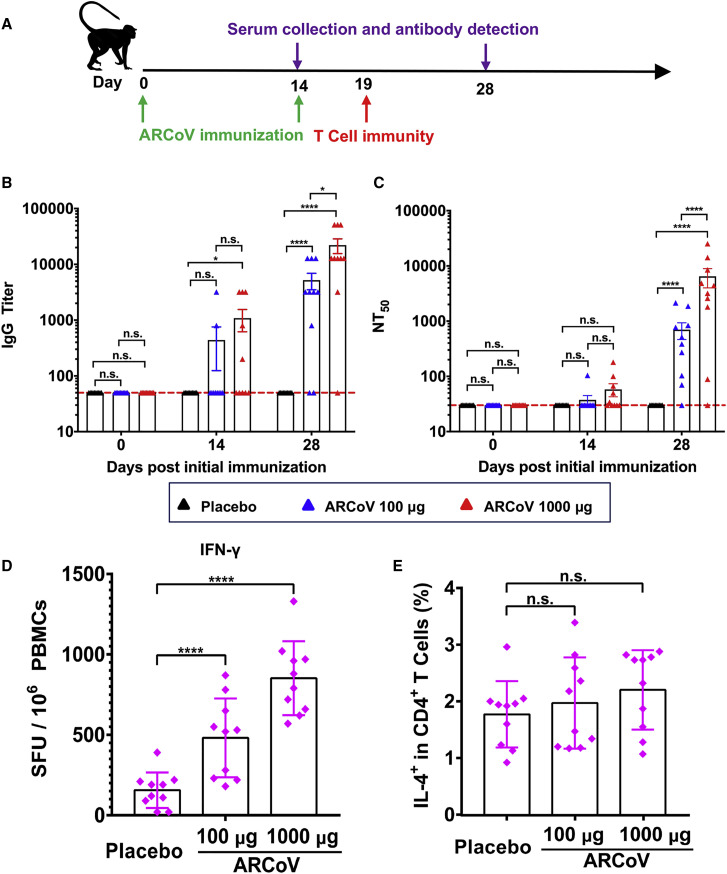
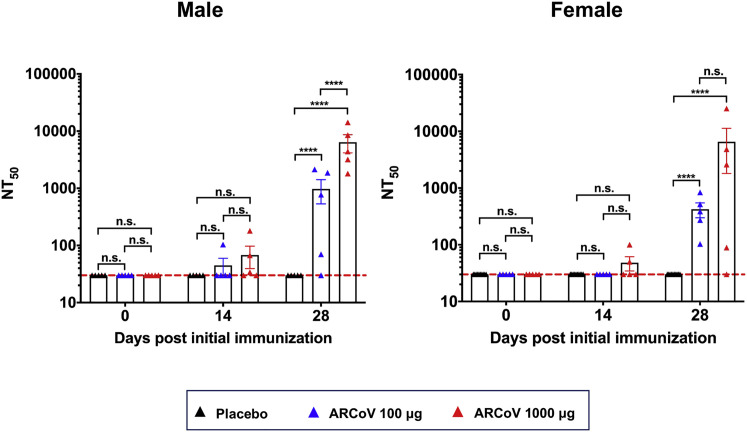
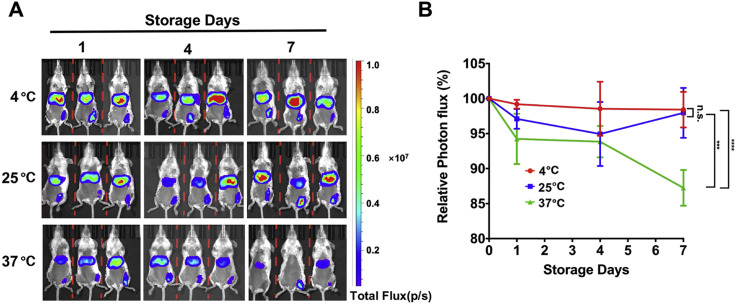
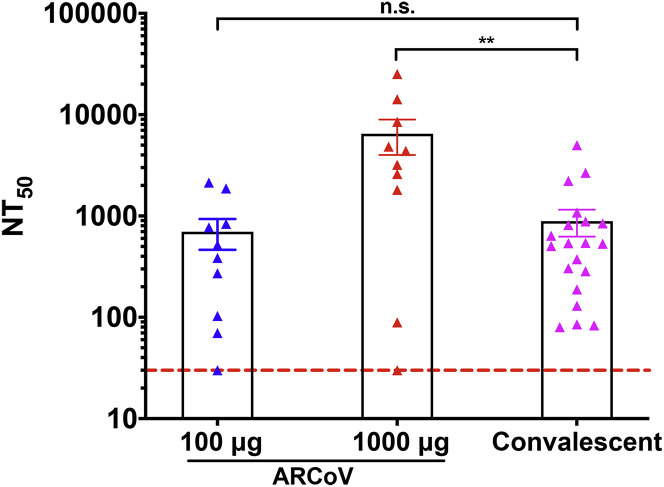
There is an urgent need for vaccines against coronavirus disease 2019 (COVID-19) because of the ongoing SARS-CoV-2 pandemic. Among all approaches, a messenger RNA (mRNA)-based vaccine has emerged as a rapid and versatile platform to quickly respond to this challenge. Here, we developed a lipid nanoparticle-encapsulated mRNA (mRNA-LNP) encoding the receptor binding domain (RBD) of SARS-CoV-2 as a vaccine candidate (called ARCoV). Intramuscular immunization of ARCoV mRNA-LNP elicited robust neutralizing antibodies against SARS-CoV-2 as well as a Th1-biased cellular response in mice and non-human primates. Two doses of ARCoV immunization in mice conferred complete protection against the challenge of a SARS-CoV-2 mouse-adapted strain. Additionally, ARCoV is manufactured as a liquid formulation and can be stored at room temperature for at least 1 week. ARCoV is currently being evaluated in phase 1 clinical trials.

Keywords: COVID-19; SARS-CoV-2; lipid nanoparticle; mRNA vaccine; mouse-adapted strain; non-human primate; protection.


Conflict of interest statement

Declaration of Interests C.-F.Q. and B.Y. are co-inventors on pending patent applications related to the ARCoV mRNA vaccine. B.Y., P.G., Y.J., H.-Y.Y., X.Z., X.-L.X., and Z.-Y.Z. are employees of Suzhou Abogen Biosciences.

Figures

None
Graphical abstract
Figure S1
Figure S1
Amino Acid Sequence Alignment of the Full S Protein of SARS-CoV-2 Isolates Used in This Study, Related to Figures 1 and 3 Invariant residues are shown as black dots. RBD sequences are shown in gray. Variant mutations are marked in light red.
Figure 1
Figure 1
Design and Encapsulation of mRNA Encoding the SARS-CoV-2 RBD (A) The mRNA construct of ARCoV expressing the SARS-CoV-2 RBD. (B) RBD protein expression from mRNA in HeLa, Huh7, Vero, or HEK293T cells. Cells were transfected with RBD-encoding mRNA (2 μg/mL), and immunoblotting was performed at 48 h after transfection. See also Figure S1. (C) Real-time association and dissociation of the RBD protein with biotin-ACE2. (D) Inhibition of cell entry of the SARS-CoV-2 pseudovirus by the mRNA-encoded RBD protein. Data are shown as mean ± SEM; unpaired t test. ∗∗∗∗p < 0.0001. (E) Immunofluorescence staining of the mRNA-encoded RBD protein with convalescent sera from three COVID-19 patients. Scale bar, 50 μm. (F) Representative intensity-size graph of ARCoV measured by dynamic light-scattering method. (G) Cryo-TEM image of ARCoV mRNA-LNP. Scale bar, 200 nm.
Figure S2
Figure S2
Characterization of Expression of the RDB Encoding mRNA, Related to Figure 1 (A) RBD expression in transfected HEK293F cells determined by ELISA. (B) Immunofluorescence analysis of RBD expression (FITC, green) in HeLa cells. HeLa cells were transfected with RBD mRNA (2 μg/ml), and RBD expression was detected with a panel of SARS-CoV-2 specific monoclonal antibodies at 24 hours post transfection. Nuclei was stained using Hhechst (blue). Scale bar: 50 μm.
Figure S3
Figure S3
Flow Sheet of mRNA-LNP Manufacture, Related to Figure 1 ARCoV is manufactured through rapid mixing of mRNA in aqueous solution and a mixture of lipids in ethanol. This process yields self-assembled LNPs with mRNA encapsulated inside. Tangential flow filtration was used to remove ethanol and to concentrate the solution. Following the Quality Control (QC) procedure, the final product was filtered into sterilized glass syringes or glass vials.
Figure 2
Figure 2
In Vivo Delivery of ARCoV mRNA-LNP Formulation (A) In vivo BLI of reporter mRNA-LNP in mice. Female BALB/c mice were inoculated with 10 μg of FLuc-encoding reporter mRNA-LNP via different routes and subjected to IVIS Spectrum imaging at the indicated times after administration. (B) Tissue distribution of reporter mRNA-LNP in mice. Empty LNP was employed as a control. (C) Expression of the mRNA-encoded RBD in mice. The serum concentration of the RBD was measured by ELISA 6 h after inoculation. Data are shown as mean ± SEM and analyzed using unpaired t test. ∗∗∗∗p < 0.0001. (D) Multiplex immunostaining analysis for expression of LNP-delivered mRNA in mouse muscle tissues. Female BALB/c mice (n = 3) were immunized with 10 μg of ARCoV mRNA-LNP, and empty LNP was used as a control (n = 3). Muscle tissue at the injection site was collected 6 h after injection and subjected to multiplex immunofluorescent staining for SARS-CoV-2 RBD (white) as well as other cell markers, including Desmin (gold), CD11b (green), CD163 (red), and CD103 (magenta). Magnifications of the areas boxed in white are shown on the right. Arrows indicate double-positive-stained cells. See also Figure S4. (E) The expression of LNP-delivered mRNA in mouse liver. Liver tissue collected 6 h after injection was stained for the SARS-CoV-2 RBD (white) and multiple cell markers for glutamine synthetase (green), CD31 (magenta), CD163 (cyan), and Arg1 (red). Magnifications of the areas boxed in white are shown on the right. Arrows indicate the double-positive-stained cells. CV, central vein.
Figure S4
Figure S4
SARS-CoV-2 RBD Expression Profile in Muscle Tissue of ARCoV-Immunized Mice, Related to Figure 2 Intramuscular injection of ARCoV induced local RBD expression in intramuscular lymph nodes. Multiplex immunofluorescent staining of intramuscular injection sites showed SARS-CoV-2 RBD and CD11b-positive monocytes expression in the intramuscular lymph nodes of the ARCoV mRNA-LNP -inoculated mice. Scale bar: 500 μm. Magnifications of the areas boxed in white are shown on the right. Colored arrows indicate the double-stained cells that are magnified beside. Scale bar: 200 μm.
Figure S5
Figure S5
Immunogenicity and Protection of a Single Dose of ARCoV in Mice, Related to Figure 3 BALB/c mice were intramuscularly immunized with 2 μg (n = 7) or 30 μg (n = 8) of the ARCoV vaccine or Placebo (n = 5). Serum was collected at 14, 28 days post immunization and analyzed by ELISA (A) and pseudovirus neutralization assay (B). Data are shown as mean ± SEM. Significance was calculated using a two-way ANOVA with multiple comparison tests (n.s., not significant; ∗∗p < 0.01; ∗∗∗p < 0.001; ∗∗∗∗p < 0.0001). Six to eight weeks after immunization, all immunized mice were inoculated intranasally with the SARS-CoV-2 mouse-adapted strain MASCp6, and their lungs (C) and trachea (D) were collected for detection of viral RNA loads at 5 days post challenge. Data are shown as mean ± SEM; Significance was calculated using a one-way ANOVA with multiple comparison tests. (∗∗p < 0.01; ∗∗∗∗p < 0.0001).
Figure 3
Figure 3
Humoral Immune Response in ARCoV-Vaccinated Mice Female BALB/c mice were immunized i.m. with 2 μg (n = 8) or 10 μg (n = 8) of ARCoV or a placebo (n = 5) and boosted with an equivalent dose 14 days later. Serum was collected 7, 14, 21, and 28 days after initial vaccination. (A) Schematic diagram of immunization, sample collection, and challenge schedule. (B) The SARS-CoV-2-specific IgG antibody titer was determined by ELISA. (C and D) NT50 and PRNT50 were determined using VSV-based pseudovirus and infectious SARS-CoV-2, respectively. The dashed lines indicate the detection limit of the assay. Data are shown as mean ± SEM. Significance was calculated using a two-way ANOVA with multiple comparisons tests (n.s., not significant; p < 0.05, ∗∗p < 0.01, ∗∗∗p < 0.001, ∗∗∗∗p < 0.0001). (E) Serum cross-neutralization against SARS-CoV-2 epidemic strains in ARCoV-immunized mice. A plaque reduction neutralization test (PRNT) against the three SARS-CoV-2 epidemic strains was performed using mouse sera collected 28 days after initial immunization. Data were analyzed by one-way ANOVA with multiple comparisons tests. See also Figure S5.
Figure 4
Figure 4
SARS-CoV-2-Specific T Cell Immune Response in ARCoV-Vaccinated Mice (A) SARS-CoV-2 RBD-specific CD4+ and CD8+ Tem cells (CD44+CD62L) in splenocytes were detected by flow cytometry. (B and C) ELISPOT assay for IFN-γ, TNF-α, IL-2, IL-4, and IL-6 in splenocytes. Data are shown as mean ± SEM. Significance was calculated using unpaired t test (n.s., not significant, p < 0.05, ∗∗p < 0.01).
Figure S6
Figure S6
Serum Neutralization Comparison between SARS-CoV-2 Clinical Isolate and the Mouse-Adapted Strain MASCp6, Related to Figure 5 Standard PRNT assay were performed with sera from ARCoV immunized mice (n = 15) using SARS-CoV-2 strains 131 and MASCp6, respectively. Data are analyzed by paired t test. (n.s., not significant).
Figure 5
Figure 5
Protection of ARCoV against SARS-CoV-2 Challenge in Mice Forty days after the initial immunization, mice were inoculated i.n. with the mouse-adapted SARS-CoV-2 (MASCp6), and the indicated tissues were collected 5 days after challenge for detection of viral loads and lung pathology. (A and B) Viral RNA loads in the lungs and trachea were determined by qRT-PCR. Data are shown as mean ± SEM (∗∗∗∗p < 0.0001). (C) Immunostaining of lung tissues with a SARS-CoV-2 S-specific mAb. Scale bar, 100 μm. (D) ISH assay for SARS-CoV-2 RNA. Scale bar, 50 μm. Positive signals are shown in brown. (E) H&E staining of lung pathology. Scale bar, 100 μm. Representative images from 4 or 5 mice are shown. See also Figure S5.
Figure 6
Figure 6
Immune Correlate of Protection against SARS-CoV-2 in ARCoV-Vaccinated Mice (A and B) Paired sera were collected from animals receiving two doses (2 or 10 μg) or a single dose (2 or 30 μg) of vaccination before (Pre) and 5 days after (Post) SARS-CoV-2 challenge. The NT50 values were analyzed for differences using a paired t test (n.s., not significant, p < 0.05, ∗∗p < 0.01). (C and D) Correlations of viral loads and protective efficacy by PRNT50 and NT50. Animals receiving a placebo (n = 10) and ARCoV (n = 31) vaccination were included in this analysis. The p values and R2 values reflect Spearman rank-correlation tests. See also Figure S5.
Figure 7
Figure 7
Immunogenicity of ARCoV in Cynomolgus Macaques Three- to six-year-old male or female cynomolgus macaques were immunized i.m. with 100 μg (n = 10) or 1,000 μg (n = 10) of ARCoV and boosted with the same dose at a 14-day interval. Serum was collected on days 0, 14, and 28 after initial immunization and subjected to antibody assays. (A) Schematic diagram of ARCoV immunization, sample collection, and immunological assays. (B and C) The IgG titers and NT50 values were determined by ELISA and SARS-CoV-2 pseudovirus neutralization assay, respectively. Dotted lines indicate the limits of detection. Data are shown as mean ± SEM. Significance was calculated using two-way ANOVA with multiple comparisons tests (n.s., not significant, p < 0.05, ∗∗∗∗p < 0.0001). (D and E) Production of IFN-γ or IL-4 in PBMCs stimulated by the SARS-CoV-2 RBD was measured by ELISPOT assay or flow cytometry. Data are shown as mean ± SEM. Significance was calculated using one-way ANOVA with multiple comparisons tests (n.s., not significant, ∗∗∗∗, p < 0.0001). See also Table S4.
Figure S7
Figure S7
Neutralizing Antibody Response in Male and Female Cynomolgus Monkeys, Related to Figure 7 Ten cynomolgus macaques were immunized intramuscularly with 100 μg or 1000 μg of ARCoV, respectively, and boosted with the same dose at a 14-day interval. The serum neutralizing antibody titers from male and female macaques were calculated respectively. Dotted lines indicate the limits of detection. Significance was calculated using a one-way ANOVA with multiple comparison tests. (n.s., not significant, ∗∗∗∗p < 0.0001).
Figure S8
Figure S8
Thermostability of mRNA-LNP Formulations under Different Temperatures, Related to Figure 2 (A) BLI of FLuc expression in mice. The FLuc encoding mRNA-LNPs were stored at 4°C, 25°C or 37°C for 1, 4, and 7 days before being dosed to BALB/c mice. IVIS imaging was performed 6 hours post inoculation. (B) Photon flux was quantified from ROI analysis. The data are representative of at least three independent experiments, and error bars indicate the SEM. Significance was calculated using two-way ANOVA with multiple comparison tests. (n.s., not significant;∗∗∗p < 0.001; ∗∗∗∗p < 0.0001).
Figure S9
Figure S9
Comparison of Neutralizing Antibody Titers in ARCoV-Immunized Cynomolgus Monkeys and Convalescent Sera from COVID-19 Patients, Related to Figure 6 The serum neutralizing antibody titers were calculated from cynomolgus macaques immunized with 100 μg (n = 10) and 1000 μg (n = 10) ARCoV and COVID-19 patients’ convalescent sera (n = 20), respectively. Dotted lines indicate the limits of detection. Significance was calculated using a one-way ANOVA with multiple comparison tests. (n.s., not significant; ∗∗p < 0.01).

References

    1. Alameh M.G., Weissman D., Pardi N. Messenger RNA-Based Vaccines Against Infectious Diseases. Curr. Top. Microbiol. Immunol. 2020 doi: 10.1007/82_2020_202. Published online April 17, 2020. - DOI - PubMed
    1. Amanat F., Krammer F. SARS-CoV-2 Vaccines: Status Report. Immunity. 2020;52:583–589. - PMC - PubMed
    1. Bahl K., Senn J.J., Yuzhakov O., Bulychev A., Brito L.A., Hassett K.J., Laska M.E., Smith M., Almarsson Ö., Thompson J. Preclinical and Clinical Demonstration of Immunogenicity by mRNA Vaccines against H10N8 and H7N9 Influenza Viruses. Mol. Ther. 2017;25:1316–1327. - PMC - PubMed
    1. Becerra-Flores M., Cardozo T. SARS-CoV-2 viral spike G614 mutation exhibits higher case fatality rate. Int. J. Clin. Pract. 2020:e13525. - PMC - PubMed
    1. Callow K.A., Parry H.F., Sergeant M., Tyrrell D.A. The time course of the immune response to experimental coronavirus infection of man. Epidemiol. Infect. 1990;105:435–446. - PMC - PubMed

Publication types

MeSH terms