Review
. 2021 May:82:100897.
doi: 10.1016/j.preteyeres.2020.100897. Epub 2020 Aug 11.

Normal and glaucomatous outflow regulation

Affiliations
Review

Normal and glaucomatous outflow regulation

Ted S Acott et al. Prog Retin Eye Res. 2021 May.

Abstract

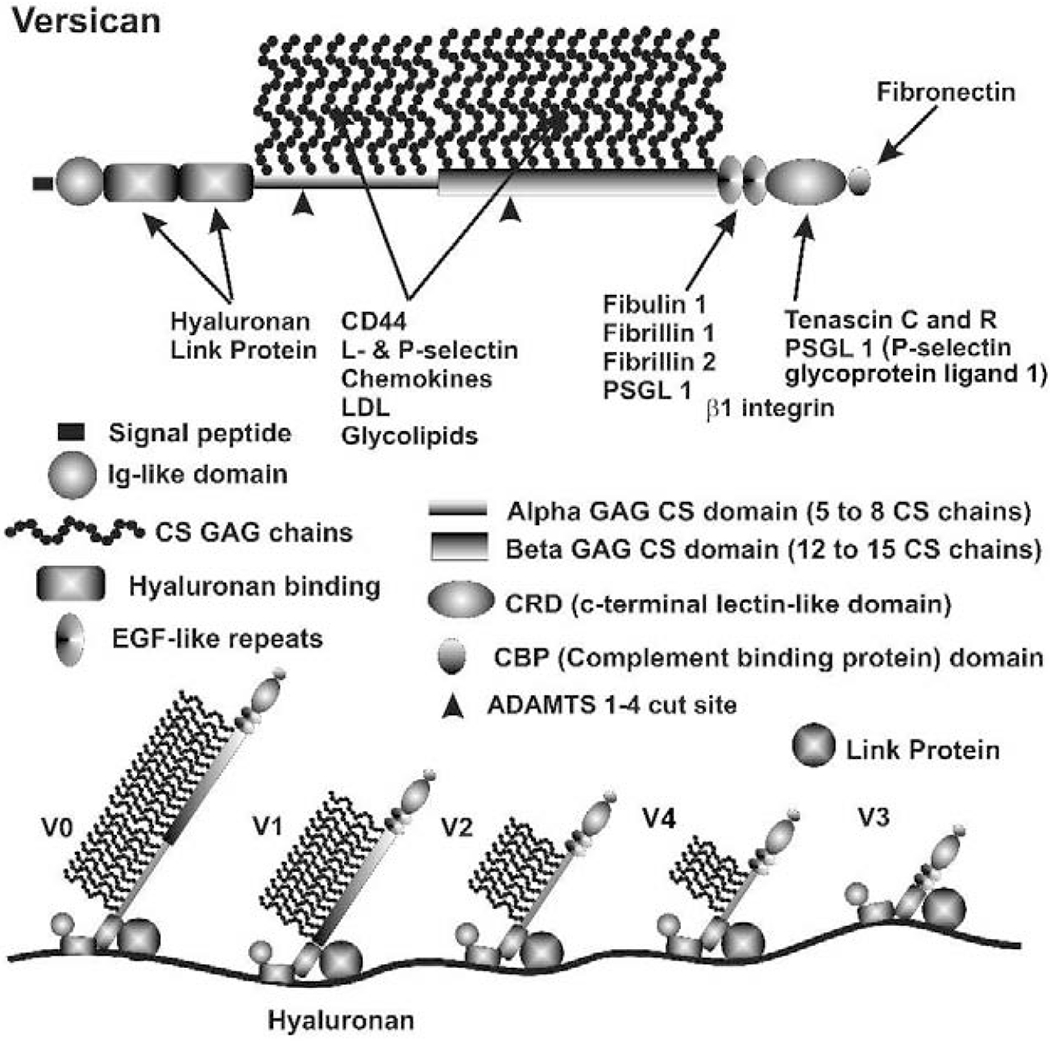
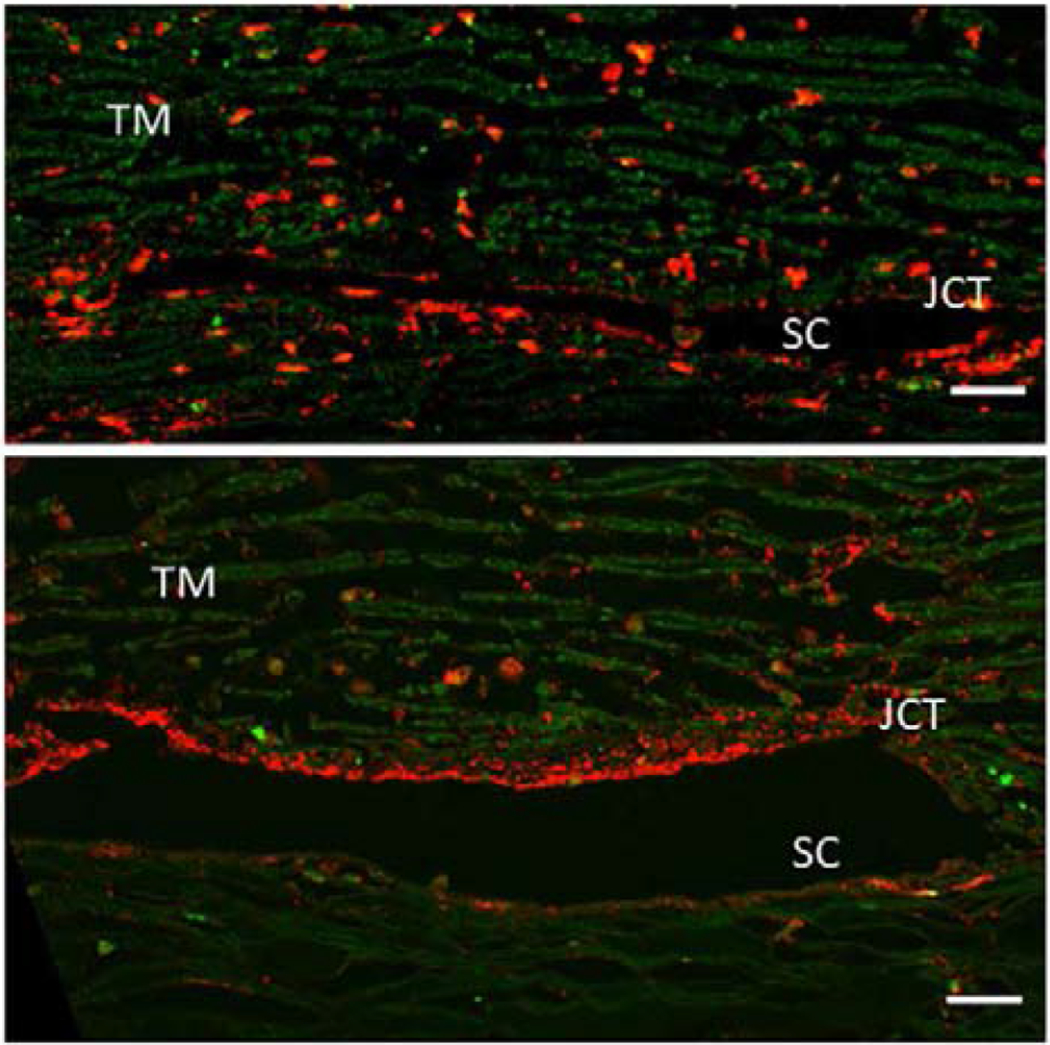
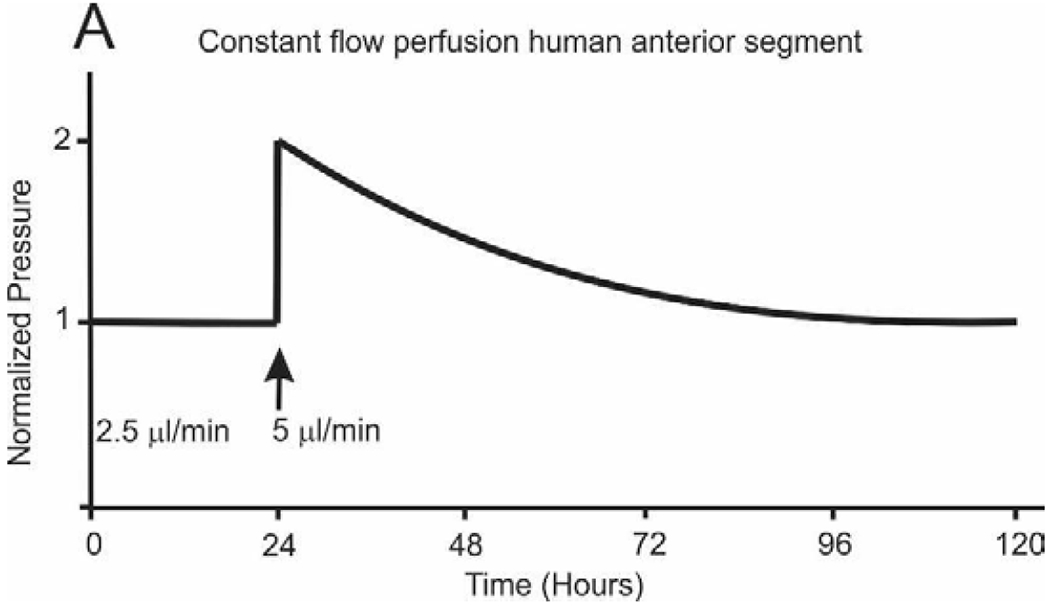
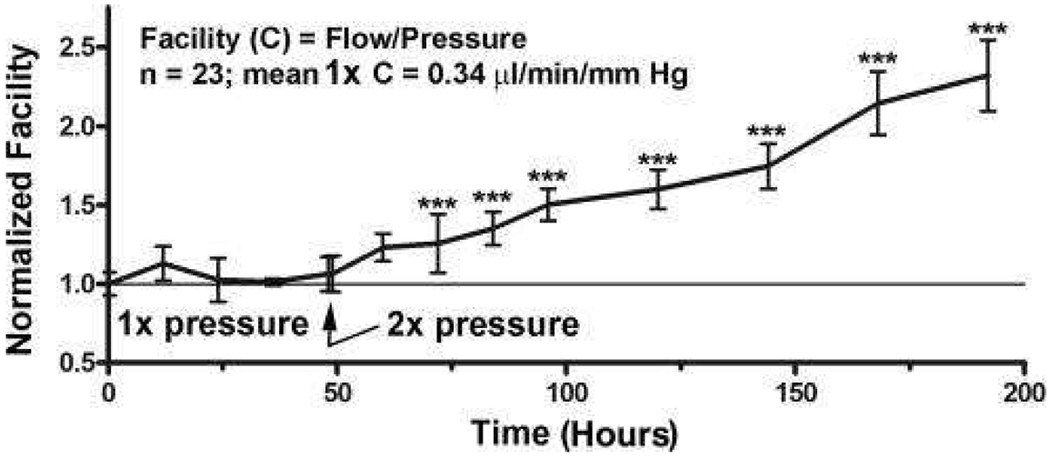
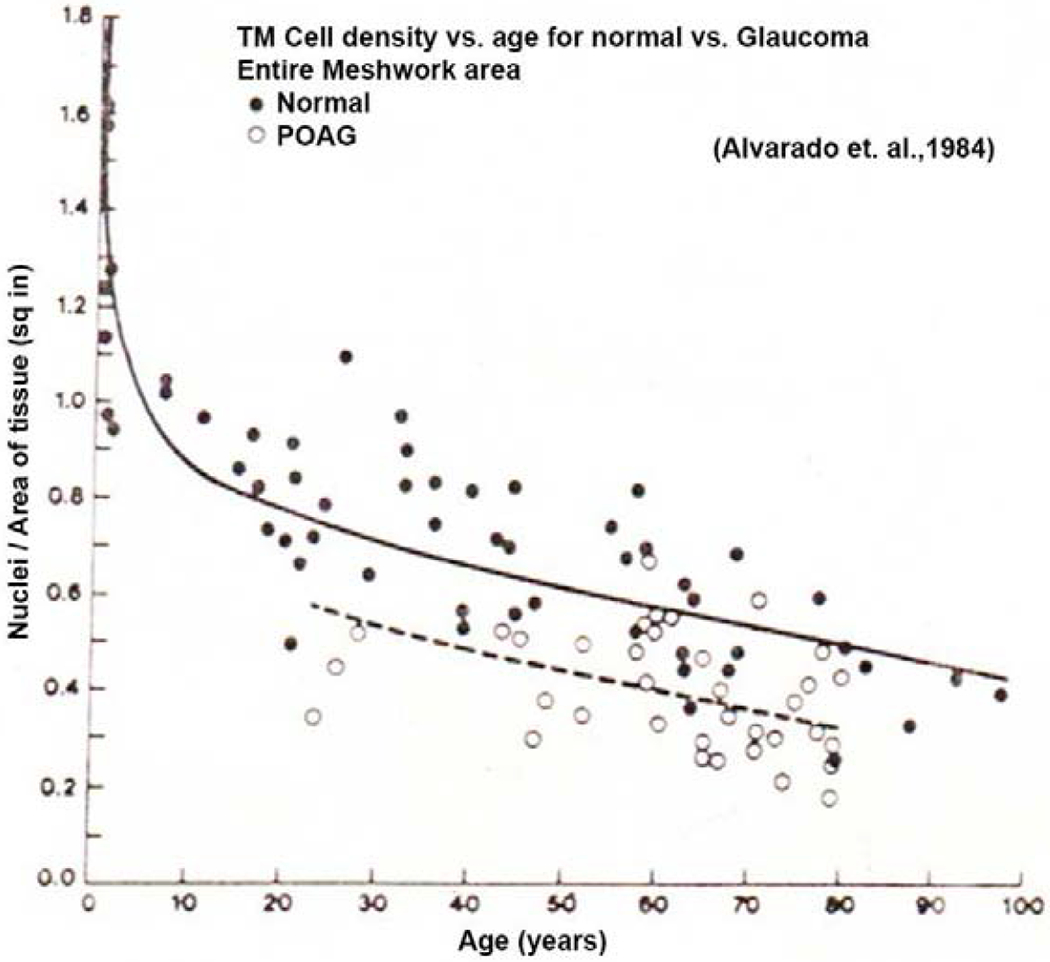
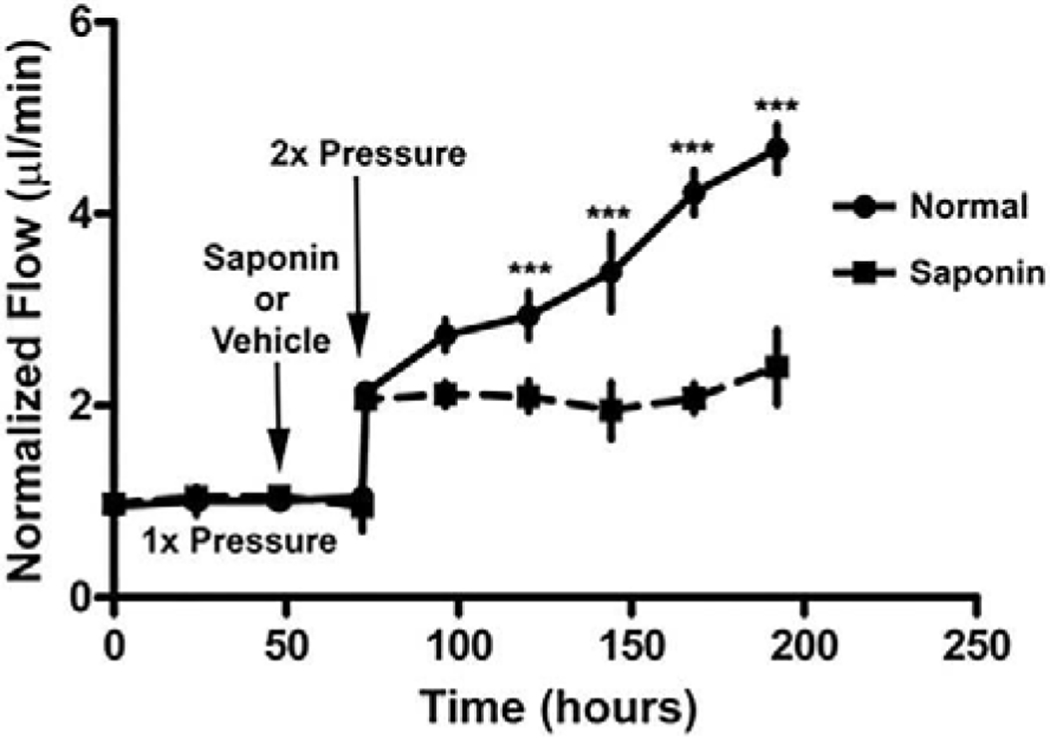
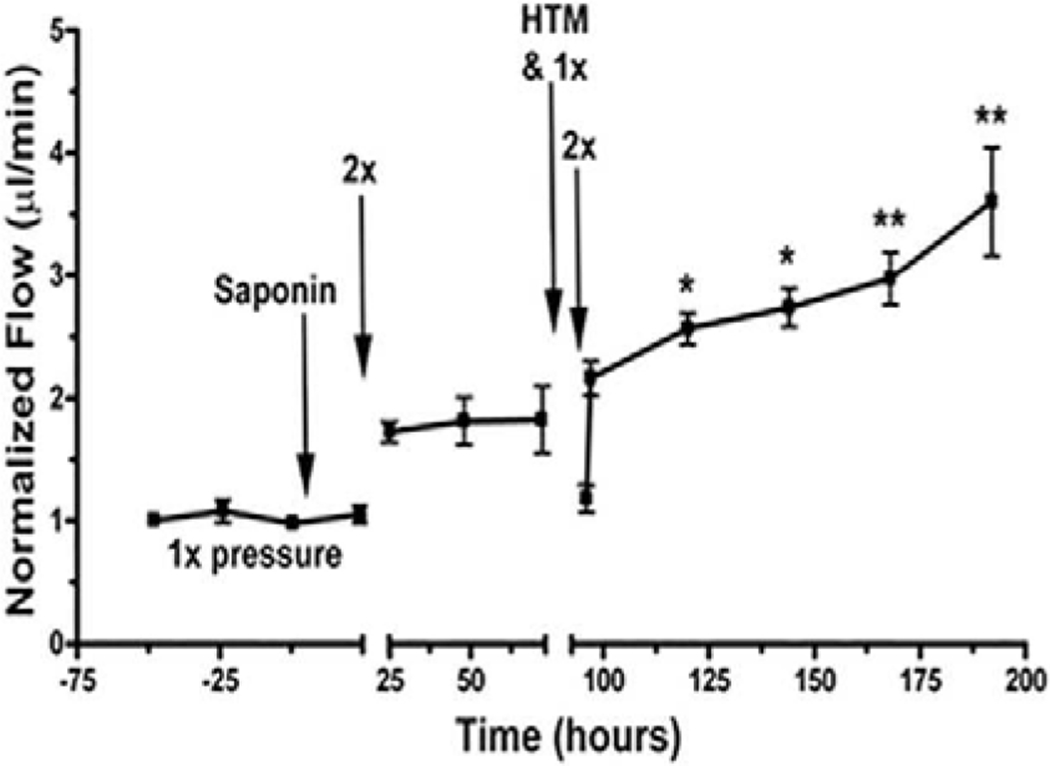
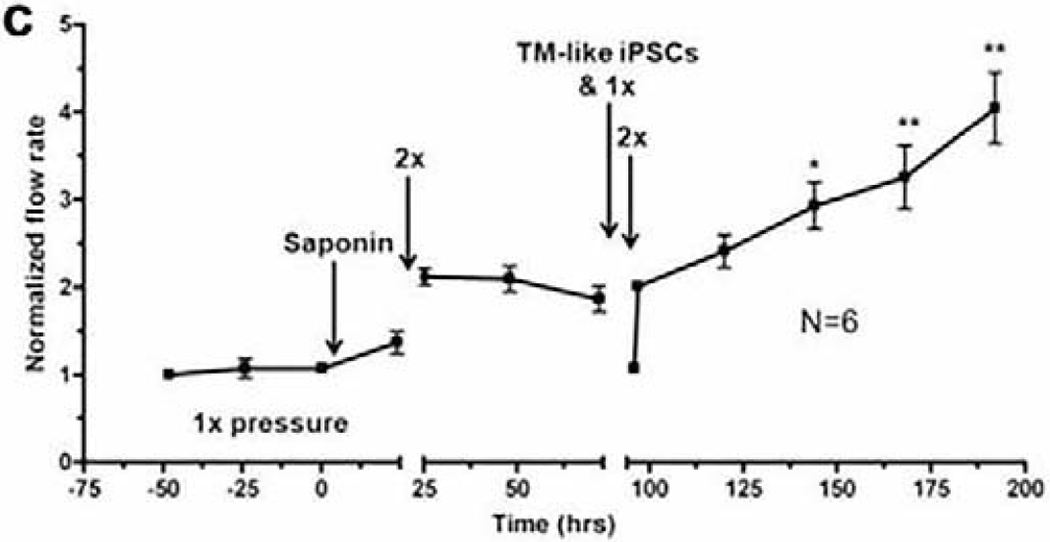
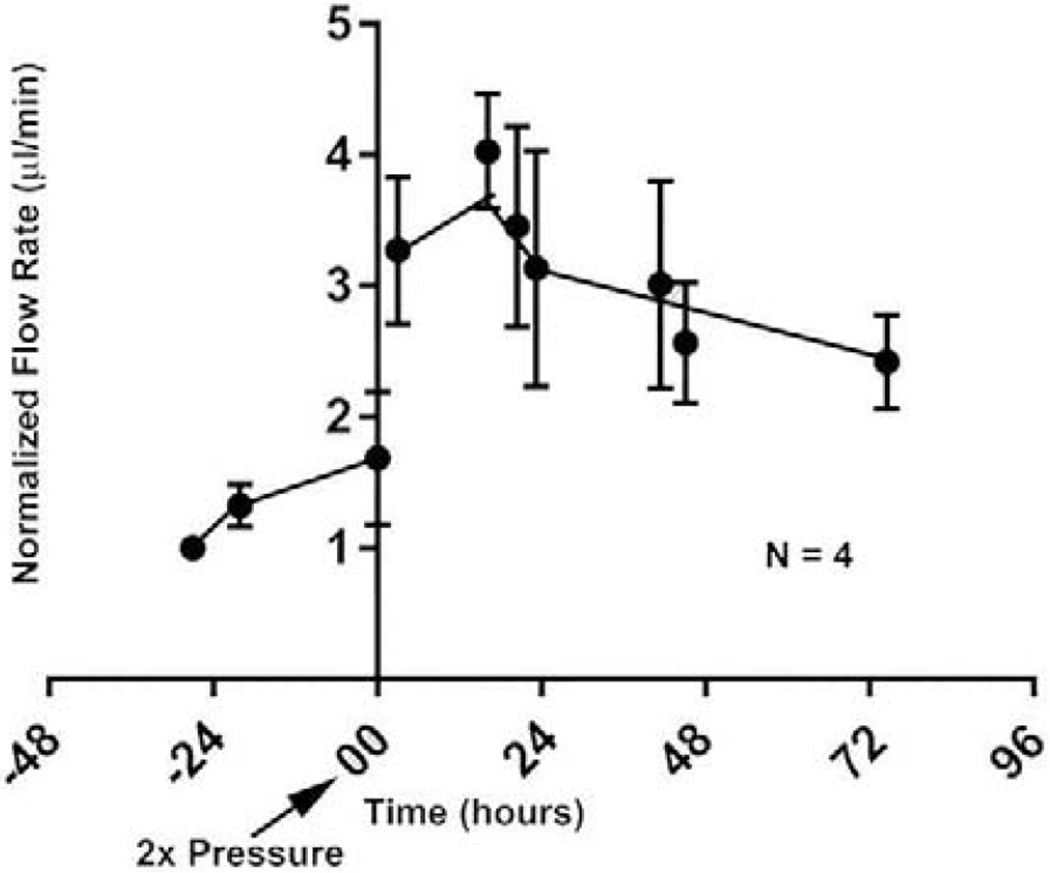
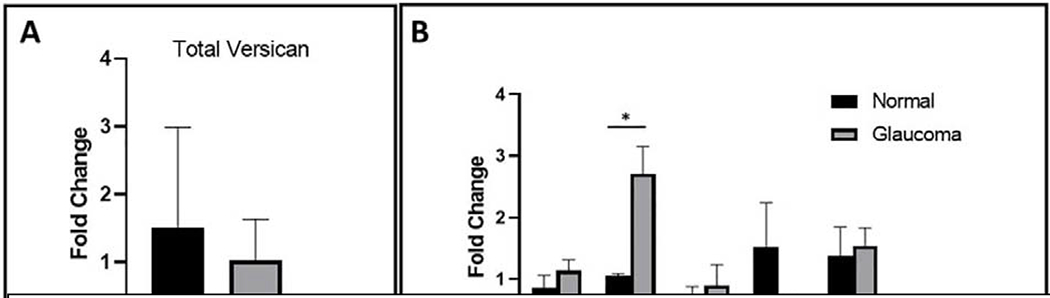
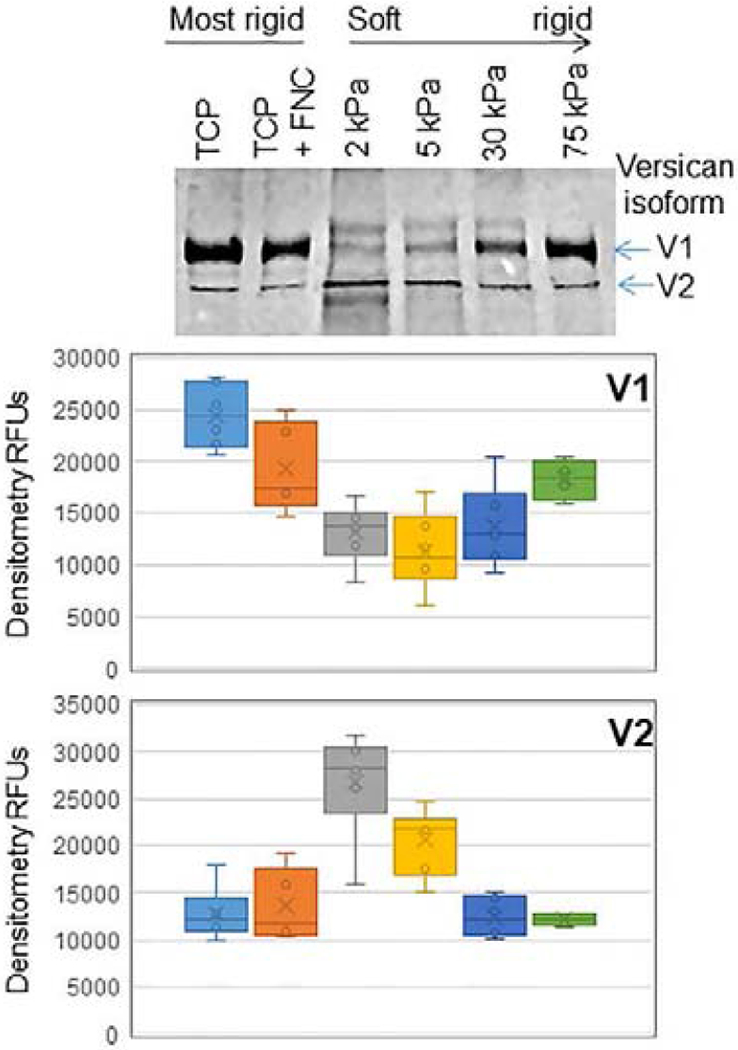
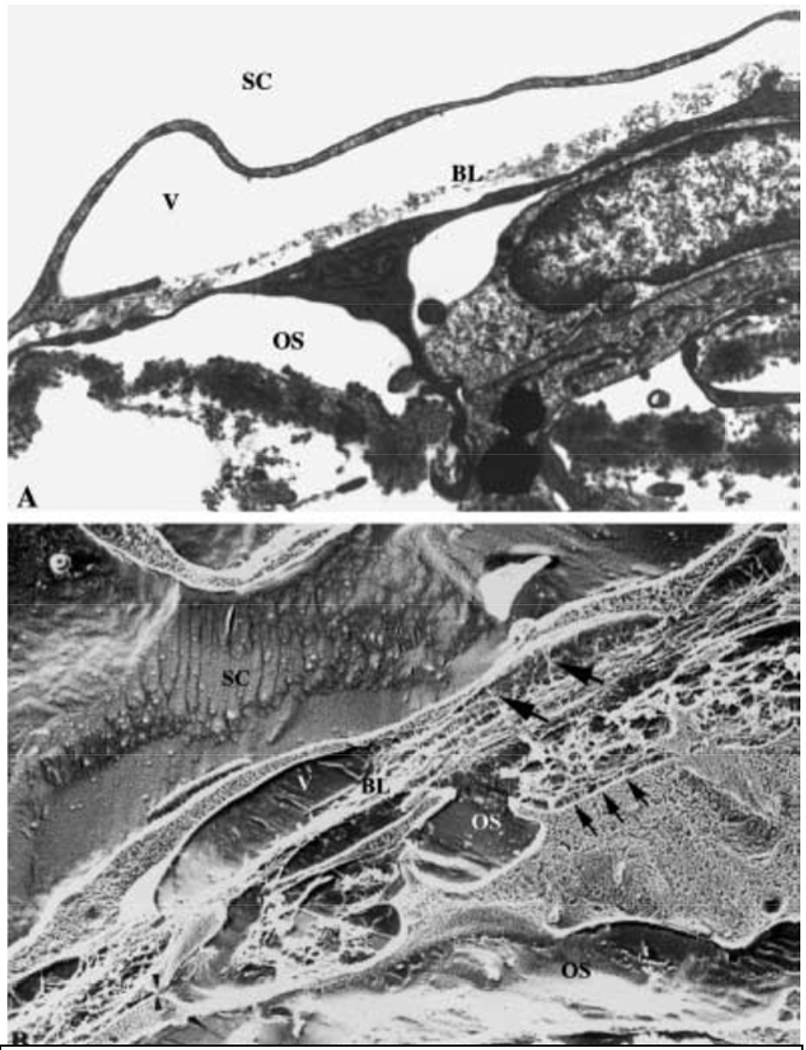
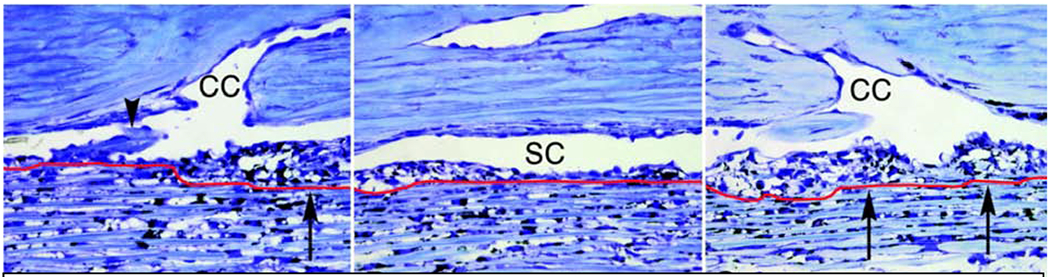
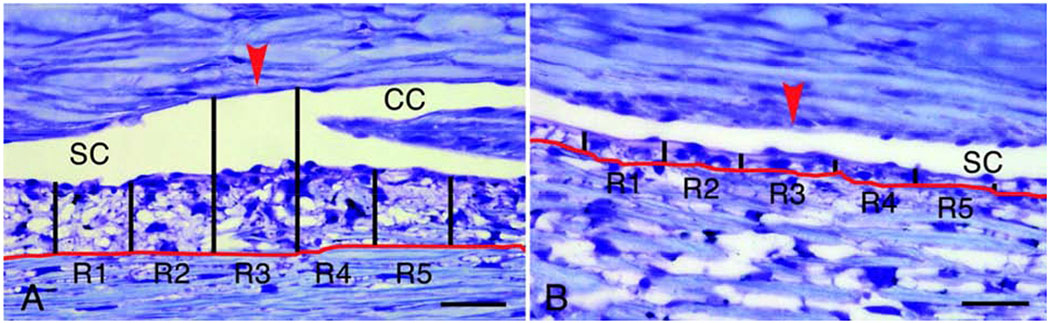
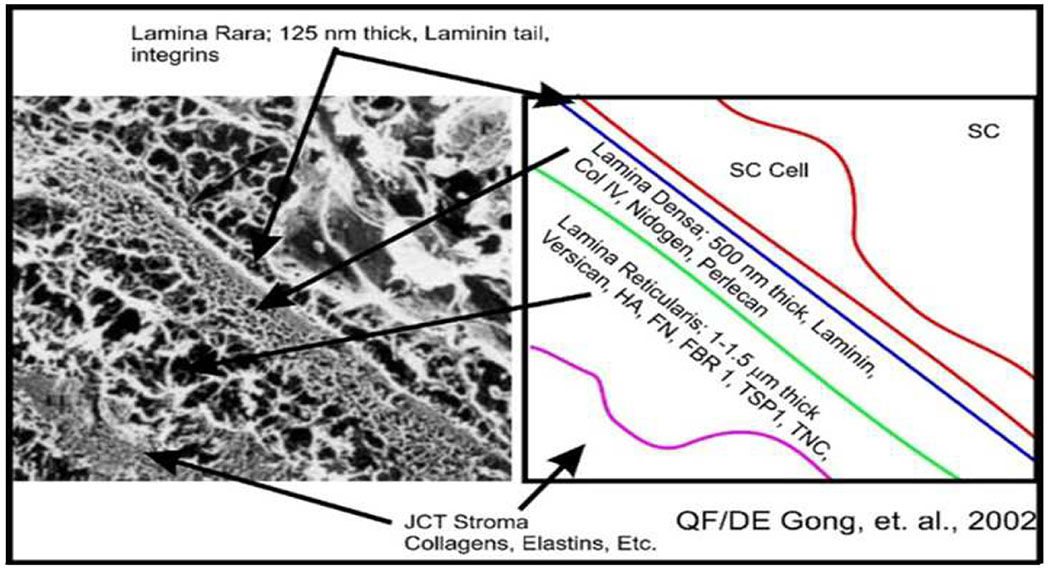
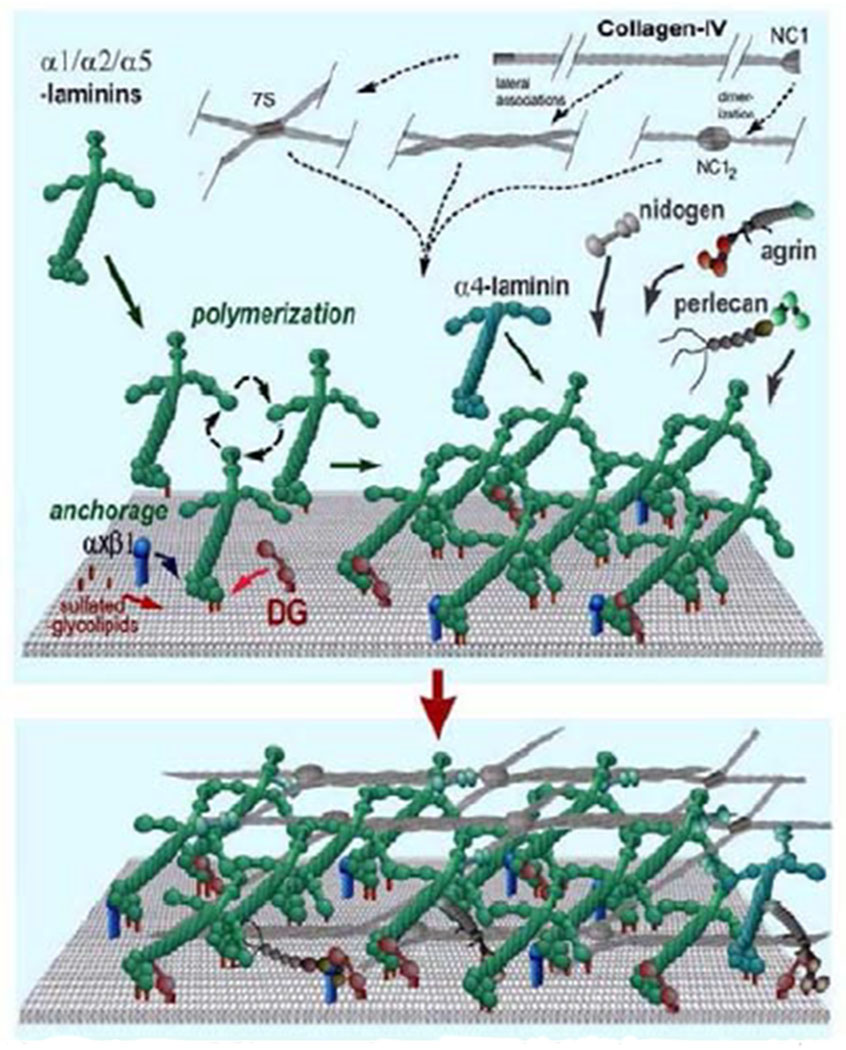
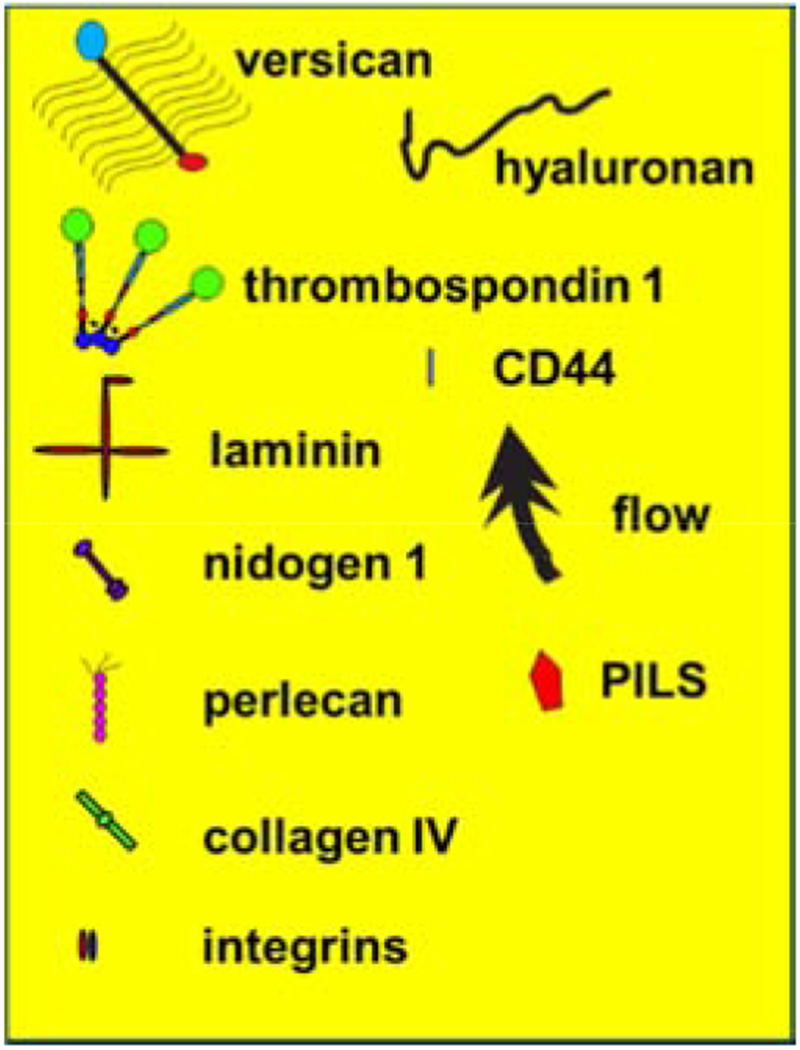
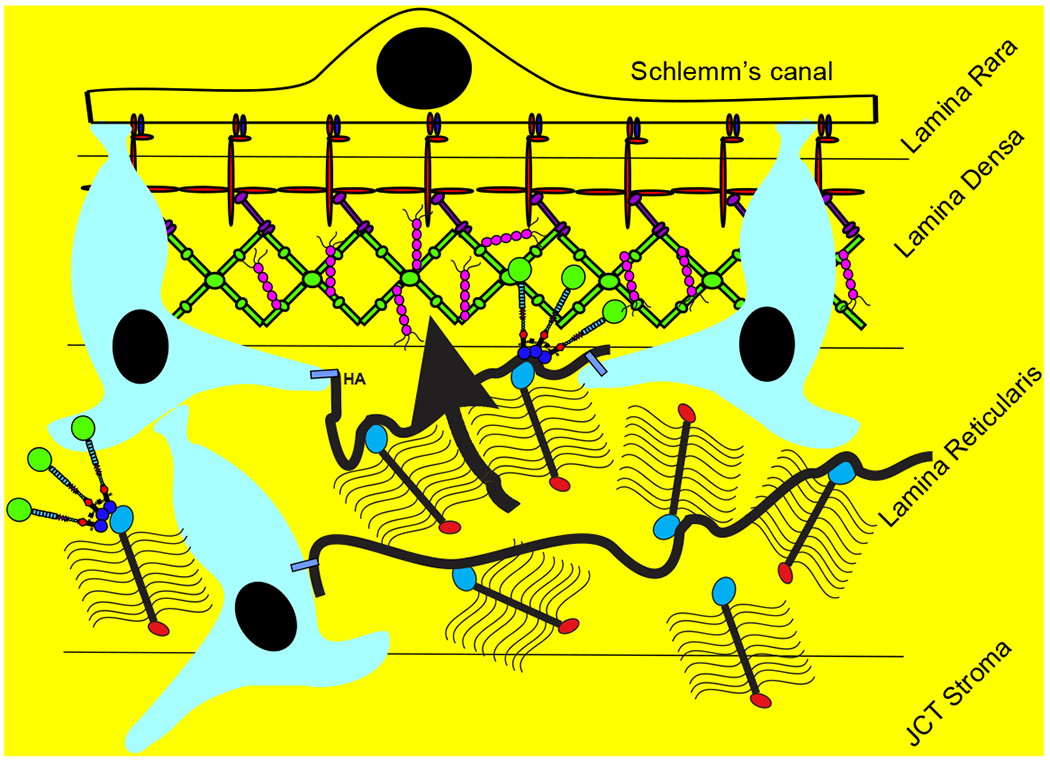
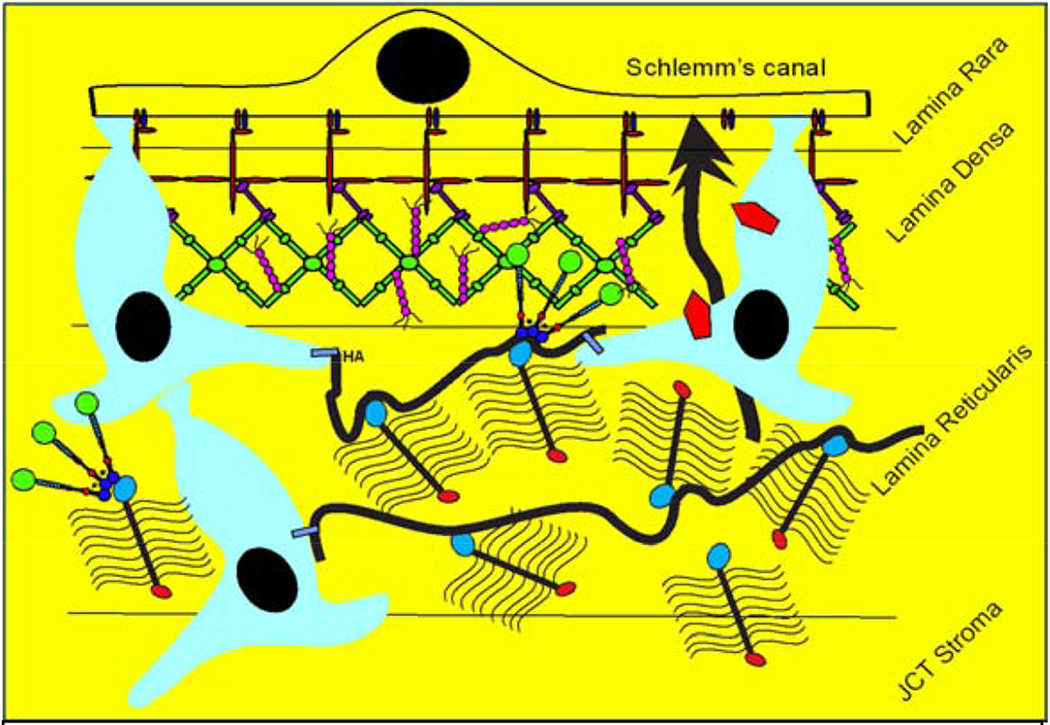
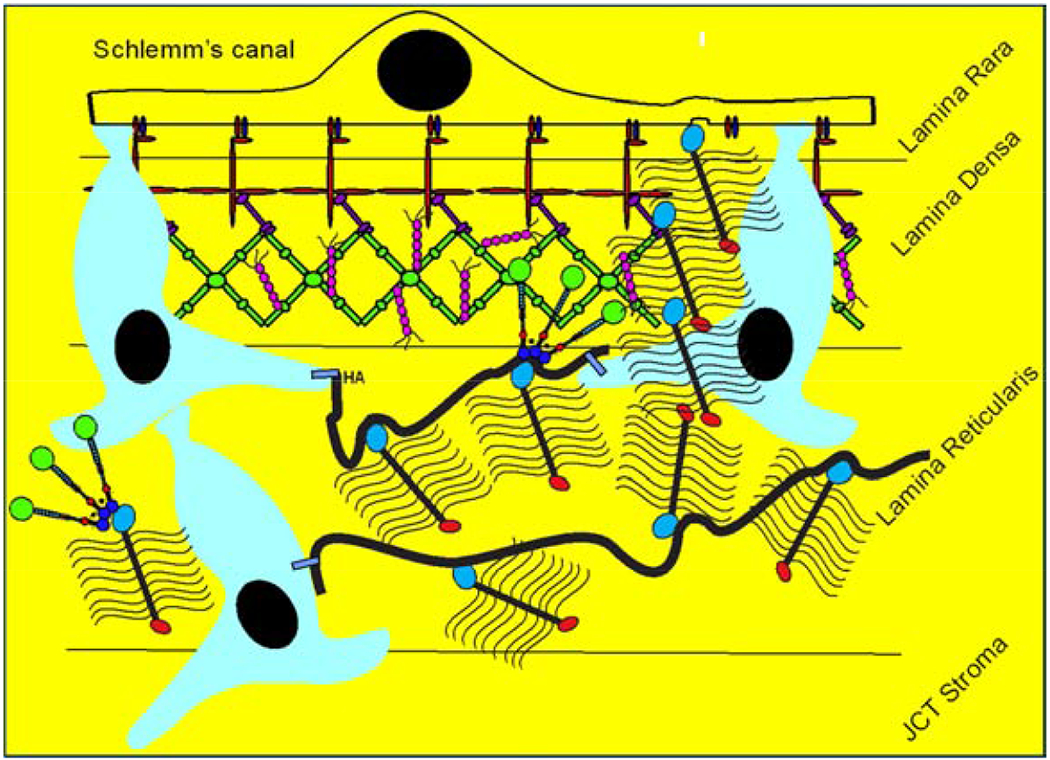
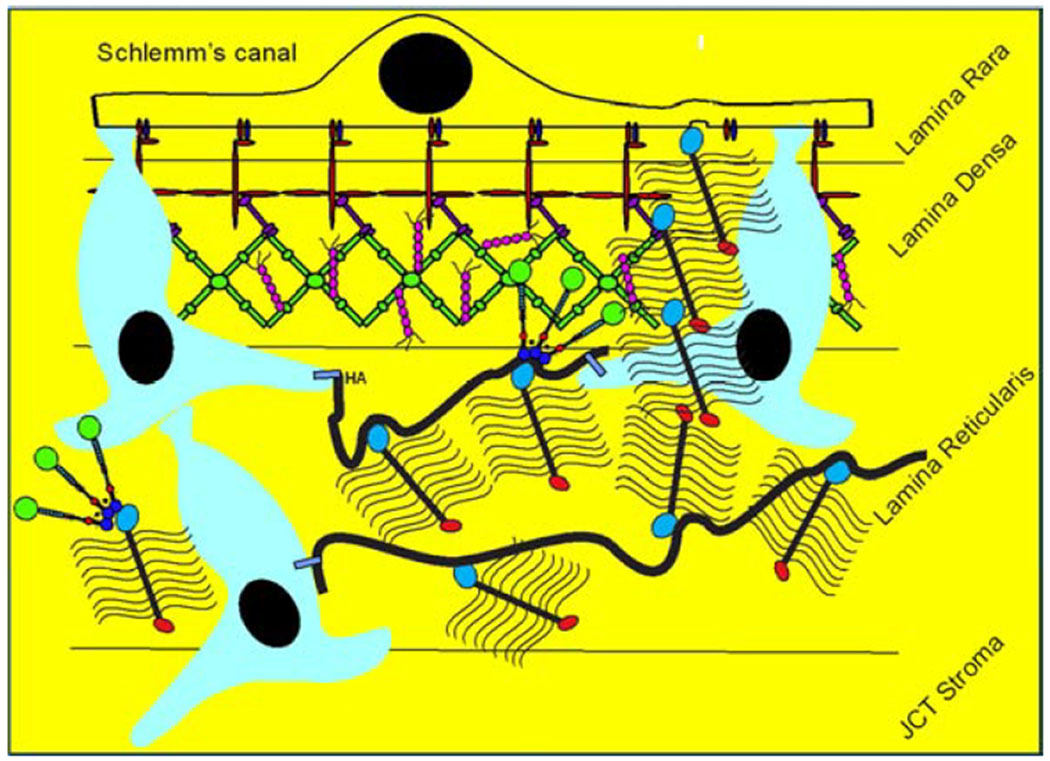
Glaucoma remains only partially understood, particularly at the level of intraocular pressure (IOP) regulation. Trabecular meshwork (TM) and Schlemm's canal inner wall endothelium (SCE) are key to IOP regulation and their characteristics and behavior are the focus of much investigation. This is becoming more apparent with time. We and others have studied the TM and SCE's extracellular matrix (ECM) extensively and unraveled much about its functions and role in regulating aqueous outflow. Ongoing ECM turnover is required to maintain IOP regulation and several TM ECM manipulations modulate outflow facility. We have established clearly that the outflow pathway senses sustained pressure deviations and responds by adjusting the outflow resistance correctively to keep IOP within an appropriately narrow range which will not normally damage the optic nerve. The glaucomatous outflow pathway has in many cases lost this IOP homeostatic response, apparently due at least in part, to loss of TM cells. Depletion of TM cells eliminates the IOP homeostatic response, while restoration of TM cells restores it. Aqueous outflow is not homogeneous, but rather segmental with regions of high, intermediate and low flow. In general, glaucomatous eyes have more low flow regions than normal eyes. There are distinctive molecular differences between high and low flow regions, and during the response to an IOP homeostatic pressure challenge, additional changes in segmental molecular composition occur. In conjunction with these changes, the biomechanical properties of the juxtacanalicular (JCT) segmental regions are different, with low flow regions being stiffer than high flow regions. The JCT ECM of glaucomatous eyes is around 20 times stiffer than in normal eyes. The aqueous humor outflow resistance has been studied extensively, but neither the exact molecular components that comprise the resistance nor their exact location have been established. Our hypothetical model, based on considerable available data, posits that the continuous SCE basal lamina, which lies between 125 and 500 nm beneath the SCE basal surface, is the primary source of normal resistance. On the surface of JCT cells, small and highly controlled focal degradation of its components by podosome- or invadopodia-like structures, PILS, occurs in response to pressure-induced mechanical stretching. Sub-micron sized basement membrane discontinuities develop in the SCE basement membrane and these discontinuities allow passage of aqueous humor to and through SCE giant vacuoles and pores. JCT cells then relocate versican with its highly charged glycosaminoglycan side chains into the discontinuities and by manipulation of their orientation and concentration, the JCT and perhaps the SCE cells regulate the amount of fluid passage. Testing this outflow resistance hypothesis is ongoing in our lab and has the potential to advance our understanding of IOP regulation and of glaucoma.


Conflict of interest statement

Author statement

The authors believe they are in compliance with the “Ethics in publishing” guidelines

The authors have no financial conflicts of interest

The authors have avoided redundant or concurrent publications, although portions of the work described have been published and are indicated as such and some figures will require permission from the original publication and we will obtain that before publication

The authors have attempted to use inclusive language without using race, sex, culture, his/her, etc.

Author contribution is indicated in the full manuscript

The first author contributed more and all other authors contributed equally and are all to be considered equivalent second authors

Funding sources are listed

We would prefer to publish this as Open Access, if possible

Figures

Figure 1.
Figure 1.
Versican properties, structure, binding sites and isoforms (Acott and Kelley, 2008) and based on a figure from (Wight, 2002). V4 isoform was also added.
Figure 2.
Figure 2.
A pair of human eyes was perfused at 1X (top panel) or 2X pressure (bottom panel) for 48 hours. Tissues were fixed, radial paraffin sections were cut and immunostained with an ADAMTS4 polyclonal antibody (red). ADAMTS4 is reduced in the corneoscleral TM but becomes highly upregulated in the juxtacanalicular (JCT) region of the TM tissue in 2X pressure. The immunostaining is also more punctate in 2X tissue compared to 1x tissue. Green = autofluorescence. SC= Schlemm’s canal. Scale bar = 20 μm. (Keller et al., 2009b)
Figure 3.
Figure 3.
Idealized curve of IOP homeostatic response to 2x pressure challenge initiated by doubling flow rate. Perfusion stabilized at 1x and then flow doubled to 2x which doubles the pressure. Over several days, the outflow resistance is reduced and pressure returns. Modeled after study by Bradley, et. al., (Bradley et al., 2001).
Figure 4.
Figure 4.
IOP homeostasis with constant pressure perfusion in human anterior segments (Acott et al., 2014; Acott et al., 2016). Perfusion at 1x pressure (8.8mm Hg) gives a normalized facility of 1.0 and doubling the pressure to 2x doubles the outflow immediately but the facility (~flow/pressure) does not change. However, over the next few days maintaining pressure at 2x, the resistance is decreased as the outflow system is attempting to compensate and the flow rate and facility increase. N=23 separate human anterior segments and significance was determined by one-way ANOVA with Dunnett’s Multiple Comparison Test.
Figure 5.
Figure 5.
Signal transduction following mechanical stretch of TM cells producing increased translation of MMP2 and MMP14 (Bradley et al., 2003). Mechanical stretching triggers the PKB, PI3K, mTOR and p70S6K pathways and works through several downstream modulators to initiate MMP-2 and MMP-14 translation.
Figure 6.
Figure 6.
TM cell density as a function of age for normal and glaucomatous eyes (Alvarado et. al., 1984). N = 36 human eyes.
Figure 7.
Figure 7.
Saponin glaucoma cell loss model and IOP homeostatic effect (Abu-Hassan et al., 2015). Treatment with saponin which kills approximately 30% of TM cells, does not immediately change outflow facility at 1x or at 2x but does block the IOP homeostatic response to a pressure challenge over the next few days. N=8 normal and =17 saponin with one-way ANOVA for *** = P<0.001.
Figure 8.
Figure 8.
Restoration of IOP homeostatic response after transplantation of 300,000 TM cells to saponin model (Abu-Hassan et al., 2015). N=6 and one-way ANOVA where * = P<0.05 and ** = P<0.001.
Figure 9.
Figure 9.
Restoration of IOP homeostatic response after transplantation of TM-like iPSCs (Abu-Hassan et al., 2015). TM-like iPSCs (300,000) restored IOP homeostatic response where N=6 and one-way ANOVA where * = P<0.05 and ** = P<0.001.
Figure 10.
Figure 10.
Loss of IOP homeostatic response by glaucomatous anterior segments (Raghunathan et al., 2018). N=4 glaucomatous eyes from 3 individuals and lack of significance was determined by one-way ANOVA with Dunnet’s Multiple Comparison Test.
Fig. 11.
Fig. 11.
Versican isoform mRNA levels in normal and glaucoma TM cells. Total RNA was isolated from primary cultured human TM cells from normal (n = 3) or glaucomatous (n = 4) donors. (A) Expression levels of total versican and (B) of each versican isoforms (V0-V4) were measured using quantitative RT-PCR. Fold change of each isoform was normalized to total levels of versican. Statistical significance was determined using unpaired two-tailed t-tests, where p<0.05 was considered significant (“*”) (Raghunathan et al., 2018).
Figure 12.
Figure 12.
Human TM cells grown for 48 hours on hydrogels of various stiffnesses (2-75 kPa). Conditioned serum-free media was subject to SDS-PAGE and Western immunoblots and probed with a versican monoclonal antibody (12C5; Developmental Studies hybridoma Bank, University of Iowa, Iowa). Densitometry was used to quantitate each of the gel bands and the relative fluorescent units (RFUs) were averaged. The line in the plots shows the median with N=6 technical replicates from 4 normal TM cell strains. TCP = tissue culture plastic; TCP + FNC = tissue culture plastic coated with fibronectin-collagen mixture that was used to coat the hydrogels. Isoforms V1 and V2 are shown.
Figure 13.
Figure 13.
TEM (A) and quick-freeze deep-etch SEM (B) of SCE and deep JCT (Gong et al., 2002). SC is Schlemm’s canal, V is giant vacuole, BL is basal lamina, OS is open space. Small arrows point to JCT-SCE connections, larger arrows point to SCE-ECM connections and arrowheads show JCT-JCT connections.
Figure 14.
Figure 14.
TM/SCE perfusion fixed at 10 (upper left) and 25mm Hg (other panels above and below) showing JCT region above the red line (Hann and Fautsch, 2009). Black lines and R#s in figure below were for their computations, CC is collector channel and SC is Schlemm’s canal, scale bar is 50 microns above and 20 micron below, black arrows show expanded JCT region.
Figure 14.
Figure 14.
TM/SCE perfusion fixed at 10 (upper left) and 25mm Hg (other panels above and below) showing JCT region above the red line (Hann and Fautsch, 2009). Black lines and R#s in figure below were for their computations, CC is collector channel and SC is Schlemm’s canal, scale bar is 50 microns above and 20 micron below, black arrows show expanded JCT region.
Figure 15.
Figure 15.
Quick-freeze deep-etch SEM of continuous SCE BM region on the left (Gong et al., 2002) with our diagrammatic characteristics on the right. Smaller two-headed arrow in SEM shows inner and outer SCE plasma membrane and arrows point to regions. Col is collagen, HA is hyaluronan, FN is fibronectin, FBR is fibrillin, TSP is thrombospondin and TNC is tenascin C.
Figure 16.
Figure 16.
Basal lamina assembly (Yurchenco and Patton, 2009).
Figure 17.
Figure 17.
Component key for figures 18–22. The JCT cells are blueish and the SCE cell lies on top of the image with its roundish nucleus.
Figure 18.
Figure 18.
Resistance model with continuous basement membrane (lamina densa) and flow restricted.
Figure 19.
Figure 19.
Resistance model with JCT ECM sensing sustained pressure and relocating PILS (red) into position to begin degrading a very focal region of the basal lamina.
Figure 20.
Figure 20.
Degraded discontinuous basal lamina allows flow through and a giant vacuole with a pore is forming in the SCE, allowing fluid flow.
Figure 21.
Figure 21.
To control or restrain aqueous flow, the JCT cell moves or secretes new versican into the discontinuity and restricts or controls fluid passage by modulating position or concentrations of GAG chains.
Figure 22
Figure 22
Basement membrane components are restored and the basement membrane is continuous again and obstructs flow.
Figure 23.
Figure 23.
Colocalization of flow channel (red FluoSpheres) and versican (green) in collagen IV discontinuity (grey). Cropped and zoomed with Imaris software in HF region. Bar = 8 μm.
Figure 24.
Figure 24.
Colocalization of versican (green) with collagen IV discontinuities (grey) in apparent basal lamina discontinuities. Bar = 8 μm.

References

    1. Abu-Hassan DW, Li X, Ryan EI, Acott TS, Kelley MJ, 2015. Induced pluripotent stem cells restore function in a human cell loss model of open-angle glaucoma. Stem cells 33, 751–761. - PMC - PubMed
    1. Acott TS, Kelley MJ, 2008. Extracellular matrix in the trabecular meshwork (Review). Exp Eye Res 86, 543–561. - PMC - PubMed
    1. Acott TS, Kelley MJ, Keller KE, Vranka JA, Abu-Hassan DW, Li X, Aga M, Bradley JM, 2014. Intraocular pressure homeostasis: maintaining balance in a high-pressure environment. Journal of ocular pharmacology and therapeutics : the official journal of the Association for Ocular Pharmacology and Therapeutics 30, 94–101. - PMC - PubMed
    1. Acott TS, Kelley MJ, Keller KE, Vranka JA, Abu-Hassan DW, Li X, Aga M, Bradley JM, 2016. IOP Homeostasis - Why most people do not ever develop glaucoma, in: Knepper PA, Samples JR (Eds.), Glaucoma Research and Clinical Advances 2016-2018. Kugler Publications, Amsterdam, The Netherlands, pp. 87–98.
    1. Acott TS, Kingsley PD, Samples JR, Van Buskirk EM, 1988. Human trabecular meshwork organ culture: Morphology and glycosaminoglycan synthesis. Investigative Ophthalmology Visual Science 29, 90–100. - PubMed

Publication types